

Abstract
Background
The unpredictable nature of peptide binding to surfaces requires optimization of experimental containers to be utilized.
Objective
To demonstrate the variable recoveries of peptides from multiple surfaces commonly employed in peptide research by testing the recovery of radiolabeled 125I-endocrine peptides under different conditions and provide guidelines for determining the surfaces to use for other peptides.
Methods
125I-labeled peptides (ghrelin, sulfated cholecystokinin-8, corticotropin releasing factor, glucagon-like peptide-1 (GLP-1), insulin, leptin, nesfatin-1, peptide YY) representing a wide spectrum in net charge, size, end groups and modifications were incubated for 48h in glass and plastic tubes untreated or coated with siliconizing fluid. Best surfaces were chosen and peptides incubated with bovine serum albumin (BSA, 1%) with or without subsequent lyophilization. Recovery of 125I-peptides was determined by γ-counting.
Results
Important differences in 125I-peptide binding capacities to various types of surfaces exist. Siliconization decreased while addition of BSA improved recovery from surfaces tested. Lyophilizing solutions containing 125I-peptides and BSA in the tubes best suited for individual peptides rendered >89% recovery for all peptides. Ghrelin specifically displaced 125I-ghrelin from borosilicate glass while GLP-1 and Fmoc-arginine did not.
Conclusion
Choosing the appropriate experimental container avoids unpredictable peptide loss resulting in inaccurate measurements and false conclusions.
Keywords: test tube surface, endocrine peptide, radioimmunoassay, iodinated peptide
1. Introduction
Peptides and proteins are of amphiphatic nature and readily absorb to most surfaces [1]. This absorptive nature can lead to inaccurate results leading to wrong conclusions regarding potency and biological actions. When quantification of peptides from body fluids or tissues is the primary end point, absorption to surfaces used during the course of the study can cause problems and may lead to inaccurate estimations of total peptide content. Several approaches for individual purposes have been described in the literature to reduce surface binding such as adding Tween-20 and high salt concentrations [2], bovine serum albumin (BSA) [3; 4], coating tubes with polyethylene glycol (PEG) [5] or siliconizing agents or designing a solvent system that reduces the tendency of proteins to interact with a surface [6]. Although adding BSA to solvents or using it to coat surfaces seems to be the easiest approach, it is not feasible in some experiments such as purification of peptides and proteins for their analysis by mass spectrophotometry.
Quantitative measurement approaches using radioimmunoassays and ELISAs have become part of routine laboratory work and although great care is being taken to prevent enzymatic degradation of peptides by working at cold temperatures and adding protease inhibitors [7], in most settings, no great consideration is given to the substantial loss of peptides occurring due to surface binding and thus in many experiments no precautions are taken to prevent peptide loss to experimental containers.
We recently reported that the RAPID method of blood processing significantly improved recovery from blood [7] for 11 of 12 peptides tested. These studies led to the question of which experimental surfaces were best suited for peptide recovery. Here, we evaluate the surface binding capacity of eight radiolabeled peptides that are of interest in endocrine research and provide a summary as to which surface interferes less with the individual peptide to be measured. Peptides chosen were based on our previous study [7] and on a literature search for peptides that are of interest in endocrine and gastrointestinal research that are often measured in biological fluids and tissue extracts. Included were peptides selected for diversity in net ionic charge (−4 to +6), size (8 to 154 amino acids), end groups (free acid and amide carboxyl termini), and posttranslational modification (acylation and sulfation). The selected surfaces to be tested represent most of the surfaces likely to be utilized in peptide experiments including borosilicate and flint glass as well as polypropylene and polystyrene plastics, materials used to manufacture the greater part of laboratory containers and supplies.
The results demonstrate how crucial it is to determine the optimal experimental surface for peptide studies in the light of the present findings that no single surface is optimal for all peptides and at this time there are no rules to predict which surface would be best for a given peptide.
2. Materials and methods
2.1. Radiolabeled peptides and chemicals
The peptides utilized and their hydrophobicity plots are summarized in Table 1. All peptides used in this study were iodinated (125I) and purchased from scientific vendors listed in Table 2. Upon receipt, radiolabels were aliquoted and stored at −80 °C until use. Except for Bolton-Hunter cholecystokinin8-S (CCK-8S) which was aliquoted in saline, all radiolabels were aliquoted in 0.1% acetic acid.
Table 1.
Kyte-Doolittle hydrophobicity plots for labeled peptides
| Peptide | Sequence | Net Charge at pH 2.0 |
Kyte Doolittle Hydrophobicity Plots |
|---|---|---|---|
| Nesfatin-1 (r) | 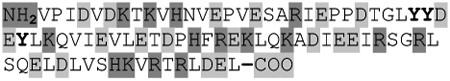 |
−4 | 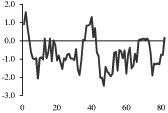 |
| PYY(1–36) (r) |  |
+1 | 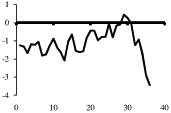 |
| Leptin (r) |  |
+3 |  |
| Insulin (h) | 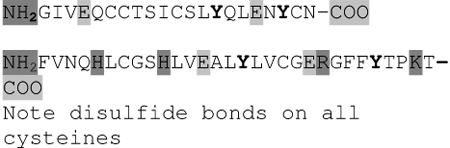 |
0 | 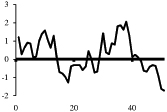 |
| GLP-1 (r, h) | 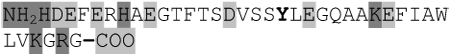 |
−2 |  |
| Ghrelin (h) | 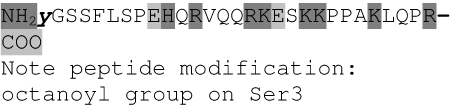 |
+6 |  |
| CRF (r, h) | 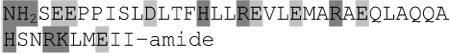 |
0 |  |
| CCK-8S (r, h) | −1 |  |
Depicted are amino acid sequences of the tested peptides. Acidic amino acids or carboxyl termini are labeled with light grey, basic amino acids or amino termini as well as histidines with dark grey. Potential labeling sites are indicated by a bold and upper case Y for tyrosines that are naturally present, a lower case y for tyrosines that have been added to synthetic peptides for labeling purposes or (bh) for Bolton-Hunter reagent. Kyte-Doolittle plots [9] display the distribution of polar and apolar residues along a protein or peptide sequence and can predict hydrophilic or hydrophobic regions. Regions with values above 0 are hydrophobic in character. Plots shown here have a window size of 7 which refers to the number of amino acids examined at a time to determine a point of hydrophobic character and is appropriate for finding hydrophilic regions that are likely exposed on the surface. The modifications of acyl ghrelin and CCK-8S are not incorporated in the respective plot. The fatty acid residue in ghrelin in position 3 most likely contributes to the hydrophobic character of the peptide while the sulfated tyrosine in CCK-8 will render the peptide more hydrophilic. (h), human, (r), rat.
Table 2.
Peptides and commercial source
| Studied peptides | Source |
|---|---|
| 125I-Ghrelin, (h) | Cat. # 9088-HK, Millipore Inc., Billerica, MA, USA |
| 125I-GLP-1, (r, h) | Cat. # 9035-HK, Millipore Inc. |
| 125I-Insulin, (h) | Cat. # 9011, Millipore Inc. |
| 125I-Leptin, (r) | Cat. # 9083, Millipore Inc. |
| 125I-PYY, (r) | Cat. # 9068-HK, Millipore Inc. |
| 125I-CRF, (r, h) | Cat. # T-019-06, Phoenix Pharmaceuticals, Burlingame, CA, USA |
| 125I-CCK-8S (Bolton Hunter labeled) (r, h) | Cat. # NEX 2030 Perkin Elmer, Covina, CA, USA |
| 125I-Nesfatin-1, (r) | T-003-02, Phoenix Pharmaceuticals |
Radiolabeled peptides and their commercial source including catalogue numbers are summarized in table 2. (h), human, (r), rat.
For displacement assays we used iodinated human (h) octanylated ghrelin and unlabeled octanylated (h)ghrelin (H-4864, Bachem, Torrance, CA, USA) because it has the same hydrophobic side chain attached to a hydrophilic peptide as the iodinated peptide. GLP-17–36 amide (Cat. # H-6795, Bachem) was used because it potently binds to many surfaces and therefore might bind to the same non-specific sites as ghrelin. Here, we focused on the effects of BSA, siliconizing reagent and Fmoc-arginine to prevent peptide binding and did not study other agents such as organic solvents, Tween-20, PEG or high salt concentrations. BSA was chosen because it is a common addition to many buffers, including radioimmunoassay buffers. The highest concentration tested was 300 µM (~2%). Fmoc-arginine-OH (B-1040, Bachem) is an inexpensive reagent that has a basic hydrophilic and a hydrophobic region and was used because it prevented loss of CCK-58 to glass surfaces during purification of synthetic rat CCK-58 [8]. Since it does not interfere with mass spectral analysis and if it efficiently prevented binding of peptides to surfaces, Fmoc-arginine could be a potential chemical to replace BSA in peptide studies involving mass spectral analysis.
2.2 Test tubes
For recovery experiments, six different test tubes commonly used in laboratories were chosen as detailed in table 3. All tubes were new. Glass culture test tubes were either borosilicate or flint glass which are the most common glass surfaces used for peptide research and in general. All microcentrifuge tubes as well as 15 or 50 mL capped test tubes consist of either polystyrene or polypropylene surfaces. Solid phase extraction cartridges, which are often used for sample preparation, are usually made with polypropylene. Furthermore, many radioimmunoassays are prepared in either plastic or glass tubes, glass might give a more stable pellet. For extraction of peptides and proteins from tissue or blood, sometimes ultrahigh centrifugation steps are required which demand the use of special centrifuge tubes that withstand high forces. These tubes usually consist of polyallomer or polycarbonate and therefore these plastics were included in our study.
Table 3.
Test tubes used and commercial availability by manufacturer
| Test tubes | Manufacturer |
|---|---|
| Borosilicate glass | Disposable culture tubes, 12×75 mm, Cat. # 14-961-26, Fisher Scientific |
| Flint glass | Disposable culture tubes, 12×75 mm, Cat. # 14-957-12, Fisher Scientific |
| Clear polystyrene plastic | Non-sterile plastic tube, 12×75 mm, Cat. # 14–961, Fisher Scientific |
| Translucent polypropylene plastic | Non-sterile plastic tube, 12×75 mm, Cat. # 14–959, Fisher Scientific |
| Polyallomer plastic | Ultra high speed thin wall centrifuge tube Beckman 326814 (13.5 mL) |
| Polycarbonate plastic | Ultra high speed thick wall centrifuge tube Beckman 355645 (10 mL) |
The nature of tubes that were tested are summarized and vendors and catalogue numbers are listed for reference.
Surface treatment with BSA can reduce sample losses caused by non-specific interactions with reaction vessels and containers, which can be significant when working with small amounts of protein [6]. More recent approaches use siliconizing reagents. Therefore, a second set of the six containers used in our study was treated with siliconizing fluid by immersion technique according to the manufacturer (AquaSil Fluid, ThermoScientific Cat. # 42799, Pierce Biotechnology, Rockford, IL, USA) to test whether this could improve recovery of radiolabeled peptides. AquaSil fluid forms silanol polymers in solution that react with the silanols on the glass surface. Covalent bonds are formed among the hydroxyls on the container surface and silicon from the siliconizing agent. According to the manufacturer, AquaSil siliconizing fluid is especially useful for protein chemistry applications because its working solution is prepared in water and does not require dilution in hazardous non-polar organic solvents.
2.3 Measurement of recovery
We chose working radiolabel concentrations of 10,000 cpm as this represents ~ 5 femtomole of peptide for most of the peptides used. This amount is at the lower level of amounts that can be practically analyzed with today’s methods. We have observed that increasing concentrations improves recovery. To avoid this confounding factor we have decided to work with amounts that should give minimal recoveries. Methods that can overcome losses at these low levels should be suitable for samples with higher amounts of peptide.
Solutions of radiolabeled peptides were prepared freshly in 0.1% acetic acid except Bolton-Hunter CCK-8S that was prepared in saline. Radiolabels (~10,000 cpm) were then added to 2 mL buffer in the various tubes (n=6) and incubated for 48 hours at 4 °C including two vortexing steps to resemble conditions similar to a radioimmunoassay (a very lengthy assay commonly performed with peptides to measure concentrations that requires mixing of contents by vortexing). Thereafter, 1 mL each was taken from the respective tube, transferred to a fresh borosilicate tube and counted with a gamma-counter for radioactivity (Wallac 1277, Perkin Elmer, Covina, CA, USA). Control tubes (Total count, TC) consisted of 1 mL of radiolabel in borosilicate tubes that were left to stand for 48 h at 4 °C but not manipulated and measured together with the other tubes. A measurement volume of 1 mL was chosen based on the observation that the gamma-counter efficiently counted a volume of ≤ 1 mL but efficiency dropped as the volume increased above 1 mL. Recovery was expressed as percentage and calculated as 100% x; (cpm after incubation/cpm TC).
In the first set of experiments, we compared recovery of each radiolabel in native test tubes versus siliconized test tubes. In the next set of experiments, the two best surfaces from the first experiment for each radiolabeled peptide were chosen and the experiment repeated with the addition of 1% bovine serum albumin (BSA fraction V, Cat. # 85040C, Sigma Aldrich, St. Louis, MO, USA) to the radiolabel solution. To test whether BSA would prevent loss of peptide during concentration to dryness the superior surface of the two was selected and radiolabel solution containing 1% BSA was added and test tubes concentrated to dryness with a non-heated speed vacuum concentrator (Savant, Thermo Scientific, Asheville, NC, USA) for 5–6 h. Thereafter, tubes were frozen overnight and contents reconstituted in 2 mL of 0.1 % acetic acid by vortexing. An aliquot of 1 mL was added to a new borosilicate glass tube for determination of loss during the drying process. This procedure resembles aliquoting and storage of peptides which is often performed in laboratories to keep aliquoted peptides for a longer time for use in future experiments.
2.4 Displacement assay
From the preliminary experiments it was determined that 125I-ghrelin binds to borosilicate tubes. It is postulated that adding excess amounts of the same unlabeled peptide will displace radiolabel from the surface as labeled and unlabeled peptides compete for binding on the glass surface. Here, we use 125I-ghrelin in borosilicate glass tubes and two cold peptides (ghrelin and GLP17–36 amide) (1), BSA (2) and Fmoc-arginine (3). Different amounts of BSA and peptides in magnitudes of 30-fold increases were added to the borosilicate tube containing radiolabel. Recovery was assessed as described above.
125I-ghrelin radiolabel (5000 cpm/1mL in 0.1% acetic acid) was added to borosilicate glass tubes followed by the immediate addition of 1 mL 0.1% acetic acid containing ghrelin peptide (600, 20, 0.6 nM), GLP-117–36 amide peptide (600, 20, 0.6 nM), BSA (20,000, 600, 20, 0.6 nM) or Fmoc-arginine (20,000, 600, 20, 0.6 nM) to reach a final volume of 2 mL. Tubes were vortexed twice during the incubation at 4 °C for 48 h. Control tubes consisted of 125I-ghrelin (5000 cpm/1mL in 0.1% acetic acid) added to borosilicate glass tubes and left to stand at 4 °C for 48 h. Recovery was calculated as detailed above.
2.5. Kyte-Doolittle hydrophobicity plots
Kyte-Doolittle plots are a widely applied scale for delineating hydrophobic regions of proteins and peptides [9]. Hydrophobicity (or hydrophilicity) plots are designed to display the distribution of polar and non-polar residues along a protein sequence with the goal of predicting the amino acid residues that form the core of a protein or membrane-spanning segments (highly hydrophobic) or regions that are likely exposed to water on the peptide surface (hydrophilic domains). Peptide sequences used here were plotted with a window size of 7 which refers to the number of amino acids examined at a time to determine a point of hydrophobic character and is appropriate for finding hydrophilic regions that are likely exposed on the surface. At each position, the mean hydrophobic index of the amino acids within the window is calculated and the value plotted as the midpoint of the window. Regions with values above 0 are hydrophobic in character (Table 1). The octanoyl group on ghrelin was excluded from the calculation of ghrelin’s hydrophobicity values. It is known that the acyl modification increases the hydrophobicity of the peptide, based on duration of the retention time during high pressure liquid chromatography (HPLC) [10]. We were also unable to obtain hydrophobicity values for the sulfate group on tyrosine of CCK or the Bolton-Hunter amino terminal group of the CCK analog utilized and therefore these modifications were excluded from hydrophobicity plot analysis.
2.6. Statistical analysis
Recovery data were analyzed by analysis of variance (ANOVA) followed by all pair wise multiple comparison procedures (Tukey post hoc test). Differences were considered significant when p < 0.05. Data are expressed as mean ± SEM.
3. Results
3.1. Minimum and maximum peptide recovery
High peptide losses occur when the improper test tube is chosen for experiments (Fig. 1). For ghrelin (20.0 ± 1.4% vs. 90.3 ± 1.9%, p < 0.001) and CCK-8S (16.0 ± 1.2 vs. 86.3 ± 1.2, p < 0.001) up to 70% of radiolabel bound to the surface of flint glass or polystyrene, respectively, which could be avoided by changing the tube to polypropylene (Fig. 1). In contrast, insulin recovery is lowest from polypropylene tubes and highest from polyallomer (10.9 ± 0.4 vs. 68.3 ± 5.8, p < 0.001, Fig. 1, Table 4). The smallest variation in surface binding was found for nesfatin-1 and CRF where recoveries only, but statistically significantly, differed by ~ 5% between best and worst tube tested although it has to be noted that the maximum recovery for nesfatin-1 was 32.0 ± 1.5% and for CRF 61.5 ± 1.6% from natural borosilicate glass (p < 0.05, Fig. 1, Table 5). For PYY, leptin and GLP-1 polystyrene gave significantly lower recoveries compared to borosilicate glass, which provided the maximum recovery for these peptides (9.3 ± 0.6 vs. 67.7 ± 6.8; 21.9 ± 1.9 vs. 60.3 ± 1.7; 3.7 ± 0.2 vs. 39.6 ± 1.2, respectively; p < 0.001, Fig. 1, Table 5).
Fig. 1.

Magnitude of peptide loss assessed by percentage recovery. Depicted are recoveries of 125I-labeled peptides from their respective highest binding surface (minimum recovery, white bars) compared to the lowest (maximum recovery, black bars). Significantly higher recoveries resulted from use of borosilicate glass for nesfatin-1, PYY, leptin, GLP-1 and CRF. Polypropylene plastic yielded significantly higher recoveries for ghrelin and CCK-8S while polyallomer gave maximum recovery for insulin. The use of polystyrene plastic resulted in minimum recovery for PYY, leptin, GLP-1, CRF and CCK-8S, use of polycarbonate plastic, polypropylene plastic and flint glass resulted in lowest recoveries for nesfatin-1, insulin and ghrelin, respectively. * p < 0.05 and *** p < 0.001.
Table 4.
Recovery of 8 peptides from polyallomer or polycarbonate surface, with or without prior siliconization
| Surface | Nesfatin-1 Recovery |
PYY Recovery |
Leptin Recovery |
Insulin Recovery |
GLP-1 Recovery |
Ghrelin Recovery |
CRF Recovery |
CCK-8S Recovery |
|---|---|---|---|---|---|---|---|---|
| Polyallomer | 30.9 ±1.5 | 49.6 ±5.9 | 45.2 ±2.2 | 68.3 ±5.8*** | 23.0± 0.6 | 31.3 ±2.6*** | 56.7 ±1.3 | 72.7± 3.2 |
| Polyallomer, siliconized | 30.6± 1.2 | 18.9 ±5.1 | 41.2 ±2.5 | 19.2± 3.1 | 5.9 ±0.7 | 72.3 ±2.8 | 59.9 ±0.9 | 63.8± 2.5 |
| Polycarbonate | 27.4 ±0.6 | 51.5 ±1.7 | 29.8 ±0.3 | 16.1 ±0.8 | 13.1± 1.9 | 72.4 ±0.5 | 57.0 ±0.7 | 67.0 ±4.7 |
| Polycarbonate, siliconized | 41.9± 5.6 | 65.2 ±8.0 | 42.2± 4.2 | 21.9 ±2.9 | 11.0± 1.8 | 63.6 ±5.0 | 62.8± 3.9 | 26.9 ±3.3 |
p < 0.001 vs. polycarbonate
Table 5.
Average percentage of recovery from best surface and improvement by addition of 1% BSA for the 8 peptides tested
| Peptide | Surface | Recovery (%) | |
|---|---|---|---|
| Without BSA | Addition of 1% BSA | ||
| Nesfatin-1 | borosilicate glass | 32.0 ± 1.5 | 90.7 ± 3.4 |
| PYY | borosilicate glass | 67.7 ± 6.8 | 96.0 ± 2.7 |
| Leptin | borosilicate glass | 60.3 ± 1.7 | 92.7 ± 3.3 |
| CRF | borosilicate glass | 61.5 ± 1.6 | 90.6 ± 2.9 |
| GLP-1 | borosilicate glass | 39.6 ± 1.2 | 85.3 ± 2.8 |
| Insulin | borosilicate glass | 54.6 ± 2.1 | 95.7 ± 2.4 |
| Ghrelin | polypropylene plastic | 90.3 ± 1.9 | 93.9 ± 2.5 |
| CCK-8S | polypropylene plastic | 86.3 ± 1.2 | 98.3 ± 0.8 |
Borosilicate glass tubes gave maximal recovery for nesfatin-1, PYY, leptin, GLP-1 and CRF while polypropylene plastic was best for ghrelin and CCK-8S. Note: Polyallomer plastic, that is mostly used as material for high speed centrifugation tubes, gave a better recovery of 125I-insulin (68.3 ± 5.8%) than borosilicate glass. Addition of 1% BSA significantly improved recovery.
3.2. Recovery of peptides from glass surfaces
The two glass surfaces tested were borosilicate and flint glass. All 125I-peptides tested displayed higher binding affinity to the flint glass surface compared to borosilicate (Fig. 2). The use of borosilicate glass tubes significantly improved the percentage of recovery for PYY (67.8 ± 6.9% vs. 31.0 ± 4.0%, p < 0.001), leptin (60.3 ± 1.7% vs. 55.8 ± 0.6%, p < 0.05), insulin (54.6 ± 2.2% vs. 44.5 ± 0.9%, p < 0.01), GLP-1 (39.6 ± 1.2% vs. 25.4 ± 3.3%, p < 0.01), ghrelin (62.7 ± 2.1% vs. 20.1 ± 1.4%, p < 0.001) and CRF (61.5 ± 1.6% vs. 57.0 ± 0.6%, p < 0.05) compared to flint glass, whereas recoveries for nesfatin-1 (32.0 ± 1.5% vs. 28.2 ± 0.7%) and CCK-8S (84.3 ± 1.9% vs. 83.5 ± 0.5%) were not changed (p > 0.05). The highest recovery from either flint or borosilicate glass was observed for CCK-8S.
Fig. 2.

Recovery of 125I-labeled gastrointestinal peptides from glass surfaces. Eight radioactively labeled peptides were incubated for 48 h in flint (white bars) and borosilicate glass (black bars) tubes and recovery from surface determined by gamma-counting. PYY, insulin, GLP-1, ghrelin and CRF show higher binding to flint glass compared to borosilicate glass as reflected by significantly poorer recovery. * p < 0.05, ** p < 0.01, *** p < 0.001.
3.3. Recovery of peptides from plastic surface
The two plastic surfaces most commonly used in laboratory settings are polystyrene and polypropylene. The use of polypropylene plastic was superior or equal to polystyrene for all peptides studied (Fig. 3). The use of polypropylene plastic tubes significantly improved the percentage of recovery over polystyrene plastic tubes for PYY (62.2 ± 2.5% vs. 9.3 ± 0.6%, p < 0.001), GLP-1 (20.5 ± 0.8% vs. 3.7 ± 0.2%, p < 0.001), CRF (59.7 ± 1.1% vs. 55.8 ± 1.1%, p < 0.01) and CCK-8S (86.3 ± 1.2% vs. 16.0 ± 1.2%, p < 0.001), whereas recoveries for nesfatin-1 (30.8 ± 1.1% vs. 30.4 ± 0.4%), leptin (24.1 ± 0.5% vs. 21.9 ± 1.9%) and insulin (10.9 ± 0.5% vs. 11.1 ± 0.2%) were unchanged (p > 0.05) but below 31%. The highest recovery from either polystyrene or polypropylene compared to the other tubes tested was observed for ghrelin (90.3 ± 1.9% vs. 88.3 ± 0.4%, p > 0.05).
Fig. 3.

Recovery of 125I-labeled gastrointestinal peptides from plastic surfaces. Eight radioactively labeled peptides were incubated for 48 h in polystyrene (white bars) and polypropylene plastic tubes (black bars) and recovery from surface determined by gamma-counting. PYY, GLP-1, CRF and CCK-8S show higher binding to polystyrene tubes compared to polypropylene as reflected by significantly poorer recovery. ** p < 0.01, *** p < 0.001.
Other plastic surfaces analyzed were made of polyallomer and polycarbonate (Table 4) and are commonly used in high speed centrifugation steps. Polyallomer yielded the highest recovery for insulin compared to all other tubes while polycarbonate resulted in a significantly lower yield compared to polyallomer (16.1 ± 0.8% vs. 68.3 ± 5.8%, p < 0.001). For PYY, CRF and CCK-8S, polyallomer and polycarbonate gave comparable recoveries (≥ 50%), while nesfatin-1, leptin, GLP-1 and ghrelin recovered at < 50% (Table 4). Polyallomer and polycarbonate gave poorer recoveries than polypropylene for CCK-8S, CRF, ghrelin, and PYY (Table 4, Fig. 3). A significantly lower recovery was found for ghrelin when polyallomer was used compared to polycarbonate (31.3 ± 2.6 % vs. 72.4 ± 0.5 %, p < 0.001).
3.4. Recovery after siliconization
Unexpectedly, for the majority of peptides, siliconization treatment of the tube that had previously given the best recovery, did not improve recovery but significantly decreased it by 53% for PYY, 49% for insulin, 46% for CCK-8S, 32% for GLP-1, 21% for leptin, and 5% for CRF (p < 0.001 except CRF: p < 0.05, Fig. 4). Siliconization of the previous best test tube did not change recoveries for nesfatin-1 and ghrelin but siliconized polycarbonate tubes yielded the best recovery for nesfatin-1 (41.9 ± 5.6%) and CRF (62.8 ± 3.9%) compared to all other tubes, siliconized or not (Table 4).
Fig. 4.

Reduction of recovery by siliconizing treatment. Shown are the best surfaces for each peptide before (white bars) and after siliconization (black bars) of test tubes. Siliconization results in significantly lower recovery of radioactivity for all peptides except nesfatin-1 and ghrelin where recovery was not altered. * p < 0.05 and *** p < 0.001.
3.5. Improvement of recovery by the addition of bovine serum albumin
The peptides tested were all recovered differently, depending on the surfaces, but often, recoveries were not satisfactory (< 50%) or worsened by siliconization treatment. We therefore tried improving recovery by adding BSA to the solution containing the radiolabeled peptide and incubating the mixture in the optimal test tube determined from the prior experiments. Figure 5 shows the improvement for each 125I-peptide when 1% BSA was added to the radiolabel solution that was then incubated in the test tube that gave the best recovery before, with or without siliconization.
Fig. 5.

Improvement of recovery by addition of bovine serum albumin to the best (least binding) surface. Shown are the best surfaces when peptides were incubated for 48 h without presence of BSA (white bars) compared to improvement by the addition of BSA to the respective 125I solution and consecutive incubation for 48 h (black bars) which results in significantly higher recovery of radioactivity for all peptides except ghrelin where there was no significant improvement. ** p < 0.01, *** p < 0.001.
Addition of 1% BSA significantly improved recovery for most peptides evaluated and never increased losses (Table 5). The BSA improved recovery for nesfatin-1 (97.0 ± 0.7% vs. 41.9 ± 5.9%, p < 0.001) and CRF (95.1 ± 1.4% vs. 62.8 ± 3.9%, p < 0.001) from siliconized polycarbonate, PYY (96.0 ± 2.7% vs. 67.7 ± 6.8%, p < 0.01), leptin (92.7 ± 3.3% vs. 60.3 ± 1.7%, p < 0.001) and GLP-1 (85.3 ± 2.8% vs. 39.6 ± 1.2%, p < 0.001) from borosilicate glass and for insulin from polyallomer (94.5 ± 1.2% vs. 68.3 ± 5.8%, p < 0.01). Recovery for ghrelin was best from untreated polypropylene tubes (90.3 ± 1.9%, Fig. 3) and only non-significantly increased to 93.9 ± 2.5% by the addition of BSA (Fig. 5).
3.6. Lyophilization of radiolabeled peptides
Next, we assessed whether adding a lyophilization step would increase losses. Lyophilization was achieved by speed vacuum concentration without heating. For this study the test tubes (siliconized or not) that gave best recoveries for each radiolabel when diluted in BSA-containing buffer were used and contents lyophilized and thereafter stored overnight at −80 °C. For all 125I-peptides the recovery after lyophilization was not significantly different from recovery without lyophilization step and stayed above 90% (data not shown, compare to Fig. 5) except GLP-1 which showed recovery of < 90% (85.3 ± 2.8% without lyophilization vs. 89.4 ± 7.3% after lyophilization, p > 0.05).
3.7. Displacement of ghrelin radiolabel
Radiolabeled ghrelin in 0.1% acetic acid binds to borosilicate glass (Fig. 6). Some, but not all of the labeled peptide can be displaced by cold (h)ghrelin in a dose-dependent manner (Fig. 6A). The order of addition of cold ghrelin (either before or after the radiolabel) did not influence the binding (data not shown). To determine whether another peptide that showed binding to borosilicate glass could displace ghrelin radiolabel, cold GLP-1 was added to the test tubes. No improvement in ghrelin recovery was found (Fig 6B). Fmoc-Arg did not improve recovery by displacement of radiolabeled ghrelin (Fig 6C). With the addition of BSA, there was a dose dependent improvement of recovery of radiolabeled ghrelin, reaching full recovery at a concentration of 10 µM (0.066%) BSA (99.07 ± 0.43%, Fig. 6D). Addition of 300 µM (1.98%) BSA gave similar results (92.73 ± 4.46%, data not shown).
Fig. 6.

Ghrelin dose-dependently displaces 125I-ghrelin from borosilicate glass. To determine whether binding of 125I-ghrelin to borosilicate could be prevented by addition of another chemical, different concentrations of ghrelin (A), GLP-1 (B), Fmoc-arginine (C) and BSA (D) were added to the test tubes together with ghrelin radiolabel and incubated. While cold ghrelin and BSA dose-dependently displaced 125I-ghrelin from the borosilicate glass surface, GLP-1 and Fmoc-arginine did not.
4. Discussion
The present data demonstrate that choosing a glass or plastic surface for conducting peptide experiments must be done with great care. The common concept that all glass surfaces are equally suitable should be reconsidered. The inappropriate type of glass could change recovery from 63% to 20% as observed for 125I-ghrelin. Likewise, the proper plastic ware must be utilized. The largest difference in recovery from plastic was found for CCK-8S which varied from 16% with the use of polystyrene to 86% with polypropylene tubes.
Clearly, how any peptide binds to either glass or plastic cannot be predicted from these studies. Three of the peptides were basic (PYY, leptin, ghrelin), three were acidic (nesfatin-1, GLP-1, CCK-8S) and two non-charged (insulin, CRF) but there is no obvious pattern of their binding preference. Interestingly, ghrelin is recovered in much higher yields from plastic than glass, a result that is counter-intuitive because of the hydrophobic side chain (Table 1) of ghrelin that could interact with organically based plastic surfaces. Furthermore, we used iodinated peptides as a model for the natural peptide and it cannot be excluded that the iodination interferes with biochemical properties of the peptide. Therefore, the recovery data presented here can only serve as an approximation to guide the investigator. However, the great range in recoveries suggests the peptides variability is the cause for different recoveries, not the presence of iodine.
Presently, it is impossible to predict which surface should be used for peptides that were not tested in this study and data obtained here should not simply be applied to other peptides. The two peptides with the highest hydrophobicity, leptin and insulin, are lost to a great extent to both plastic surfaces. This seems like a developing pattern until the recovery of GLP-1 is examined. GLP-1 is lost to a similar degree as leptin and insulin to plastic surfaces but GLP-1 is more hydrophilic than hydrophobic. Other attempts to correlate peptide size, net charge, or regional charge distribution likewise show no pattern of preferred binding to glass or plastic. Borosilicate glass is equal to or better than flint glass for minimizing loss. Likewise, polypropylene is equal to or better than polystyrene for minimizing loss for the set of peptides tested here. Plastic tubes yield the best recovery for ghrelin, but the worst recovery for leptin and insulin. Therefore, predictions of peptide binding based on their biochemical properties are not possible.
It has long been held that siliconizing glassware could help prevent peptide loss [11]. However, with the set of peptides in this study there was improvement after siliconization only for CRF and nesfatin-1 while in all other cases losses increased with this reagent commonly used in an attempt to improve recovery.
The results have practical implications for many types of experiments. Glass and plastic ware are used during multiple steps of an experiment and usually surfaces are randomly chosen and the surface type often changes as an experiment progresses. An example demonstrates the potential for multiple surfaces in a typical experiment of determining the molecular forms of a peptide in tissue. Flint glass beakers might be used for collection and homogenization of tissue, polyallomer could be utilized for high speed centrifugation. The sample could be exposed to polypropylene, silica, and C18 during a SepPak concentration step. The SepPak fractionated fraction could be collected into polystyrene test tubes. Radioimmunoassay of the SepPak fraction could be done in borosilicate test tubes. The tubes containing the immunoreactive SepPak fraction might be pooled, diluted and chromatographed by HPLC on a polymer phenyl column and collected into polystyrene tubes. Another radioimmunoassay in polystyrene test tubes could show the fractions to be utilized for mass spectral analysis. These fractions might be dried completely by lyophilization in the polystyrene tubes they were collected in. Thus, there may be eight different surfaces that the peptide would encounter during this experiment that is being done routinely in laboratories throughout the world that prepare tissue or blood extracts for mass spectral analysis. However, if an investigator demonstrated that the peptide was best recovered from polypropylene only this surface could be used for sample collection and homogenization, centrifugation and fractionation and analysis steps. The only unique surfaces encountered would be during chromatography. BSA could be used to obtain higher yields during collection and storage of samples, except during the final chromatography before mass spectral analysis.
Some distributors of commercially available RIA kits indicate the test tube to be used in their assay. For example, Millipore specifies that borosilicate glass tubes should be used for ghrelin, insulin, leptin and PYY but polypropylene or polystyrene tubes may be used if the investigator finds that the pellet formation is acceptably stable in their system (technical information from Millipore RIA booklet provided with kits GHRT-89HK, GHRA-88HK HI-14HK, RL-83K and RMPYY-68HK). From our results for 125I-ghrelin polystyrene and polypropylene plastic tubes were clearly superior in recovery compared to borosilicate glass while 125I-insulin and 125I-leptin showed higher recovery when assayed in borosilicate glass, and 125I-PYY gave >60% recovery in borosilicate glass and polypropylene but not polystyrene. However, for radioimmunoassays stable pellet formation is essential so that the investigator has to consider carefully which advantage is of greater importance. The booklet for the active and total GLP-1 RIA states that borosilicate glass tubes should be used, with the clear indication that polypropylene or polystyrene tubes may not be used as GLP-1 sticks to these tubes (technical information from Millipore RIA booklet provided with kits GLP1T-36HK and GLP1A-35HK). We confirm these suggestions but it has to be pointed out that although borosilicate glass gave superior recovery compared to polystyrene and polypropylene, it still only recovered 125I-GLP-1 at 40%. Addition of BSA more than doubled recovery. Nonetheless, instructions for 125I-CRF specifically tell the consumer to reconstitute the radiolabel with distilled water (Phoenix Pharmaceuticals homepage). Losses of 125I-CRF could therefore even occur before the experiment has started during reconstitution of the radiolabel. However, during the RIA process peptide and label losses are most likely negligible since commercially available RIA buffers usually contain BSA which significantly improved recovery for all radiolabeled peptides tested. Unfortunately, for some types of experiments such as certain mass spectral analysis experiments BSA cannot be used. Thus, we assessed whether the addition of Fmoc-arginine, an inexpensive reagent which was shown to prevent loss of CCK-58 to glass surfaces [8], would prevent sticking of peptides to surfaces equally well as BSA or (h)ghrelin by displacement. In our assay, addition of various concentrations of Fmoc-arginine to 125I-ghrelin did not displace the radiolabel from borosilicate surface. Therefore, at least for ghrelin assays, Fmoc-arginine will not serve as an alternative to BSA. At this time, the only recommendation we can make for samples that are to be analyzed by mass spectral analysis is to keep BSA present until the last chromatography step and the effluent of this last chromatography step should go directly into the mass spectrometer for analysis thus preventing losses of a very pure peptide on collection and storage surfaces. This eliminates both, the exposure of the pure peptide to a surface it could interact with and the time necessary for the interaction to take place. The results do not apply to test tube surfaces only. Most pipette tips are made of polypropylene plastic, and this plastic only gave acceptable recoveries >80% for ghrelin and CCK-8S but some peptides such as 125I-GLP-1 and 125I-leptin are recovered poorly (~20%) from polypropylene. Furthermore, many functional animal studies require the preparation of peptide solutions to be injected centrally or peripherally. To prepare the injection solution of a certain concentration, peptides are usually weighed out freshly or frozen aliquots are used and diluted into a vehicle solution that may or may not contain BSA. However, without the knowledge that peptide exposure time to certain glass or plastic tubes should be kept to a minimum and vigorous vortexing increases the exposure surface, considerable losses of bioactive peptide may occur and experimental results, especially of dose response studies, might become difficult to interpret. Therefore, in general, the time of exposure for peptides to pipette tips and all other containers should be minimized.
We have recently published a new method for processing blood, the RAPID method [7] where we used polystyrene tubes because of excellent recovery of radiolabeled CCK-58. Of note was the improvement of iodinated CCK-58 recovery from SepPaks in the presence of rat blood (mainly rat serum albumin). Without blood SepPak recovery was 65% while in the presence of blood the recovery of iodinated CCK-58 was 85% [7]. It should not be omitted that zip tips, mostly made of polypropylene, are also widely used to prepare samples for mass spectrometry, high performance liquid chromatography, capillary electrophoresis or atomic absorption spectroscopy. However, it should be noted that due to their small volume these are not suitable for purification of peptides that are not very abundant and thus large quantities of starting material such as blood or tissue, have to be used.
The observed levels of an endocrine peptide can vary several folds depending on the experimental protocol, and some of this variation may be due to the surfaces used in collection and analysis steps. For example, the endogenous peptide levels are critical in evaluating the biological functions of CCK. CCK is not thought to act at the CCK2 receptor because it circulates at 10-times lower levels compared to gastrin (postprandial gastrin: 40 pM [12], presumed postprandial levels of CCK: 4 pM [13]). When care to improve recovery is applied, the value observed for CCK-58 was 17 pM, an amount that could cause activation of the CCK2 receptor in the presence of postprandial levels of gastrin. This demonstrates the importance of correct assessment of peptide levels where losses due to surface binding are minimized. Incorrect data due to losses on container surfaces can cause erroneous interpretation of functional studies.
For CRF all tubes tested here showed equally sub-optimal binding properties between 55–61% leading to the conclusion that most likely 40–50% of the CRF is lost due to surface binding to experimental containers if no other preventive steps are taken. On the other hand, various analogues of CRF have been developed [14] which most likely exhibit other binding properties to tube surfaces compared to CRF. Thus, it is crucial that each investigator evaluate the peptide or analogue to be used to assess the conditions for optimal recovery.
The importance of choosing the proper surface can be observed by calculating the recovery of leptin from its most and least binding surface (polystyrene and borosilicate, respectively). If losses during fractionation and storage are the same as the recovery of the iodinated leptin for each of hypothetical four steps then recovery from polystyrene would be 0.2% and from borosilicate 13.2%. If 1% BSA were added to the borosilicate tubes the recovery of leptin would become 73.8% after having used four different borosilicate glass tubes during four experimental steps. Therefore, careful consideration must be made on the surfaces and the number of surfaces a peptide is exposed to during various physiological, biochemical and analytical experiments. Although very sensitive analytical tools are available, unexpected loss can result in an inability to analyze the peptide and the differential loss of two peptides could change the observed ratio of the two forms with concomitant conclusions about which peptide to use in physiological studies. This is especially important where two forms of a peptide have a different spectrum of physiological activity as observed with CCK-8 and CCK-58 [15] or acyl and desacyl ghrelin [16]. Proper choice of experimental surfaces is essential in creating the most valid protocol in experiments with peptides. Table 5 details the best surface for the peptides in this study. Most peptides (nesfatin-1, PYY, leptin, CRF, GLP-1 and insulin) bind least to borosilicate glass in the presence of 1% BSA (insulin was recovered equally from borosilicate glass and polyallomer plastic if BSA is present). Ghrelin and CCK-8 bind least to polypropylene in the presence of 1% BSA.
In conclusion, at this time it is impossible to predict which surface will give the best recovery for any given peptide. Possible indicators such as net charge, regional charge distribution, regional or net hydrophobicity, or chain lengths do not consistently predict the correct container surface that would yield optimal peptide recovery. The surfaces evaluated before an experiment could be reduced to borosilicate glass and polypropylene plastic which gave the best recoveries for 7 of the 8 peptides tested here (we do not recommend polyallomer which was best for insulin because it is not widely available and borosilicate glass gave nearly the same recovery as polyallomer) and use BSA to further reduce loss, but this is as much as can be recommended using the current data. Each peptide has its own unique binding properties and each type of surface reacts with various chemical groups of peptides. At this time only experimental verification can guide an investigator to the optimal surface for use in tests with peptides.
Acknowledgments
This work was supported by Center grant DK-41301 (Peptidomic RIA Proteomic Core, J.R.R., Jr. and Animal Core, Y.T.) and RO1 DK-83449 (J.R.R., Jr.).
Footnotes
Publisher's Disclaimer: This is a PDF file of an unedited manuscript that has been accepted for publication. As a service to our customers we are providing this early version of the manuscript. The manuscript will undergo copyediting, typesetting, and review of the resulting proof before it is published in its final citable form. Please note that during the production process errors may be discovered which could affect the content, and all legal disclaimers that apply to the journal pertain.
References
- 1.Macritchie F. Proteins at interfaces. Adv Protein Chem. 1978;32:283–326. doi: 10.1016/s0065-3233(08)60577-x. [DOI] [PubMed] [Google Scholar]
- 2.Smith JA, Hurrell JG, Leach SJ. Elimination of nonspecific adsorption of serum proteins by Sepharose-bound antigens. Anal Biochem. 1978;87:299–305. doi: 10.1016/0003-2697(78)90679-6. [DOI] [PubMed] [Google Scholar]
- 3.Felgner PL, Wilson JE. Hexokinase binding to polypropylene test tubes. Artifactual activity losses from protein binding to disposable plastics. Anal Biochem. 1976;74:631–635. doi: 10.1016/0003-2697(76)90251-7. [DOI] [PubMed] [Google Scholar]
- 4.Lloyd T, Walega MA. Purification of tyrosine hydroxylase by high-pressure liquid chromatography. Anal Biochem. 1981;116:559–563. doi: 10.1016/0003-2697(81)90402-4. [DOI] [PubMed] [Google Scholar]
- 5.Kramer KJ, Dunn PE, Peterson RC, Seballos HL, Sanburg LL, Law JH. Purification and characterization of the carrier protein for juvenile hormone from the hemolymph of the tobacco hornworm Manduca sexta Johannson (Lepidoptera: Sphingidae) J Biol Chem. 1976;251:4979–4985. [PubMed] [Google Scholar]
- 6.Suelter CH, DeLuca M. How to prevent losses of protein by adsorption to glass and plastic. Anal Biochem. 1983;135:112–119. doi: 10.1016/0003-2697(83)90738-8. [DOI] [PubMed] [Google Scholar]
- 7.Stengel A, Keire D, Goebel M, Evilevitch L, Wiggins B, Taché Y, Reeve JR., Jr. The RAPID method for blood processing yields new insight in plasma concentrations and molecular forms of circulating gut peptides. Endocrinology. 2009;150:5113–5118. doi: 10.1210/en.2009-0697. [DOI] [PMC free article] [PubMed] [Google Scholar]
- 8.Reeve JR, Jr., Wu SV, Keire DA, Faull K, Chew P, Solomon TE, Green GM, Coskun T. Differential bile-pancreatic secretory effects of CCK-58 and CCK-8. Am J Physiol Gastrointest Liver Physiol. 2004;286:G395–G402. doi: 10.1152/ajpgi.00020.2003. [DOI] [PubMed] [Google Scholar]
- 9.Kyte J, Doolittle RF. A simple method for displaying the hydropathic character of a protein. J Mol Biol. 1982;157:105–132. doi: 10.1016/0022-2836(82)90515-0. [DOI] [PubMed] [Google Scholar]
- 10.Kojima M, Hosoda H, Kangawa K. Purification and distribution of ghrelin: the natural endogenous ligand for the growth hormone secretagogue receptor. Horm Res. 2001;56 Suppl 1:93–97. doi: 10.1159/000048143. [DOI] [PubMed] [Google Scholar]
- 11.Seed B. Silanizing glassware. Curr Protoc Protein Sci Appendix. 2001;3 doi: 10.1002/0471140864.psa03es13. Appendix 3E. [DOI] [PubMed] [Google Scholar]
- 12.Dimaline R, Evans D, Forster ER, Sandvik AK, Dockray GJ. Control of gastric corpus chromogranin A messenger RNA abundance in the rat. Am J Physiol. 1993;264:G583–G588. doi: 10.1152/ajpgi.1993.264.3.G583. [DOI] [PubMed] [Google Scholar]
- 13.Nolan LJ, Guss JL, Liddle RA, Pi-Sunyer FX, Kissileff HR. Elevated plasma cholecystokinin and appetitive ratings after consumption of a liquid meal in humans. Nutrition. 2003;19:553–557. doi: 10.1016/s0899-9007(03)00039-x. [DOI] [PubMed] [Google Scholar]
- 14.Grace CR, Perrin MH, Cantle JP, Vale WW, Rivier JE, Riek R. Common and divergent structural features of a series of corticotropin releasing factor-related peptides. J Am Chem Soc. 2007;129:16102–16114. doi: 10.1021/ja0760933. [DOI] [PubMed] [Google Scholar]
- 15.Glatzle J, Raybould HE, Kueper MA, Reeve JR, Jr., Zittel TT. Cholecystokinin-58 is more potent in inhibiting food intake than cholecystokinin-8 in rats. Nutr Neurosci. 2008;11:69–74. doi: 10.1179/147683008X301432. [DOI] [PubMed] [Google Scholar]
- 16.Inhoff T, Mönnikes H, Noetzel S, Stengel A, Goebel M, Dinh QT, Riedl A, Bannert N, Wisser AS, Wiedenmann B, Klapp BF, Taché Y, Kobelt P. Desacyl ghrelin inhibits the orexigenic effect of peripherally injected ghrelin in rats. Peptides. 2008;29:2159–2168. doi: 10.1016/j.peptides.2008.09.014. [DOI] [PMC free article] [PubMed] [Google Scholar]