

Abstract
Objectives. Admission hyperglycemia and B-type natriuretic peptide (BNP) are associated with mortality in acute coronary syndromes, but no study compares their prediction in-hospital death. Methods. Patients with non-ST-elevation myocardial infarction (NSTEMI), in-hospital mortality and two-year mortality or readmission were compared for area under the curve (AUC), sensitivity (SEN), specificity (SPE), positive predictive value (PPV), negative predictive value (NPV), and accuracy (ACC) of glycemia and BNP. Results. Respectively, AUC, SEN, SPE, PPV, NPV, and ACC for prediction of in-hospital mortality were 0.815, 71.4%, 84.3%, 26.3%, 97.4%, and 83.3% for glycemia = 200 mg/dL and 0.748, 71.4%, 68.5%, 15.2%, 96.8% and 68.7% for BNP = 300 pg/mL. AUC of glycemia was similar to BNP (P = 0.411). In multivariate analysis we found glycemia ≥200mg/dL related to in-hospital death (P = 0.004). No difference was found in two-year mortality or readmission in BNP or hyperglycemic subgroups. Conclusion. Hyperglycemia was an independent risk factor for in-hospital mortality in NSTEMI and had a good ROC curve level. Hyperglycemia and BNP, although poor in-hospital predictors of unfavorable events, were independent risk factors for death or length of stay >10 days. No relation was found between hyperglycemia or BNP and long-term events.
1. Introduction
In recent years, incorporation of new laboratory methods in clinical practice has improved diagnosis and prognostic prediction of outcomes in acute coronary syndromes (ACS). Cardiac troponins, with high sensitivity and specificity for diagnosing myocardial injury [1], and B type natriuretic factor (BNP), primarily used in acute decompensation of heart failure but with prognostic significance in ACS [2], are useful in the initial evaluation of patients with acute chest pain [3–5]. Glycemia, determined by using a simple, low-cost laboratory test, has been associated with a worse prognosis in ACS patients, even in the absence of diabetes [6].
Studies have shown BNP as a prognostic factor for both early and late outcomes in non-ST elevation ACS, a presumed reflection of left ventricular dysfunction [7]. Non-ST elevation myocardial infarction (NSTEMI) has lower in-hospital mortality than ST elevation myocardial infarction has, but higher unadjusted events in years following hospitalization [8]. So, we hypothesized that hyperglycemia and BNP could predict patients at risk for both in-hospital and 2-year events.
2. Methods
2.1. Study Design and Population
Patients with ACS admitted consecutively between January 2005 and April 2006 to an urban academic cardiology emergency single center in São Paulo, Brazil were prospectively evaluated with their data registered in the institution's database. Baseline clinical and admission laboratory characteristics, CAD risk factors, medicines used, in-hospital outcomes, angiography, and treatments were observed. The Ethics Committee of the hospital approved this study. A total of 1304 ACS patients were included, and a subgroup of 170 NSTEMI-only patients with admission BNP were followed up for two years. Inclusion criteria were ACS hospital admission, according to the international consensus definition [9], age older than 18 years, and willing to provide written informed consent. Exclusion criteria were non-NSTEMI ACS and incomplete laboratory data. Completed data were available for 96 NSTEMI patients, and written informed consent was obtained from all participants.
2.2. Definitions and Data Collection
Clinical outcomes were defined as death, or death and prolonged length of stay (>10 days; mean of length of stay). Length of stay was defined as an outcome, because 90% of patients at our emergency department undergo angiographic study in 48 hours. In this setting, reinfarction or refractory angina are infrequent events at hospitalization. Mean length of stay was 10.5 and median 3.8 days (range: 0.4 to 124.6), and follow-up mean was 21.7 and median 23.2 months (range: 0.11 to 31.7), until September 2007. Long-term outcomes included death or death and hospital readmission for all causes.
Blood samples were collected at admission to the emergency department. For BNP determination, a specific kit for the ADVIA Centaur analyzer (Bayer Health Care Diagnostics, Tarrytown, NY) was used, with detection limit of 2 pg/mL and range from 2 to 5000 pg/mL. The intra- and inter-assay coefficients of variation ranged from 2.1 to 4.7% for concentrations between 29 and 1700 pg/mL. Echocardiographic data were collected in second day of admission and ejection fraction was obtained. We calculated the best point of BNP in receiver operating characteristic (ROC) curve equal to 300 pg/mL, the highest point of Youden's Index [10]. We selected the level of hyperglycemia above 200 mg/dL to separate the highest stratum seen in the literature [11] for admission nonfasting blood glucose. Previous use of medication were assessed.
2.3. Statistical Analysis
All data are described as rates and frequencies or means with standard deviations, as appropriate. Differences in the distribution of selected characteristics between patient groups were examined using the chi-square test and Fisher's exact test for categorical variables. The analysis was performed using the Student's t-test for normally distributed continuous variables and the Mann-Whitney and Kruskal-Wallis tests for nonparametric variables. Pearson correlation coefficients were used to study the correlations. We built an adjusted model in multivariate regression to analyze the independent variables associated with in-hospital death or combined in-hospital death and length of stay > 10 days: age, hypertension, smoking, diabetes, blood glucose < or ≥ 200 mg/dL, BNP < or ≥ 300 pg/mL, sex, and serum creatinine. The ROC curve was used to determine the area under the curve (AUC) of the C statistic. Cox regression model was used to evaluate independent prognostic factors of mortality and hospital readmission for all causes in the follow-up period. Two-sided P values < 0.05 were considered statistically significant. All statistical analyses were performed using SAS software version 9.2 for Windows. To obtain Youden's Index, AUC, sensitivity (SENS), specificity (SPEC), positive predictive value (PPV), negative predictive value (NPV), and accuracy (ACCU), we used a macro of the SAS software [12].
3. Results
3.1. Admission Blood Glucose Endpoints
Table 1 presents clinical and demographic patient characteristics, grouped by blood glucose < or ≥ 200 mg/dL. Univariate analysis showed a predominance of women (73.7% versus 23.4%; P < 0.001), lower levels of chest pain (68.4% versus 92.2%; P = 0.005), serum hemoglobin (11.8 versus 13.9 g/dL; P < 0.001), coronary angiographic study (73.7% versus 93.5%; P = 0.011), and higher levels of diabetes (94.7% versus 38.9%; P < 0.001), heart rate (102.7 versus 77.3 beats/minute; P < 0.001), BNP (660.8 versus 283.7 pg/mL; P < 0.001), white blood cell count (11,722.2 versus 9,437.3 cells/mm3; P = 0.010), platelet count (294,889.0 versus 221,118.0 cells/mm3; P < 0.001), serum urea (65.5 versus 49.5 mg/dL; P = 0.033), serum creatinine (1.81 versus 1.20 mg/dL; P = 0.016), Killip presentation ≥ 2 (47.4% versus 13.0%; P < 0.001), length of stay (22.8 versus 7.4 days; P < 0.001), in-hospital mortality (26.3% versus 2.6%; P < 0.001), and combined prolonged length of stay or death (63.2% versus 16.9%; P < 0.001) in the ≥200 mg/dL blood glucose group.
Table 1.
Clinical and demographic patient characteristics, grouped by blood glucose ≥ or < 200 mg/dL.
| All | Glucose < 200 mg/dL | Glucose ≥ 200 mg/dL | P | |
|---|---|---|---|---|
| Patients, n (%) | 96 | 77 (80.2) | 19 (19.8) | |
| Age (years)* | 65.1 (11.7) | 64.9 (12.0) | 65.7 (10.7) | 0.791 |
| Male, n (%) | 64 (66.7) | 59 (76.6) | 5 (26.3) | <0.001 |
| Prior coronary artery disease, n (%) | 57 (59.4) | 43 (55.8) | 14 (73.7) | 0.156 |
| Hypertension, n (%) | 86 (89.6) | 67 (87.0) | 19 (100) | 0.097 |
| Current smoker, n (%) | 16 (16.7) | 13 (16.7) | 3 (15.8) | 0.909 |
| Dyslipidemia, n (%) | 65 (67.7) | 53 (68.8) | 12 (63.2) | 0.636 |
| Diabetes mellitus, n (%) | 48 (50) | 30 (38.9) | 18 (94.7) | <0.001 |
| Family history of coronary artery disease, n (%) | 35 (36.5) | 29 (37.7) | 6 (31.6) | 0.622 |
| Heart rate (beats/minute) | 82.6 (27.6) | 77.3 (71.9) | 102.7 (86.4) | <0.001 |
| Systolic blood pressure (mmHg) | 137.5 (30.8) | 140.2 (29.6) | 127.8 (33.7) | 0.121 |
| Diastolic blood pressure (mmHg) | 83.1 (17.1) | 84.8 (16.6) | 76.8 (17.6) | 0.072 |
| Killip > I, n (%) | 19 (19.8) | 10 (13.0) | 9 (47.4) | <0.001 |
| Admission glucose (mg/dL) | 152.4 (100.0) | 113.1 (31.8) | 311.9 (122.8) | <0.001 |
| BNP (pg/mL) | 358.3 (381.0) | 283.7 (339.3) | 660.8 (399.4) | <0.001 |
| Hemoglobin (g/dL) | 13.5 (2.1) | 13.9 (1.9) | 11.8 (2.2) | <0.001 |
| White blood cell count (/mm3) | 9879.6 (3418.4) | 9437.3 (3181.0) | 11722.2 (3838.3) | 0.010 |
| Platelet count (/mm3) | 235244.7 (82837.8) | 221118.0 (73987.4) | 294889.0 (93436.3) | <0.001 |
| Serum urea (mg/dL) | 52.7 (29.4) | 49.5 (25.9) | 65.5 (38.6) | 0.033 |
| Serum creatinine (mg/dL) | 1.33 (1.00) | 1.20 (0.48) | 1.81 (1.98) | 0.016 |
| Creatinine kinase-MB (CKMB) peak (ng/mL) | 65.1 (111.1) | 73.2 (119.5) | 32.5 (58.7) | 0.154 |
| Troponin I (ng/mL) | 25.8 (40.6) | 26.5 (41.9) | 23.1 (35.6) | 0.741 |
| Cholesterol (mg/dL) | 175.0 (39.4) | 174.7 (39.7) | 176.4 (39.3) | 0.892 |
| HDL-C (mg/dL) | 41.0 (10.9) | 40.9 (10.9) | 41.5 (11.2) | 0.872 |
| LDL-C (mg/dL) | 110.6 (32.5) | 110.0 (32.9) | 113.4 (321.2) | 0.732 |
| Triglycerides (mg/dL) | 130.4 (76.2) | 129.2 (72.4) | 136.0 (95.9) | 0.772 |
| Ejection fraction (%) | 44.7 (15.3) | 46.4 (14.3) | 39.4 (17.4) | 0.083 |
| Angiography, n (%) | 86 (89.6) | 72 (93.5) | 14 (73.7) | 0.011 |
| Medical therapy, n (%) | 35 (36.5) | 26 (33.8) | 9 (47.4) | 0.270 |
| Percutaneous coronary intervention, n (%) | 49 (57.0) | 43 (59.7) | 6 (42.9) | 0.243 |
| Surgery, n (%) | 12 (12.5) | 8 (10.4) | 4 (21.0) | 0.208 |
| Length of stay (days) | 10.5 (18.6) | 7.4 (12.9) | 22.8 (30.2) | <0.001 |
| Followup (months) | 21.7 (9.7) | 22.5 (8.7) | 18.2 (12.8) | 0.084 |
| Mortality, n (%) | 17 (17.7) | 11 (14.3) | 6 (31.6) | 0.077 |
| In-hospital, n (%) | 7 (7.3) | 2 (2.6) | 5 (26.3) | <0.001 |
| Followup, n (%) | 10 (11.2) | 9 (12.0) | 1 (7.1) | 0.597 |
| In-hospital mortality + prolonged length of stay, n (%) | 25 (26.0) | 13 (16.9) | 12 (63.2) | <0.001 |
| Follow-up mortality + readmission, n (%) | 51 (57.3) | 43 (57.3) | 8 (57.1) | 0.989 |
3.2. BNP Endpoints
Table 2 presents clinical and demographic patient characteristics, but grouped by BNP < or ≥ 300 pg/mL. The BNP ≥ 300 pg/mL group were older (69.2 versus 62.9 years; P = 0.012) and had lower levels of chest pain (66.7% versus 98.4%; P < 0.001), systolic blood pressure (125.6 versus 144.5 mmHg; P = 0.005), diastolic blood pressure (75.2 versus 87.7 mmHg; P < 0.001), hemoglobin (12.4 versus 14.1 g/dL; P < 0.001), ejection fraction (37.9% versus 49.3%; P = 0.001), coronary angiography study (75.8% versus 96.8%; P = 0.001), and higher levels of diabetes (69.7% versus 39.7%; P = 0.005), heart rate (94.9 versus 75.6 beats/minute; P = 0.001), serum urea (67.5 versus 44.8 mg/dL; P < 0.001), serum creatinine (1.76 versus 1.11 mg/dL; P = 0.002), blood glucose (213.9 versus 120.2 mg/dL; P < 0.001), Killip presentation ≥ 2 (45.5% versus 6.3%; P < 0.001), medical therapy alone (51.5% versus 28.6%; P = 0.027), length of stay (16.4 versus 7.4 days; P = 0.022), in-hospital mortality (15.2% versus 3.2%; P = 0.032), and combined prolonged length of stay or death (48.5% versus 14.3%; P < 0.001). No difference was found in two-year mortality or readmission for all causes in BNP or hyperglycemic subgroups.
Table 2.
Clinical and demographic patient characteristics, grouped by BNP ≥ or < 300 pg/mL.
| All | BNP < 300 pg/mL | BNP ≥ 300 pg/mL | P | |
|---|---|---|---|---|
| Patients, n (%) | 96 | 63 (65.6) | 33 (34.4) | |
| Age (years)* | 65.1 (11.7) | 62.9 (11.1) | 69.2 (12.0) | 0.012 |
| Male, n (%) | 64 (66.7) | 46 (73.0) | 18 (54.5) | 0.068 |
| Prior coronary artery disease, n (%) | 57 (59.4) | 34 (54.0) | 23 (69.7) | 0.136 |
| Hypertension, n (%) | 86 (89.6) | 54 (85.7) | 32 (97.0) | 0.086 |
| Current smoker, n (%) | 16 (16.7) | 12 (19.0) | 4 (12.1) | 0.387 |
| Dyslipidemia, n (%) | 65 (67.7) | 43 (68.3) | 22 (66.7) | 0.874 |
| Diabetes mellitus, n (%) | 48 (50) | 25 (39.7) | 23 (69.7) | 0.005 |
| Family history of coronary artery disease, n (%) | 35 (36.5) | 25 (39.7) | 10 (30.3) | 0.365 |
| Heart rate (beats/minute) | 82.6 (27.6) | 75.6 (21.8) | 94.9 (32.4) | 0.001 |
| Systolic blood pressure (mmHg) | 137.5 (30.8) | 144.5 (29.7) | 125.6 (29.3) | 0.005 |
| Diastolic blood pressure (mmHg) | 83.1 (17.1) | 87.7 (16.7) | 75.2 (14.9) | <0.001 |
| Killip > I, n (%) | 19 (19.8) | 4 (6.3) | 15 (45.5) | <0.001 |
| Admission glucose (mg/dL) | 152.4 (100.0) | 120.2 (46.9) | 213.9 (139.6) | <0.001 |
| Admission glucose ≥ 200 mg/dL, n (%) | 19 (19.8) | 4 (6.3) | 15 (45.5) | <0.001 |
| BNP (pg/mL) | 358.3 (381.0) | 142.9 (87.6) | 769.6 (387.5) | <0.001 |
| Hemoglobin (g/dL) | 13.5 (2.1) | 14.1 (1.8) | 12.4 (2.2) | <0.001 |
| White blood cell count (/mm3) | 9879.6 (3418.4) | 9459.0 (3166.8) | 10681.3 (3775.9) | 0.102 |
| Platelet count (/mm3) | 235244.7 (82837.8) | 232967.0 (71510.4) | 239455.0 (101620.0) | 0.719 |
| Serum urea (mg/dL) | 52.7 (29.4) | 44.8 (19.0) | 67.5 (38.7) | <0.001 |
| Serum creatinine (mg/dL) | 1.33 (1.00) | 1.11 (0.39) | 1.76 (1.55) | 0.002 |
| Creatinine kinase-MB (CKMB) peak (ng/mL) | 65.1 (111.1) | 60.1 (99.9) | 74.7 (131.0) | 0.542 |
| Troponin I (ng/mL) | 25.8 (40.6) | 20.0 (32.7) | 36.9 (51.2) | 0.056 |
| Cholesterol (mg/dL) | 175.0 (39.4) | 180.0 (37.9) | 165.5 (41.1) | 0.122 |
| HDL-C (mg/dL) | 41.0 (10.9) | 40.9 (10.3) | 41.3 (12.1) | 0.886 |
| LDL-C (mg/dL) | 110.6 (32.5) | 114.0 (31.3) | 103.7 (34.2) | 0.190 |
| Triglycerides (mg/dL) | 130.4 (76.2) | 129.9 (65.3) | 131.1 (94.5) | 0.947 |
| Ejection fraction (%) | 44.7 (15.3) | 49.3 (14.6) | 37.9 (13.9) | 0.001 |
| Angiography, n (%) | 86 (89.6) | 61 (96.8) | 25 (75.8) | 0.001 |
| Medical therapy, n (%) | 35 (36.5) | 18 (28.6) | 17 (51.5) | 0.027 |
| Percutaneous coronary intervention, n (%) | 49 (57.0) | 38 (62.3) | 11 (44.0) | 0.119 |
| Surgery, n (%) | 12 (12.5) | 7 (11.1) | 5 (15.2) | 0.570 |
| Length of stay (days) | 10.5 (18.6) | 7.4 (14.7) | 16.4 (23.5) | 0.022 |
| Followup (months) | 21.7 (9.7) | 22.7 (8.3) | 19.7 (11.9) | 0.143 |
| Mortality, n (%) | 17 (17.7) | 8 (12.7) | 9 (27.3) | 0.076 |
| In-hospital, n (%) | 7 (7.3) | 2 (3.2) | 5 (15.2) | 0.032 |
| Followup, n (%) | 10 (11.2) | 6 (9.8) | 4 (14.3) | 0.537 |
| In-hospital mortality + prolonged length of stay, n (%) | 25 (26.0) | 9 (14.3) | 16 (48.5) | <0.001 |
| Follow-up mortality + readmission, n (%) | 51 (57.3) | 36 (59.0) | 15 (53.4) | 0.630 |
3.3. Combination of Laboratory Factors
In multivariate logistic analysis of the in-hospital period, the adjusted model showed only hyperglycemia ≥ 200 mg/dL as an independent predictor of mortality (OR = 13.036, IC 95% 2.296–74.022; P < 0.001). Hyperglycemia ≥ 200 mg/dL (OR = 4.588; IC 95% 1.348–15.610; P < 0.001) and BNP ≥ 300 pg/mL (OR = 3.366, IC 95% 1.108–10.223; P = 0.027) were independent predictors of length of stay longer than 10 days or death. Table 3 summarizes AUC, sensitivity, specificity, positive predictive value, negative predictive value, and accuracy of blood glucose and BNP for in-hospital death prediction, and Figure 1 shows ROC curve comparison of only blood glucose and BNP. Although blood glucose had been slightly better, there was no difference between admission glucose and BNP in in-hospital NSTEMI death prediction. In long-term followup, Cox regression (Figure 2) failed to show any independent predictors of mortality or combined hospital readmission for all causes or death. We analyzed the correlation between blood glucose and BNP, as shown in Table 4. There is a significant correlation between glycemia and BNP (Pearson correlation coefficient (PCC) = 0.38; P < 0.001), glycemia and hemoglobin (PCC = 0.41; P < 0.001), BNP and creatinine (PCC = 0.29; P = 0.004), and BNP and hemoglobin (PCC = 0.34; P < 0.001).
Table 3.
Comparison of BNP and blood glucose in outcome predictions. Area under the curve, sensitivity, specificity, positive predictive value, negative predictive value, and accuracy.
| Biochemical factor | Point | AUC* | Sensitivity (%) | Specificity (%) | PPV (%)* | NPV (%)* | Accuracy (%) | P † |
|---|---|---|---|---|---|---|---|---|
| In-hospital mortality | 0.411 | |||||||
| Glucose (mg/dL) | 200 | 0.819 | 71.4 | 84.3 | 26.3 | 97.4 | 83.3 | |
| BNP (pg/mL) | 300 | 0.748 | 71.4 | 68.5 | 15.2 | 96.8 | 68.7 | |
|
| ||||||||
| Combined length of stay ≥ 10 days or in-hospital mortality | 0.339 | |||||||
| Glucose (mg/dL) | 200 | 0.697 | 48.0 | 90.1 | 63.2 | 83.1 | 79.2 | |
| BNP (pg/mL) | 300 | 0.760 | 64.0 | 76.1 | 48.5 | 85.7 | 72.9 | |
|
| ||||||||
| Combined hospital readmission or mortality | 0.343 | |||||||
| Glucose (mg/dL) | 200 | 0.524 | 15.7 | 84.3 | 42.9 | 57.3 | 55.1 | |
| BNP (pg/mL) | 300 | 0.4631 | 34.2 | 70.6 | 46.4 | 59 | 55.1 | |
*AUC: area under the curve; PPV: positive predictive value; NPV: negative predictive value; †comparison AUC admission blood glucose versus BNP.
Figure 1.
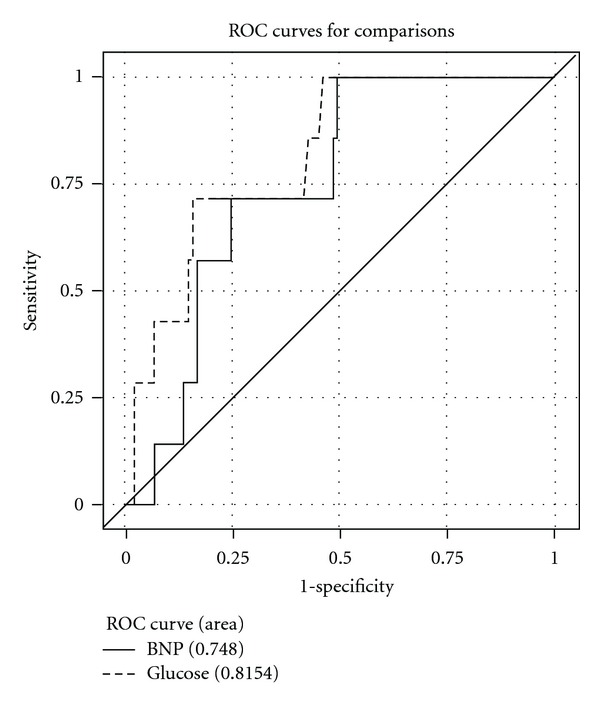
Comparison of glucose versus BNP ROC curve.
Figure 2.
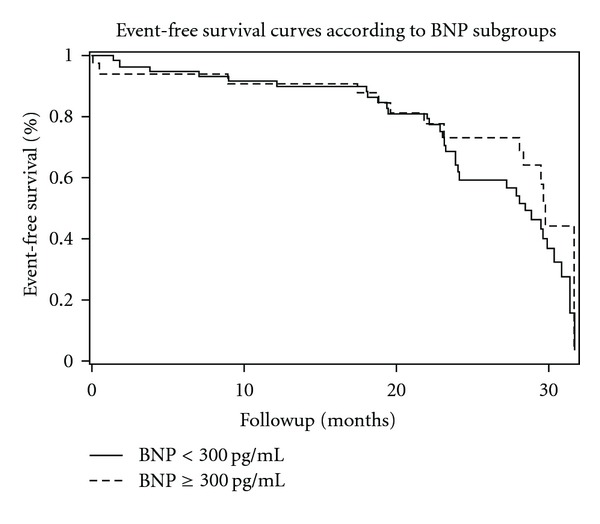
Adjusted two-year event-free survival, according to BNP < or ≥ 300 pg/mL.
Table 4.
Correlations between blood glucose, BNP, hemoglobin, and creatinine.
| Factor 1 | Factor 2 | P value | Pearson Correlation Coefficient |
|---|---|---|---|
| Glycemia | BNP | <0.001 | 0.381 |
| Glycemia | Creatinine | 0.140 | 0.153 |
| Glycemia | Hemoglobin | <0.001 | 0.413 |
| BNP | Creatinine | 0.004 | 0.292 |
| BNP | Hemoglobin | <0.001 | −0.348 |
| Hemoglobin | Creatinine | 0.008 | −0.273 |
4. Discussion
4.1. Hyperglycemia and BNP Mortality of ACS
Hyperglycemia is a factor long associated with ACS mortality [13], and its capacity for predicting a worse prognosis in NSTEMI, in our study, is at least comparable to that of BNP or better if we consider only death as the outcome. Several studies accessing BNP and admission glucose separately in ACS patients showed in-hospital and long-term prognosis around the world [14–19]. The decision to use blood glucose or BNP laboratory results instead of multifactorial models can be more useful for emergency physicians.
Admission hyperglycemia could be a biochemical marker for unfavorable ACS prognosis only reflecting inappropriate diabetes control, as another risk factor, and reflecting advanced atherosclerosis. In fact, hyperglycemic ACS patients usually have a history of diabetes and elevated HbA1C [20]. On the other hand, hyperglycemia could be a signal of adrenergic stress response [21] of a severely ill ACS patient, as observed in other acute illnesses [22]. However, some studies with cardiac magnetic resonance [23, 24] have shown that hyperglycemic or diabetic patients have greater myocardial infarct size and greater microvascular obstruction, prothrombotic state, or endothelial dysfunction [25], or in other words, hyperglycemia could be itself involved in mechanisms of impaired blood nutrition to the ischemic wall.
4.2. Marker or Risk Factor?
Hyperglycemia could itself damage coronary endothelia, but there are no convincing data supporting strategies of intensive insulin therapy to control hyperglycemia in critically ill or myocardial infarcted patients that could reverse the increased mortality, most probably due to hypoglycemic risk [26], another great mortality risk factor in the hospital setting. In this context, both blood glucose and BNP are better as prognostic markers in ACS patients. For example, elevated BNP can predict anterior wall ischemic localization at angiography in NSTEMI [27].
In our study, BNP and blood glucose were better markers of in-hospital outcomes. Admission hyperglycemia is associated with long-term risk for ACS mortality [28], but this association is not homogeneous in different ACS presentations [15], unstable angina, NSTEMI, or STEMI. Besides, mortality up to 1 year can be predicted both by admission glucose and fasting blood glucose, but the better predictor of mortality for longer periods is fasting glucose [29].
Correlations between BNP, glycemia, hemoglobin, and creatinine illustrated how measurement of one laboratory element can in fact assess other components of body homeostasis, becoming more difficult to separate a few independent mortality risk factors in adjusted complex models. These factors may be not related in a particular patient, or all factors could exist in consequence of a common combination of diseases: obesity, hypertension and diabetes leading to kidney disease, coronary disease, heart failure, anemia, elevated BNP.
In-hospital stay was defined by clinical criteria. More severe patient were related to in-hospital mortality or required more time to be discharged from hospital. Hyperglycemia and BNP are markers of this severity of illness.
4.3. ROC Curve
At a cutoff point of 200 mg/dL for blood glucose and 300 pg/dL for BNP, ROC curve analysis showed modest values of sensitivity and specificity, but a great negative predictive value for mortality. Eggers et al. [30] compared NT-pro BNP, CRP, cystatin C, and creatinine clearance to predict reinfarction or death in patients with chest pain and ACS non-STEMI. They found AUC = 0.80 in a composite of abnormal EKG, increased cardiac troponin I and NT-pro BNP, best NT-pro BNP cutoff point = 550 ng/L, sensitivity around 77%, and specificity around 20%, according to the ROC curve. Correia et al. [31] studied NSTEMI patients and found no improvement in the Grace Score prediction model of in-hospital events with addition of admission glucose to the model: AUC increased from 0.81 to 0.82.
The comparison between admission blood glucose and BNP ROC curves showed no statistical difference, but we believe that blood glucose could be more useful in risk stratification of ACS patients mainly in undeveloped countries, where cost limits the adoption of new technologies.
4.4. Study Limitations
We determined admission laboratory results as variables to be studied to evaluate risks beyond clinical scores like Grace or TIMI risk. We did not compare or add BNP and blood glucose to the models of risk prediction, but we simplified NSTEMI assessment by using unadjusted results to predict mortality or higher length of stay.
Some aspects of the study population like prevalence of previous coronary artery disease in up to three-quarters of patients could influence initial BNP or blood glucose and the in-hospital prognosis.
5. Conclusion
This study suggests that hyperglycemia is an independent risk factor of in-hospital mortality in NSTEMI and has a good ROC curve level. Although poor in-hospital predictors of unfavorable events, both hyperglycemia and BNP were independent risk factors for death or length of stay > 10 days. There was no relation between hyperglycemia or BNP with long-term events in our NSTEMI patients.
Conflict of Interests and Source of Funding
Authors declare no conflict of interests or external financial support.
References
- 1.Hetland O, Dickstein K. Cardiac markers in the early hours of acute myocardial infarction: clinical performance of creatine kinase, creatine kinase MB isoenzyme (activity and mass concentration), creatine kinase MM and MB subform ratios, myoglobin and cardiac troponin T. Scandinavian Journal of Clinical and Laboratory Investigation. 1996;56(8):701–713. doi: 10.3109/00365519609088817. [DOI] [PubMed] [Google Scholar]
- 2.Mega JL, Morrow DA, De Lemos JA, et al. B-type natriuretic peptide at presentation and prognosis in patients with ST-segment elevation myocardial infarction: an ENTIRE-TIMI-23 substudy. Journal of the American College of Cardiology. 2004;44(2):335–339. doi: 10.1016/j.jacc.2004.04.033. [DOI] [PubMed] [Google Scholar]
- 3.Beck JA, Meisinger C, Heier M, et al. Effect of blood glucose concentrations on admission in non-diabetic versus diabetic patients with first acute myocardial infarction on short- and long-term mortality (from the MONICA/KORA Augsburg Myocardial Infarction Registry) American Journal of Cardiology. 2009;104(12):1607–1612. doi: 10.1016/j.amjcard.2009.07.040. [DOI] [PubMed] [Google Scholar]
- 4.Galvani M, Ottani F, Oltrona L, et al. N-terminal pro-brain natriuretic peptide on admission has prognostic value across the whole spectrum of acute coronary syndromes. Circulation. 2004;110(2):128–134. doi: 10.1161/01.CIR.0000134480.06723.D8. [DOI] [PubMed] [Google Scholar]
- 5.Monteiro S, Monteiro P, Gonçalves F, Freitas M, Providência LA. Hyperglycaemia at admission in acute coronary syndrome patients: prognostic value in diabetics and non-diabetics. European Journal of Cardiovascular Prevention and Rehabilitation. 2010;17(2):155–159. doi: 10.1097/HJR.0b013e32832e19a3. [DOI] [PubMed] [Google Scholar]
- 6.Sewdarsen M, Vythilingum S, Jialal I, Becker PJ. Prognostic importance of admission plasma glucose in diabetic and non-diabetic patients with acute myocardial infarction. Quarterly Journal of Medicine. 1989;71(265):461–466. [PubMed] [Google Scholar]
- 7.De Lemos JA, Morrow DA, Bentley JH, et al. The prognostic value of B-type natriuretic peptide in patients with acute coronary syndromes. New England Journal of Medicine. 2001;345(14):1014–1021. doi: 10.1056/NEJMoa011053. [DOI] [PubMed] [Google Scholar]
- 8.Allen LA, O’Donnell CJ, Camargo CA, Jr., Giugliano RP, Lloyd-Jones DM. Comparison of long-term mortality across the spectrum of acute coronary syndromes. American Heart Journal. 2006;151(5):1065–1071. doi: 10.1016/j.ahj.2005.05.019. [DOI] [PubMed] [Google Scholar]
- 9.Alpert JS, Antman E, Apple F, et al. Myocardial infarction redefined—a consensus document of The Joint European Society of Cardiology/American College of Cardiology Committee f or the redefinition of myocardial infarction. Journal of the American College of Cardiology. 2000;36(3):959–969. doi: 10.1016/s0735-1097(00)00804-4. [DOI] [PubMed] [Google Scholar]
- 10.Youden WJ. Index for rating diagnostic tests. Cancer. 1950;3(1):32–35. doi: 10.1002/1097-0142(1950)3:1<32::aid-cncr2820030106>3.0.co;2-3. [DOI] [PubMed] [Google Scholar]
- 11.Cubbon RM, Rajwani A, Abbas A, et al. Hyperglycaemia, in relation to sex, and mortality after acute coronary syndrome. European Journal of Cardiovascular Prevention and Rehabilitation. 2007;14(5):666–671. doi: 10.1097/HJR.0b013e32827ab6c1. [DOI] [PubMed] [Google Scholar]
- 12.Lambert J, Lipkovich I. Tech. Rep. 231-2008. Indianapolis, Ind, USA: Eli Lilly and Company; 2008. A macro for getting more out of your ROC curve. [Google Scholar]
- 13.Modan B, Schor S, Shani M. Acute myocardial infarction. Prognostic value of white blood cell count and blood glucose level. Journal of the American Medical Association. 1975;233(3):266–267. doi: 10.1001/jama.233.3.266. [DOI] [PubMed] [Google Scholar]
- 14.De Mulder M, Cornel JH, Van Der Ploeg T, Boersma E, Umans VA. Elevated admission glucose is associated with increased long-term mortality in myocardial infarction patients, irrespective of the initially applied reperfusion strategy. American Heart Journal. 2010;160(3):412–419. doi: 10.1016/j.ahj.2010.06.047. [DOI] [PubMed] [Google Scholar]
- 15.Hoshida S, Teragaki M, Lim YJ, et al. Admission with metabolic disorder is a useful predictor of the 1-year prognosis for patients with unstable angina, but not for patients with acute myocardial infarction: East-Osaka Acute Coronary Syndrome Registry. Coronary Artery Disease. 2011;22(6):416–420. doi: 10.1097/MCA.0b013e3283472a87. [DOI] [PubMed] [Google Scholar]
- 16.Pesaro AEP, Nicolau JC, Serrano CV, Jr., et al. Influence of leukocytes and glycemia on the prognosis of patients with acute myocardial infarction. Arquivos Brasileiros de Cardiologia. 2009;92(2):84–89. doi: 10.1590/s0066-782x2009000200003. [DOI] [PubMed] [Google Scholar]
- 17.Bassan R, Tura BR, Maisel AS. B-type natriuretic peptide: a strong predictor of early and late mortality in patients with acute chest pain without ST-segment elevation in the emergency department. Coronary Artery Disease. 2009;20(2):143–149. doi: 10.1097/MCA.0b013e3283292ac6. [DOI] [PubMed] [Google Scholar]
- 18.Narain VS, Gupta N, Sethi R, et al. Clinical correlation of multiple biomarkers for risk assessment in patients with acute coronary syndrome. Indian Heart Journal. 2008;60(6):536–542. [PubMed] [Google Scholar]
- 19.Wiviott SD, De Lemos JA, Morrow DA. Pathophysiology, prognostic significance and clinical utility of B-type natriuretic peptide in acute coronary syndromes. Clinica Chimica Acta. 2004;346(2):119–128. doi: 10.1016/j.cccn.2004.04.004. [DOI] [PubMed] [Google Scholar]
- 20.Oswald GA, Corcoran S, Yudkin JS. Prevalence and risks of hyperglycaemia and undiagnosed diabetes in patients with acute myocardial infarction. The Lancet. 1984;1(8389):1264–1267. doi: 10.1016/s0140-6736(84)92447-4. [DOI] [PubMed] [Google Scholar]
- 21.Oswald GA, Smith CCT, Betteridge DJ, Yudkin JS. Determinants and importance of stress hyperglycaemia in non-diabetic patients with myocardial infarction. British Medical Journal. 1986;293(6552):917–922. doi: 10.1136/bmj.293.6552.917. [DOI] [PMC free article] [PubMed] [Google Scholar]
- 22.Falciglia M, Freyberg RW, Almenoff PL, D’Alessio DA, Render ML. Hyperglycemia-related mortality in critically ill patients varies with admission diagnosis. Critical Care Medicine. 2009;37(12):3001–3009. doi: 10.1097/CCM.0b013e3181b083f7. [DOI] [PMC free article] [PubMed] [Google Scholar]
- 23.Jensen CJ, Eberle HC, Nassenstein K, et al. Impact of hyperglycemia at admission in patients with acute ST-segment elevation myocardial infarction as assessed by contrast-enhanced MRI. Clinical Research in Cardiology. 2011;100(8):649–659. doi: 10.1007/s00392-011-0290-7. [DOI] [PubMed] [Google Scholar]
- 24.Mather AN, Crean A, Abidin N, et al. Relationship of dysglycemia to acute myocardial infarct size and cardiovascular outcome as determined by cardiovascular magnetic resonance. Journal of Cardiovascular Magnetic Resonance. 2010;12:p. 61. doi: 10.1186/1532-429X-12-61. [DOI] [PMC free article] [PubMed] [Google Scholar]
- 25.Timmer JR, Ottervanger JP, De Boer MJ, et al. Hyperglycemia is an important predictor of impaired coronary flow before reperfusion therapy in ST-segment elevation myocardial infarction. Journal of the American College of Cardiology. 2005;45(7):999–1002. doi: 10.1016/j.jacc.2004.12.050. [DOI] [PubMed] [Google Scholar]
- 26.Kansagara D, Fu R, Freeman M, Wolf F, Helfand M. Intensive insulin therapy in hospitalized patients: a systematic review. Annals of Internal Medicine. 2011;154(4):268–282. doi: 10.7326/0003-4819-154-4-201102150-00008. [DOI] [PubMed] [Google Scholar]
- 27.Ramos RB, Strunz CM, Avakian SD, Ramires JA, de Padua Mansur A. B-type natriuretic peptide as a predictor of anterior wall location in patients with non-ST-elevation myocardial infarction. Clinics. 2011;66(3):437–441. doi: 10.1590/S1807-59322011000300013. [DOI] [PMC free article] [PubMed] [Google Scholar]
- 28.Dirkali A, van der Ploeg T, Nangrahary M, Cornel JH, Umans VAWM. The impact of admission plasma glucose on long-term mortality after STEMI and NSTEMI myocardial infarction. International Journal of Cardiology. 2007;121(2):215–217. doi: 10.1016/j.ijcard.2006.08.107. [DOI] [PubMed] [Google Scholar]
- 29.Cid-Alvarez B, Gude F, Cadarso-Suarez C, et al. Admission and fasting plasma glucose for estimating risk of death of diabetic and nondiabetic patients with acute coronary syndrome: nonlinearity of hazard ratios and time-dependent comparison. American Heart Journal. 2009;158(6):989–997. doi: 10.1016/j.ahj.2009.10.004. [DOI] [PubMed] [Google Scholar]
- 30.Eggers KM, Dellborg M, Oldgren J, Swahn E, Venge P, Lindahl B. Risk prediction in chest pain patients by biochemical markers including estimates of renal function. International Journal of Cardiology. 2008;128(2):207–213. doi: 10.1016/j.ijcard.2007.04.096. [DOI] [PubMed] [Google Scholar]
- 31.Correia LCL, Rocha MS, Bittencourt AP, et al. Does acute hyperglycemia add prognostic value to the GRACE score in individuals with non-ST elevation acute coronary syndromes? Clinica Chimica Acta. 2009;410(1-2):74–78. doi: 10.1016/j.cca.2009.09.026. [DOI] [PubMed] [Google Scholar]