

Abstract
Dip listening refers to our ability to catch brief “acoustic glimpses” of speech and other sounds when fluctuating background noise levels momentarily decrease. Exploiting dips in natural fluctuations of noise contributes to our ability to overcome the “cocktail party problem” of understanding speech in multi-talker social environments. We presently know little about how nonhuman animals solve analogous communication problems. Here, we asked whether female grey treefrogs (Hyla chrysoscelis) might benefit from dip listening in selecting a mate in the noisy social setting of a breeding chorus. Consistent with a dip listening hypothesis, subjects recognized conspecific calls at lower thresholds when the dips in a chorus-like noise masker were long enough to allow glimpses of nine or more consecutive pulses. No benefits of dip listening were observed when dips were shorter and included five or fewer pulses. Recognition thresholds were higher when the noise fluctuated at a rate similar to the pulse rate of the call. In a second experiment, advertisement calls comprising six to nine pulses were necessary to elicit responses under quiet conditions. Together, these results suggest that in frogs, the benefits of dip listening are constrained by neural mechanisms underlying temporal pattern recognition. These constraints have important implications for the evolution of male signalling strategies in noisy social environments.
Keywords: cocktail party problem, dip listening, grey treefrog, Hyla chrysoscelis, masking release, acoustic communication
Humans and nonhuman animals often communicate acoustically in large social groups, such as cocktail parties, choruses, or colonies (Schwartz & Freeberg 2008). In such aggregations, high levels of background noise generated by the mixture of signals can lead to errors in communication by impairing signal detection, recognition, and discrimination (Klump 1996; Brumm & Slabbekoorn 2005). In humans, the challenge of communicating in multi-talker environments is known as the “cocktail party problem” (reviewed in: Bronkhorst 2000; McDermott 2009). Because the ability to solve cocktail-party-like communication problems has important fitness consequences for many species and in different social contexts, we should expect natural selection to favour both signalling behaviours and perceptual mechanisms that facilitate signal recognition in noisy social aggregations (Klump 1996; Brumm & Slabbekoorn 2005; Langemann & Klump 2005; Bee & Micheyl 2008). Compared to our thorough understanding of strategies signallers use to avoid or ameliorate noise problems (reviewed in: Brumm & Slabbekoorn 2005), we know considerably less about how non-human receivers may be adapted to cope with the detrimental effects of noise (Klump 1996; Hulse 2002; Bee & Micheyl 2008).
One way humans and other animals may solve cocktail-party-like problems is by exploiting temporal features of the ambient acoustic environment. A prominent feature of natural soundscapes, including those generated by social aggregations, is that noise levels fluctuate in time (Richards & Wiley 1980; Nelken et al. 1999; Vélez & Bee 2010). Humans can recognize speech at significantly lower thresholds when “speech-shaped noise” (i.e., noise with the long-term spectrum of speech) fluctuates in amplitude compared with thresholds determined in a control treatment with non-fluctuating noise (Gustafsson & Arlinger 1994; Bacon et al. 1998). This release from auditory masking in fluctuating noise is termed “dip listening” and is attributed to the listener’s ability to catch brief “acoustic glimpses” of speech cues at those moments when the background noise dips to a low level (Cooke 2006; Vestergaard et al. 2011). Masking release by means of dip listening is generally greater when noise fluctuates at slower, compared with faster, rates (Gustafsson & Arlinger 1994; Bacon et al. 1998). At slower rates, dips in noise levels are usually longer, thereby increasing the probability of catching meaningful glimpses of target speech (Gustafsson & Arlinger 1994; Bacon et al. 1998). Our objective in this study was to examine the extent to which dip listening might benefit receivers in a well-described nonhuman communication system.
Anuran amphibians (frogs and toads) represent ideal models for studying sensory mechanisms that facilitate signal recognition in noisy social environments (reviewed in Vélez et al. in press). In most species, males produce loud sexual advertisement calls that are necessary and sufficient for species recognition and female mate choice (Gerhardt & Huber 2002). In many species, males aggregate in suitable breeding habitats and form dense choruses, which in some cases can be heard from up to 2 km away (Arak 1983). Not surprisingly, the intense noise levels in breeding choruses are a particularly potent source of auditory masking that impairs signal detection, recognition, and discrimination by receivers (Gerhardt & Klump 1988a; Wollerman 1999; Wollerman & Wiley 2002; Bee 2007a, 2008a, 2008b; Bee & Schwartz 2009; Vélez & Bee 2010; Vélez et al. in press). Like the background noise at a cocktail party, the level of noise in frog choruses is not constant, but rather exhibits short-term, moment-to-moment fluctuations through time (Vélez & Bee 2010). Could frogs, like humans, exploit amplitude fluctuations in background noise to facilitate communication in noisy social settings?
Here, we tested the hypothesis that females of Cope’s grey treefrog (Hyla chrysoscelis) experience a release from auditory masking by listening in the dips of fluctuating chorus noise for the calls of potential mates. We experimentally measured “signal recognition thresholds” (Bee & Schwartz 2009) in the presence of a chorus-like noise without level fluctuations and in spectrally matched noises in which the level fluctuated over time. In a second experiment, we assessed whether any observable effects of dip listening might be explained by the duration of acoustic glimpses of calls occurring in the dips. Together, results from this study indicate that frogs can exploit dips in chorus noise in ways that parallel our own ability to exploit dips in the background noise of multi-talker social environments.
GENERAL METHODS
Subjects
Protocols for collecting, handling, and testing animals were approved by the University of Minnesota’s Institutional Animal Care and Use Committee (No. 0809A46721, November 2008). We collected a total of 287 females in amplexus between 2100 and 0100 hours in May and June of 2009 and 2010 from wetlands located in east-central Minnesota, U.S.A. (Carver County, 44° 52′ 49.29″ N, 93° 43′ 3.10″ W; Hennepin County, 45° 11′ 18.71″ N, 93° 39′ 9.05). Females were returned to the lab and kept at 2°C to delay oviposition until tested (usually within 24 h). We placed females in a 20°C incubator for at least 30 min prior to testing to allow their body temperature to reach 20°C ± 1°C. We released females at their capture location after testing (usually within two days).
Phonotaxis experiments
We conducted “no-choice” phonotaxis experiments (Gerhardt 1995) under infrared (IR) illumination inside a walk-in, temperature-controlled (20°C ± 1°C), hemi-anechoic sound chamber (additional details in Bee & Schwartz 2009). Females were tested in a circular arena (2 m diameter) made of acoustically transparent but visually opaque walls (60 cm height). Behavioural responses were recorded using an IR-sensitive video camera mounted directly above the test arena and viewed on a monitor and scored by two observers in real-time outside the sound chamber. The perimeter of the arena was divided into 24 15° arcs.
All acoustic stimuli were digitally generated using Matlab v7.6 (11.025 kHz, 16-bit). Target signals were broadcast from an A/D/S L210 speaker placed on the floor just outside the wall of the arena, centred in one of the 15° arcs, 1 m away from a release point at the centre of the arena. We varied the position of the speaker around the arena’s perimeter between tests of two to four females to eliminate any possibility of directional response bias. No such biases have been observed in our experimental setup. In experiment 1, masking noises were broadcast from an overhead speaker (Kenwood KFC-1680ie) suspended from the ceiling of the chamber 190 cm above the central release point. Noise levels were uniform (±2 dB) across the floor of the arena and the frequency response of the playback system was flat (±3 dB) between 500 Hz and 4000 Hz. Sound levels were measured and calibrated by placing the microphone of a Brüel and Kjær Type 2250 sound level meter at the approximate position of a subject’s head at the release point.
At the beginning of each test, a subject was placed in an acoustically transparent holding cage located at the arena’s central release point. Subjects were initially placed with random orientation relative to speaker positions and could freely re-orient inside the cage. Broadcasts of the target signal initiated after a 1.5-min silent acclimation period. After 15 s of signal presentation, subjects were released using a rope and pulley system operated from outside the chamber. In tests with masking noise in experiment 1, we started broadcasts of the masker 30 s before the onset of the target signal; the masker was broadcast continuously throughout the remainder of the test. Subjects were tested in series of 6–11 phonotaxis trials and were given a timeout period of 5 to 15 minutes inside the incubator between tests. Female grey treefrogs do not show directional biases or carry-over effects in repeated tests (Gerhardt et al. 2000).
EXPERIMENT 1: SIGNAL RECOGNITION IN FLUCTUATING NOISES
In experiment 1, we tested the hypothesis that females listen in the dips of temporally fluctuating background noise. We compared signal recognition thresholds in response to a target signal presented in the presence of a non-fluctuating (control) masker and maskers differing in rates of temporal fluctuation. Based on the dip listening hypothesis, we predicted that (i) subjects would experience masking release in fluctuating noise, as evidenced by relatively lower signal recognition thresholds in the presence of fluctuating maskers compared with the non-fluctuating (control) masker, and (ii) the magnitude of masking release would be greater in the presence of maskers that fluctuated at slower compared with faster rates.
Methods
Acoustic stimuli
The target signal was a synthetic advertisement call with spectral and temporal properties close to the average of calls recorded in local populations (Figure 1a, b). The call had 32 pulses (11 ms pulse duration) delivered at a rate of 45.5 pulses s−1 (22 ms pulse period), and repeated with a period of 5 s during a phonotaxis trial. Each pulse consisted of two phase-locked sinusoids with frequencies (and relative amplitudes) of 1.25 kHz (−9dB) and 2.5 kHz (0dB). The amplitude envelope of each pulse was shaped with a 4 ms inverse exponential rise time and a 7 ms exponential fall time.
Figure 1.
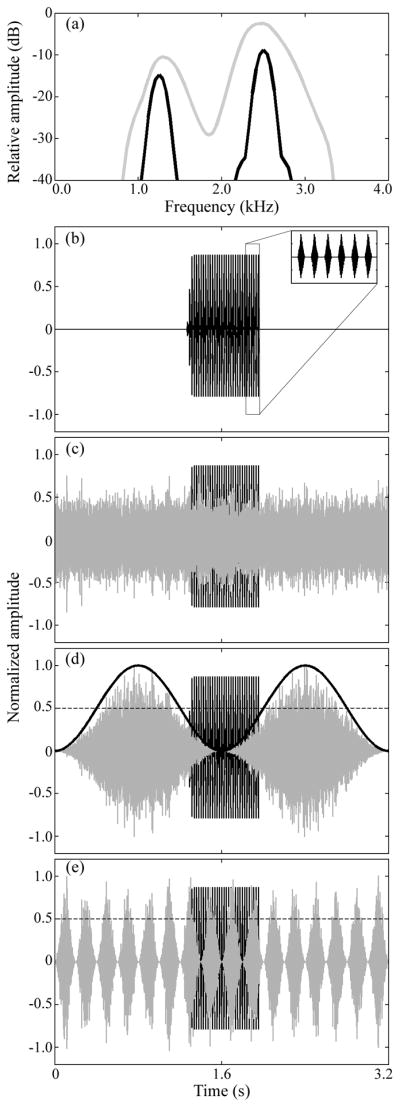
(a) Frequency spectrum of the target signal (black line) and the chorus-shaped maskers (gray line) calculated with 256-point Blackmann-Harris windows. Waveforms of 3.2-s segments of the target signal alone (b), and in the presence of maskers representing the non-fluctuating control treatment (c), or experimental treatments with maskers that fluctuated with sinusoidal modulation at rates of 0.625 Hz (d) and 5 Hz (e). Inset in (b) shows six pulses of the target signal. The solid black line in (d) depicts the sine wave used to modulate the masker. The dashed lines in (d) and (e) serve to illustrate the values at which the amplitude of the fluctuating maskers reaches 50% of the maximum amplitude; this line marks the 6-dB down-points used to measure the maximum number of consecutive pulses falling within dips of fluctuating maskers.
The maskers consisted of artificial “chorus-shaped noises” created by filtering white noise so that it had the long-term frequency spectrum of the sound of natural Cope’s grey treefrog breeding choruses (Figure 1a). Between May and July, 2007 – 2010, we recorded 25 different grey treefrog choruses using a Marantz PMD 670 digital recorder and a Sennheiser ME62 microphone. We made recordings (44.1 kHz sampling rate, 16-bit resolution) of at least 1.5 min duration near the nightly peak of calling activity, at distances between 4 m and 10 m from the nearest calling male, and at a height of 5 cm above ground or water level. These distances and microphone height were chosen because females at our field sites likely assess males from such positions. We only used recordings of choruses in which other frog species were not heard calling.
For experiment 1, we selected 14 1.5-min recordings made between 2007 and 2009 as models for creating chorus-shaped maskers for use in phonotaxis experiments conducted in 2009 and 2010. Each recording was first down-sampled to 11.025 kHz and transformed to the spectral domain before determining its power spectrum (FFT size = 4194304). We then calculated the average spectrum of the 14 recordings. To create a chorus-shaped noise, we generated a 6-min white noise, transformed it to the spectral domain (FFT size = 4194304), and multiplied it by the average frequency spectrum determined from the 14 natural choruses. We then band-pass filtered the resulting frequency spectrum between 850 and 3300 Hz (Figure 1a) and transformed it to the temporal domain with an inverse FFT (Figure 1c).
Across nine different treatments, chorus-shaped maskers differed in their temporal structure but had equivalent long-term root-mean-square (RMS) amplitudes (Figure 1c–e). In the non-fluctuating control treatment (Figure 1c), the masker had no fluctuations beyond the inherent random fluctuations characteristic of band-limited noise, which were present in all of our chorus-shaped maskers (cf. Figures 1c and 1d–e). The remaining treatments comprised eight experimental treatments in which we imposed sinusoidal fluctuations in masker level at rates of 0.625 Hz (Figure 1d), 1.25 Hz, 2.5 Hz, 5 Hz (Figure 1e), 10 Hz, 20 Hz, 40 Hz, and 80 Hz. These sinusoidally amplitude modulated (SAM) maskers were created by multiplying the non-fluctuating masker by a modulating sine wave according to the following equation:
where n(t) is the resulting SAM masker, A is a scaling factor, m is the modulation depth (1.0 in all cases), fm is the modulation frequency (from 0.625 Hz to 80 Hz in one-octave steps), ρ is the starting phase of the modulator, c(t) is the non-fluctuating chorus-shaped masker, and t is time in seconds (Figure 1d, e). The duration of each “dip” in these maskers, as measured between the 6-dB down points (Figure 1d–e), were 800 ms, 400 ms, 200 ms, 100 ms, 50 ms, 25 ms, 12.5 ms, and 6.25 ms, respectively. Consequently, the maximum number of consecutive pulses in the 32-pulse target signal that could fit within these dips decreased from 32 pulses to one pulse as the fluctuation rate increased from 0.625 Hz to 80 Hz (Figure 2a). The rates of fluctuation in our maskers spanned the range present in the sounds of grey treefrog choruses (Vélez & Bee 2010) and encompassed the pulse repetition rate of the advertisement call (≈ 40–50 pulses s−1). In playback tests, the equivalent long-term RMS amplitude of all maskers was set to a sound pressure level (SPL re. 20 μPa) of 73 dB (LCeq). This level falls within the range of chorus noise levels measured in the field (Schwartz et al. 2001; Swanson et al. 2007).
Figure 2.

(a) Maximum number of consecutive pulses falling in the dips of fluctuating maskers of experiment 1 as a function of masker fluctuation rate. A pulse was considered as falling in a dip when its maximum amplitude fell between the 6-dB down points of the masker. Maximum values were calculated from 256 calls for each masking condition (64 calls per exemplar, which corresponds to the total number of calls presented in five minutes during the broadcast of a masker in a phonotaxis test). (b) Mean (±95% confidence intervals) threshold differences as a function of masker fluctuation rate in experiment 1; these differences are relative to the threshold measured in the control condition with a non-fluctuating masker and the dashed line in (b) represents no-difference (i.e., 0 dB) from the control. As depicted by the arrows, values lower than 0 represent less masking than in the non-fluctuating control, and values greater than 0 represent more masking. (c) Proportion of subjects responding to the target signal as a function of the average number of pulses in the signal in experiment 2. In experiment 2, signals were broadcast in the absence of background noise, and the numbers of pulses were chosen to match the number of consecutive pulses falling in dips of fluctuating maskers of experiment 1. The dashed line in (c) represents the null expectation of 0.2. Asterisks in (b) and (c) represent statistically significant differences from null expectations (α=0.05).
We used artificial SAM maskers in this experiment because they are commonly used in psychophysical and neurophysiological studies of temporal auditory processing (Joris 2004), they offer a high level of experimental control, and because the sounds of natural choruses can act as an attractive signal (e.g., Swanson et al. 2007) and thereby potentially confound the results of call recognition experiments (see experiment 3 below). We used four exemplars of each masker generated with a different white noise; for SAM maskers, each exemplar was created using a sinusoidal modulator with a different starting phase (ρ = 0°, 90°, 180°, or 270°) because, depending on the phase of the masker and the timing of the target signal, starting phase could have affected the number of pulses of the signal falling within dips during a phonotaxis trial. In this experiment, however, the number of pulses that fell in dips was the same in all exemplars. We tested equal numbers of subjects with each exemplar and treated starting phase as a between-subjects factor in our statistical analyses. Subjects were assigned randomly to each combination of starting phase and masker type.
Signal recognition thresholds
We used a between-subjects design (N=24 per treatment) to measure signal recognition thresholds in response to a target signal presented in the control treatment and eight experimental treatments (total N=216). Following Bee and Schwartz (2009), we operationally defined the signal recognition threshold as the lowest signal-to-noise ratio eliciting a positive phonotaxis response. We scored a response when (i) the subject’s first contact with the arena wall was in the hemi-circle of the arena containing the target speaker, (ii) the subject touched the wall inside the 15° bin in front of the target speaker within 5 min of being released, and (iii) it remained in a 30° bin centred on the speaker for 30 s. We would note that signal recognition thresholds are not the same as signal detection thresholds because positive phonotaxis indicates that the subject (i) has detected the signal, (ii) can localize it, and (iii) recognizes it as the call of an appropriate mate.
We determined signal recognition thresholds using an adaptive tracking procedure in which we tested subjects in a series of “reference trials” and “test trials” (Bee & Schwartz 2009). Each series began and ended with a reference trial in which we broadcast the target signal in the absence of noise at a level of 85 dB SPL (fast RMS, C-weighted), which corresponds to natural call amplitudes measured at 1 m (Gerhardt 1975). Reference trials elicit robust phonotaxis from motivated females. We also tested subjects on a reference trial after any two successive test trials failed to elicit a response to ensure that the subject was indeed still responsive. As in previous studies (Bush et al. 2002; Bee & Schwartz 2009; Vélez & Bee 2010), we replaced any subject that failed to respond on any reference trial (N = 11). This procedure ensured that subjects remained highly motivated to respond across trials, as evidenced by similar mean response latencies in the initial (X̄ ± SD = 111.58 ± 39.89 s) and final (X̄ ± SD = 110.54 ± 38.80 s) reference trials (paired-sample t test: t0.05 (2), 215 = 0.2179, P > 0.6).
In the first test trial in a series, we broadcast the target signal and the masking noise at a signal-to-noise ratio of 0 dB, that is, the signal was also calibrated to 73 dB SPL (LCF). In subsequent trials, we kept the level of the masker constant at 73 dB SPL (LCeq) and systematically varied the level of the target signal contingent upon the subject’s behaviour in the previous test. If the subject responded in the previous trial, the level of the signal was decreased by 3 dB in the next trial. If the subject failed to respond, the level of the target signal was instead increased by 3 dB in the next trial. This pattern continued until the subject changed its behaviour between two consecutive test trials (i.e. from response to no response, or vice versa). On the subsequent test trial following a change in behaviour, we reversed the direction of signal level change and reduced the step size to 1.5 dB. A subject’s recognition threshold was calculated as the average between the minimum signal level that elicited a response and the maximum signal level that failed to elicit a response (Bee & Schwartz 2009). Recognition thresholds were calculated in a linear scale and converted back to dB.
Release from auditory masking is typically calculated as the relative difference (in dB) between thresholds measured in two or more conditions. To examine the magnitude of any masking release due to dip listening, we subtracted the average threshold measured for subjects in the non-fluctuating control treatment (X̄ ± SE = 67.9 ± 0.8 dB; N = 24) from those of each subject tested in the eight experimental treatments with fluctuating maskers. We predicted that these “threshold differences” would be significantly lower than 0 dB if subjects experienced masking release in the presence of a fluctuating masker (i.e., negative threshold differences indicate masking release). We tested this prediction using two-tailed t-tests assessing differences from zero. We analysed threshold differences using a two-way analysis of variance (ANOVA) to investigate the influence of differences in masker fluctuation rates (8 levels) and masker starting phase (4 levels). Threshold differences met the assumptions of normality (Kolmogorov-Smirnov tests Ps > 0.20) and homogeneity of variance (Levene’s tests Ps > 0.24) for parametric testing. We used an experiment-wide significance criterion of α = 0.05.
Results and Discussion
Average recognition thresholds measured in the presence of fluctuating noise ranged from about 4 dB lower to 6 dB higher than the non-fluctuating control (Figure 2b), and the magnitude of these threshold differences depended on the masker’s fluctuation rate (ANOVA: F7,160 = 15.03, P < 0.0001, Partial η2 =0.396). Consistent with the dip listening hypothesis, subjects experienced a release from masking of about 2–4 dB, on average (Figure 2b), relative to the control treatment when the maskers fluctuated at rates of 0.625 Hz (t0.05 (2), 23 = −2.22, P = 0.036), 1.25 Hz (t0.05 (2), 23 = −4.08, P < 0.001), and 2.5 Hz (t0.05 (2), 23 = −3.98, P < 0.001). Mean threshold differences were not significantly different from 0 dB when masker fluctuation rates were 5 Hz (t0.05 (2), 23 = −0.58, P = 0.571), 10 Hz (t0.05 (2), 23 = 0.59, P = 0.556), and 20 Hz (t0.05 (2), 23 = 1.52, P = 0.142). In contrast to the dip listening hypothesis, threshold differences were significantly greater than 0 dB and averaged about 4–6 dB higher than in the control treatment when the masker fluctuated at 40 Hz (t0.05 (2), 23 = 7.31, P < 0.001) and 80 Hz (t0.05 (2), 23 = 3.67, P < 0.002).
We found no significant main effect of the fluctuating masker’s starting phase on threshold differences (ANOVA: F3,160 = 2.06, P = 0.107, Partial η2 =0.04); there was a weak but significant interaction between a masker’s fluctuation rate and its starting phase (ANOVA: F21,160 = 1.63, P = 0.047, Partial η2 =0.18). Responses elicited using one exemplar (270° starting phase) were relatively constant across the different masker fluctuation rates, whereas responses with the other three exemplars exhibited the general pattern depicted in figure 2b. This interaction cannot be explained by differences in the maximum number of consecutive pulses falling within dips, which was invariant across all four starting phases. We currently lack a suitable explanation for this interaction.
EXPERIMENT 2: MINIMUM CALL DURATION FOR ACOUSTIC GLIMPSES
The basic idea behind the dip listening hypothesis is that listeners are able to catch brief glimpses of target signals during dips in ambient noise levels. The results of experiment 1 suggested dip listening occurred at the slowest fluctuation rates tested (≤ 2.5 Hz), which were associated with the longest dips (≥ 200 ms at the 6-dB down points). In experiment 2 we asked, what is the shortest glimpse of an advertisement call that a female grey treefrog could hear in the absence of noise and still recognize as the call of an appropriate mate? Answering this question was necessary to interpret results from experiment 1. To this question, we used no-choice phonotaxis experiments to estimate the “minimum effective call duration,” which we operationally defined as the minimum number of pulses in a target signal required to elicit positive phonotaxis.
Methods
The target signals used in this experiment were identical to those of experiment 1 in all respects except pulse number. Here, we varied pulse number across five different treatments so that the target signal had on average either 2.25, 4.5, 9, 18 or 36 pulses. These pulse numbers were chosen because they are close to the maximum number of consecutive pulses that fit between the 6-dB down points of the five maskers with the longest dips used in experiment 1 (i.e., 0.625 Hz to 10 Hz). For the 2.25 pulses treatment, one 3-pulse signal was broadcast after every third 2-pulse signal; for the 4.5 pulses treatment, every other signal had either 4 or 5 pulses. Signals were broadcast at 70 dB SPL (LCF), which is close to the minimum amplitude necessary to elicit phonotaxis in the presence of a chorus-shaped masker presented at 73 dB SPL (Bee & Schwartz 2009; Vélez & Bee 2010; experiment 1 of this study). During a phonotaxis trial, the signal repeated with a period of 5 s for all treatments.
Using a within-subjects design, we tested females (N = 20) in all five treatments (in a different randomized order for each subject) and calculated the proportion of subjects that responded. We scored a response if (i) the subject’s first contact with the arena wall was in the hemi-circle containing the target speaker and (ii) the subject touched the wall inside the 15° bin in front of the target speaker within 5 min of being released. We reasoned that if females recognized the signal as a conspecific mating call, they should exhibit positive phonotaxis. We tested this prediction using one-tailed binomial tests and an expected (null) false alarm rate of 0.2. This false alarm rate was determined from data obtained in a previous study (Vélez & Bee 2010). In that study, which used only the second of the two response criteria used here, we determined that the proportion of females that touched the wall of the arena in front of a silent, target speaker was 0.20 in the absence of any acoustic stimulation. For purposes of the present study, we reanalyzed those data using both of our response criteria and found that the false alarm rate remained 0.20 using both criteria.
Results and Discussion
The proportion of females that met the response criteria (Figure 2c) was significantly greater than the null expectation of 0.20 for calls containing nine or more pulses (one-tail binomial tests: Ps ≤ 0.01), but not five or fewer pulses (Ps > 0.19). These results indicate that in the absence of noise, the minimum effective call duration was between six and nine pulses. Given the gross-temporal properties of our target stimuli, this corresponds to a minimum acoustic glimpse of about 120–190 ms in duration, which is less than the duration of the dips in the fluctuating noises for which masking release was observed in experiment 1 (≤ 2.5 Hz). In other words, the dips in the slowest fluctuating maskers used in experiment 1 were sufficiently long to allow females to catch glimpses of calls that exceeded the minimum effective call duration for eliciting positive phonotaxis in experiment 2.
EXPERIMENT 3: CHORUS-SHAPED MASKERS AS POTENTIAL SIGNALS
Experiment 1 revealed significant differences in signal recognition thresholds depending on the presence/absence and rates of fluctuation in chorus-shaped noise maskers. There was a potential confound in this experiment, however, related to the observation that the “noise” of natural breeding choruses can act as acoustic “signals” that allow males and females of some frog species, including our study species, to locate breeding aggregations (Gerhardt & Klump 1988b; Bee 2007b; Swanson et al. 2007; Christie et al. 2010). Therefore, estimates of signal recognition thresholds in the presence of simulated chorus noise could potentially be confounded if the maskers by themselves were not behaviourally neutral stimuli. One way in which such confounds could be introduced would be if subjects were attracted to (or repelled by) some chorus-shaped maskers but not others. In experiment 3, we tested the null hypothesis that non-fluctuating and SAM chorus-shaped maskers, when used as potential target signals, fail to elicit positive or negative phonotaxis.
Methods
In this experiment, there were nine noise stimuli, each of which corresponded to one of the chorus-shaped maskers used in experiment 1 (i.e. the non-fluctuating control and the eight SAM maskers). Females were tested in a series of no-choice phonotaxis trials that began and ended with a reference trial in which we broadcast our attractive, 32-pulse target signal in the absence of noise at a level of 85 dB SPL (fast RMS, C-weighted). In each test trial, a noise stimulus (i.e., a chorus-shaped masker from experiment 1) was broadcast continuously from a speaker on the floor of the sound chamber, just outside the wall of the test arena, similar to broadcasts of target signals in experiments 1 and 2. We tested eight of the nine noise stimuli (non-fluctuating noise and 1.25 Hz through 80 Hz SAM noise) using a within-subjects design (N = 20) in which females were tested with all eight stimuli in randomized orders. A second group of females (N = 20) was tested using the 0.625 Hz SAM noise as a stimulus. The long-term RMS amplitude of all noise stimuli was calibrated to 73 dB SPL (LCeq) at the central release point of the test arena. As an additional comparison group (N = 20), we re-analysed data from a “no-noise” treatment conducted in a previous study of ours (Vélez & Bee 2010) that used the same experimental setup to measure female behaviour in our test arena in the absence of any acoustic stimulation.
As a response variable, we measured orientation angles corresponding to the angle (measured in 5° bins) at which subjects first touched the wall of the arena relative to the location of the playback speaker (designated as 0°). Following previous studies (Swanson et al. 2007; Vélez & Bee 2010), test trials ended as soon as subjects touched the arena wall or after 5 min of stimulus presentation. We employed circular statistics to investigate the effect of the different noise stimuli on orientation angles. We did not use Bonferroni corrections for multiple comparisons in these analyses because doing so would make it more difficult to detect whether the noise stimuli affected female phonotaxis behaviour in this control experiment.
Results and Discussion
In the reference trials, subjects were strongly oriented toward the target signal, as evidenced by mean angles (μ) close to 0°, small circular standard deviations (≤ 5°), and lengths of mean vectors (r) close to 1.0 (Table 1). In contrast, there was little evidence that subjects oriented toward the noise stimuli during the test trials, with lengths of mean vectors below 0.4 and circular standard deviations above 78° (Table 1). We statistically assessed these patterns in three separate analyses. First, we tested the null hypothesis that orientation angles measured in the reference trials and in response to each noise stimulus in the test trials were uniformly distributed using one-sample Watson’s U2 tests. Our reasoning was that, if subjects were attracted to or repelled by a noise stimulus in the test trials, orientation angles would not be uniformly distributed, and instead would be directed, respectively, toward or away from the stimulus. As illustrated in Table 1 (column headed “One-sample Watson’s U tests”), significant directionality was found only in responses to the target signals in the reference trials and not in responses to the noise stimuli on the test trials. Thus, females were not oriented toward or away from the speaker when they first touched the arena wall.
TABLE 1.
Results of circular statistical analyses for orientation angles at the wall for the reference and test trials. N represents the number of subjects that touched the wall of the arena in each type of condition; the total number of subjects tested per condition was 20.
| Condition | Angle at wall | One-sample Watson’s U2 test | Two-sample Watson’s U2 test (rel. No-noise) | Two-sample Watson’s U2 test (rel. Reference 1) | ||||||
|---|---|---|---|---|---|---|---|---|---|---|
| Mean Vector (μ°) | Length of Mean Vector (r) | Circular SD (°) | N | Watson’s U2 | P | Watson’s U2 | P | Watson’s U2 | P | |
| No Noise * | 136 | 0.08 | 129 | 17 | 0.03 | p>0.5 | 0.78 | p<0.001 | ||
| Reference 1 | 359 | 0.99 | 5 | 20 | 1.56 | p<0.01 | 0.78 | p<0.001 | ||
| Reference 2 | 0 | 0.99 | 3 | 20 | 1.67 | p<0.01 | 0.97 | p<0.001 | 0.01 | p>0.5 |
| Non-fluctuating | 65 | 0.20 | 102 | 16 | 0.05 | p>0.5 | 0.03 | p>0.5 | 0.83 | p<0.001 |
| 0.625-Hz SAM | 49 | 0.35 | 83 | 14 | 0.12 | 0.15<p<0.25 | 0.09 | 0.2<p<0.5 | 0.48 | p<0.001 |
| 1.25-Hz SAM | 261 | 0.16 | 110 | 16 | 0.05 | p>0.5 | 0.04 | p>0.5 | 0.85 | p<0.001 |
| 2.5-Hz SAM | 326 | 0.39 | 78 | 16 | 0.16 | 0.05<p<0.1 | 0.11 | 0.2<p<0.5 | 0.70 | p<0.001 |
| 5-Hz SAM | 28 | 0.25 | 96 | 18 | 0.08 | 0.25<p<0. 5 | 0.06 | p>0.5 | 0.71 | p<0.001 |
| 10-Hz SAM | 35 | 0.25 | 96 | 15 | 0.08 | 0.25<p<0. 5 | 0.07 | 0.2<p<0.5 | 0.74 | p<0.001 |
| 20-Hz SAM | 31 | 0.24 | 97 | 16 | 0.07 | 0.5<p<0.9 | 0.05 | p>0.5 | 0.64 | p<0.001 |
| 40-Hz SAM | 48 | 0.15 | 111 | 16 | 0.09 | 0.1<p<0.5 | 0.06 | p>0.5 | 0.84 | p<0.001 |
| 80-Hz SAM | 61 | 0.29 | 90 | 17 | 0.09 | 0.5<p<0.9 | 0.05 | p>0.5 | 0.68 | p<0.001 |
Data reanalyzed from Vélez & Bee (2010).
In a second analysis, we used two-sample Watson’s U2 tests to determine whether the distributions of orientation angles measured in response to the target signals in reference trials and noise stimuli in test trials differed from an actual null distribution obtained from a separate “no-noise” treatment in which no sound was broadcast (Vélez & Bee 2010). We reasoned that if the noise stimuli affected female behaviour in the arena, then this might be reflected in a difference between the distributions of orientation angles measured in the presence and absence of the noises. As illustrated in Table 1 (column headed “Two-sample Watson’s U2 tests (rel. No-noise)”), responses during the reference trials differed significantly from the no-noise treatment, but those measured in response to the noise stimuli did not. Hence, female orientation in the presence of the noise stimuli was not different from a quiet condition lacking the noise stimuli.
Finally, we assessed whether females treated the noise stimuli as attractive target signals. We tested the null hypothesis that the distribution of orientation angles toward the noise stimuli was not different from that observed in the reference trials using two-sample Watson’s U2 tests. Importantly, the two-sample Watson’s U2 test assumes independent samples. Our dataset allowed us to meet this assumption in the following way. We used responses on the first reference trial from the 20 subjects tested only with the 0.625 Hz noise stimulus for making comparisons with responses to the eight noise stimuli made by the other group of 20 subjects. Likewise, responses of this second group of 20 subjects on their first reference trial served for making comparisons with responses to the 0.625 Hz noise stimulus by the first group of 20 subjects. As reported in Table 1 (column headed “Two-sample Watson’s U2 tests (rel. Reference 1)”), the distributions of orientation angles in response to the noise stimuli and the no-noise condition of Vélez & Bee (2010) were significantly different than those measured in response to an attractive target signal in the first reference trial. Responses in the two reference trials were not different (Table 1). Together, results from these three analyses confirm that the maskers used in experiment 1 were, by themselves, behaviourally neutral stimuli.
GENERAL DISCUSSION
Dip listening or modulation masking?
Consistent with the dip listening hypothesis, female grey treefrogs experienced about 2–4 dB release from masking when a chorus-like noise fluctuated at slow rates (≤ 2.5 Hz), at which the dips were relatively long (≥ 200 ms). We believe this masking release can be explained, in part, by the number of consecutive pulses that fell in the dips of the fluctuating maskers. At fluctuation rates of 2.5 Hz and slower, the maximum number of consecutive pulses that fell in the dips was nine or more pulses; at the faster rates we tested (≥ 5 Hz), five or fewer consecutive pulses were able to fit in a dip (Figure 2a). These results are in line with those of our second experiment, in which we found that calls with five or fewer pulses failed to elicit responses, whereas calls with nine or more pulses reliably elicited positive phonotaxis. Together, these results are consistent with the hypothesis that females experienced masking release by catching short but meaningful acoustic glimpses of advertisement calls as a result of listening in the dips of fluctuating chorus-like noise. While the benefits of dip listening reported here are small (2–4 dB), they are large enough to be biologically important. In previous two-choice discrimination experiments, females of Cope’s grey treefrog (H. chrysosceslis) and the closely related eastern grey treefrog (H. versicolor) strongly preferred mating calls broadcast at higher sound levels in both the presence or absence of chorus-like noise, even when the difference between two alternatives was as small as 2–4 dB (Fellers 1979; Bee et al. in review; see also Gerhardt et al. 2000). In addition, differences in signal amplitude on the order of 2–4 dB can eliminate or reverse female preferences for certain call properties (Gerhardt et al. 2000). Hence, a 2–4 dB masking release due to dip listening could be quite important for a female grey treefrog listening to potential mates in the din of a breeding chorus.
Not all of our results, however, were consistent with the dip listening hypothesis. We found that females actually experienced additional masking when the background noise fluctuated at some of the faster rates we tested (> 20 Hz). This additional masking was most pronounced (≈ 6 dB) when the masker’s fluctuation rate (40 Hz) was most similar to the pulse rate of the target signal (45.5 pulses s−1) (Figure 2b). Females of H. chrysoscelis use pulse rate as an acoustic property for species recognition (Schul & Bush 2002). Previous studies of call interference have shown that overlapping calls can disrupt a female’s perception of pulse rate (Marshall et al. 2006; Schwartz & Marshall 2006). We attribute these results to a phenomenon known from the human hearing literature as “modulation masking” (Bacon & Grantham 1989; Kwon & Turner 2001). Used to describe the increased difficulty we have perceiving amplitude-modulated signals in the presence of amplitude-modulated noise, modulation masking is most pronounced when signals and maskers fluctuate at similar rates (Bacon & Grantham 1989). Importantly, studies of human speech communication have found that, under some circumstances, both modulation masking and masking release due to dip listening can occur simultaneously while listening to speech in fluctuating noise (Kwon & Turner 2001).
The effects of fluctuating noise on the ability to recognize communication signals shown here are not unique to vertebrates. Following similar methods, Ronacher & Hoffmann (2003) found that male grasshoppers (Chorthippus biguttulus) experience masking release by means of dip listening when the background noise fluctuates at slow rates. Interestingly, the dip listening effect was observed when the target signal was long (12 subunits) but not when it was short (4 subunits). In addition, male grasshoppers also experienced modulation masking when the background noise and the signal fluctuated at similar rates. The modulation masking effect was observed with both long and shorts signals.
A key question arising from our results and those of Ronacher & Hoffmann (2003) concerns the extent to which dip listening, modulation masking, or both, might influence signal recognition in the natural setting of a breeding aggregation. Answering this question requires a detailed understanding of the animal’s acoustic environment. We recently showed that the sounds of grey treefrog choruses fluctuate both at slow rates (< 2 Hz) and at a faster rate (≈ 40 Hz – 60 Hz) (Vélez & Bee 2010). The slow rates of fluctuation present in natural choruses are due to a combination of low-frequency environmental perturbations (e.g., air turbulence; (Richards & Wiley 1980) and the production of temporally discrete calls by individual males in the chorus (Vélez & Bee 2010). The high rates of fluctuation reflect the pulse repetition rate of the grey treefrog advertisement call (Vélez & Bee 2010). Additional acoustic analyses of recordings of grey treefrog choruses revealed that high fluctuation rates (≈ 40 Hz – 60 Hz) are more prominent when sound levels are high (i.e., at the peaks in amplitude) and far less prominent during dips in sound level (Supplementary Material 1). Thus, in a chorus setting, modulation masking should be most pronounced at those moments when the ambient noise level is already high (e.g., when a nearby male calls), and less pronounced during momentary dips in noise level (e.g., between the calls of nearby males). These results suggest that female grey treefrogs, like humans (Kwon & Turner 2001, Vestergaard et al. 2011), may at times experience a combination of dip listening and modulation masking in noisy social environments.
Solutions to cocktail-party-like problems
The perceptual mechanisms by which nonhuman animals solve cocktail-party-like problems potentially include abilities to exploit various spectral, temporal, and spatial cues (Hulse 2002; Bee & Micheyl 2008). In aggregations of conspecific signallers, in which signals and noise overlap in acoustic frequency, temporal and spatial cues should be particularly important. For instance, the outstanding ability of king penguin (Aptenodytes patagonicus) chicks to recognize parental calls in cacophonous crèches was hypothesized to result from adaptations of the auditory system that exploit amplitude fluctuations in background noise (Aubin & Jouventin 1998). While this hypothesis has not been directly tested in penguins, our results and those of Ronacher and Hoffmann (2003) provide robust support for the idea that nonhuman receivers can also listen in the dips of fluctuating noise in large social aggregations.
Another series of studies has shown that receivers from diverse taxa experience a significant release from masking when signals and sources of noise are spatially separated (reviewed in Bee & Micheyl 2008). In treefrogs, for example, spatial release from masking contributes to recognition of conspecific signals (Schwartz & Gerhardt 1989; Bee 2007a; Nityananda & Bee in review) and discrimination between conspecific and heterospecific signals (Bee 2008a). Furthermore, in chorus-like situations, spatial separation between male treefrogs improves the ability of females to discriminate among conspecific calls varying in attractiveness (Richardson & Lengagne 2010). In natural settings, we would predict that receivers benefit from synergistic interactions between spatial release from masking and dip listening, as is the case in humans (Hawley et al. 2004).
Sexual selection (either inter- or intra-sexual) has also favoured the evolution of various signalling strategies to overcome the detrimental effects of noise (reviewed in Brumm & Slabbekoorn 2005; Schwartz & Bee in press). For example, although they do not avoid call overlap with their neighbours in a chorus (Schwartz et al. 2002), male grey treefrogs increase both the duration and redundancy of their signals by adding pulses to lengthen their calls as noise levels and local caller densities increase (Schwartz et al. 2002; Love & Bee 2010). The functional significance of increasing call duration from the male perspective may stem from dip listening on the part of females; males that produce longer calls should have a higher probability of placing more consecutive pulses in the dips of temporally fluctuating chorus noise. This hypothesis is in line with the “Interference Risk Hypothesis” (Schwartz et al. 2001, 2002, 2008), which states that males lengthen their calls because doing so increases the likelihood that, on average, they will broadcast more pulses per call free of overlap by the calls of other males. This appears to be the case in grasshoppers; males experience a release from masking in the presence of fluctuating noise with long signals, but not with short signals (Ronacher & Hoffmann 2003), suggesting an advantage for females that produce longer signals in the presence of fluctuating noise. Available studies of the eastern grey treefrog (H. versicolor), however, offer little support for this functional explanation for such change in male signalling behaviour (Schwartz et al. 2002, 2008). Future studies of signal recognition with fluctuating maskers and signals of different duration might shed light on why grey treefrog males increase the duration of their calls in noisy environments.
Proximate level explanations for dip listening
Our results are consistent with previous behavioural and neurophysiological studies of sound pattern recognition in frogs. Subjects in experiment 2 required a minimum effective call duration of six to nine consecutive pulses before responding. In the eastern grey treefrog (H. versicolor), in which the pulses and interpulse intervals of the call are about twice as long as those of Cope’s grey treefrogs (H. chrysoscelis), the threshold number of pulses necessary to elicit phonotaxis is between three and six pulses (Bush et al. 2002). A neurophysiological mechanism that may explain these behavioural data involves “pulse-integrator” neurons in the frog midbrain that only fire in response to a threshold number of consecutive pulses produced with specific interpulse intervals (Alder & Rose 1998; Edwards et al. 2002; Schwartz et al. 2010a). Importantly, different neurons can have different threshold numbers of interpulse intervals. Hence, a possible mechanistic explanation for our data is that recognition thresholds were lower in the presence of slowly fluctuating maskers, compared with faster fluctuating maskers, because the number of consecutive pulses and interpulse intervals fitting in the dips exceeded the thresholds of relatively larger populations of pulse-integrator neurons in the midbrain. We hypothesize that the response properties of pulse-integrator neurons might also explain the lack of masking release at faster modulation rates, where five or fewer consecutive pulses fell in the dips (see Figure 1e). Similar to the “resetting” of pulse-integrator neurons after an interpulse interval with anomalous duration (Edwards et al. 2002), momentary peaks in amplitude that mask pulses and interpulse intervals might also reset these neurons. Future neurophysiological studies of the responses of pulse-integrator neurons in the context of dip listening will be an important next step in understanding how the anuran auditory system exploits temporal fluctuations in background noise.
Conclusions
To our knowledge, this is the first study to demonstrate that a nonhuman vertebrate benefits from listening in the dips of ambient noise to perceive communication signals. We suspect dip listening is a widespread hearing mechanism shared by different vertebrate and invertebrate taxa that facilitates acoustic communication in noisy environments. The ability of female frogs to exploit temporal fluctuations in background noise may be constrained at a proximate level by specific sensory mechanisms involving pulse-integrator neurons responsible for encoding temporal properties critical for species recognition. At an ultimate level, dip listening by females may act as a source of selection favouring males that are able to produce longer calls. Additional experiments with maskers having natural amplitude fluctuations and calls varying in duration will shed additional light on the relative benefits and constraints experienced by signallers and receivers in natural acoustic environments.
Supplementary Material
Highlights.
Dip listening describes our ability to catch ‘glimpses’ of target signals when background noise dips to low levels.
We asked whether female grey treefrogs benefit from dip listening to recognize mating calls in the presence of noise.
Compared to nonfluctuating noise, signal recognition thresholds were lower in slowly fluctuating noise.
Dip listening occurred when nine or more consecutive pulses of the mating call fell in dips of fluctuating noise.
In quiet conditions, mating calls of at least nine pulses were necessary for call recognition.
Acknowledgments
We thank N. Buerkle, B. Chicoine, J. Cook, C. Espegard, S. Feingold, N. Gordon, N. Hein, K. Heino, J. Henly, S. Hinrichs, J. Kleinschmidt, B. Linehan-Skillings, J. Mertz, C. Nguyen, S. Peterson, A. Rapacz Van-Neuren, M. Rodionova, and especially S. Tekmen for help collecting and testing frogs, M. Crawford, M. Linck, J. Moriarty, E. Quinn, and D. Pereira for access to frog breeding sites, and B. Pettit, E. Love, K. Schrode, and S. Tekmen for feedback on earlier versions of the manuscript. Different aspects of this work were supported by a UMN Graduate School Thesis Research Grant and a Dayton-Wilkie Fellowship to A. Vélez and by NSF IOS 0842759 and NIDCD 5R01DC009582 to M. Bee.
Footnotes
Publisher's Disclaimer: This is a PDF file of an unedited manuscript that has been accepted for publication. As a service to our customers we are providing this early version of the manuscript. The manuscript will undergo copyediting, typesetting, and review of the resulting proof before it is published in its final citable form. Please note that during the production process errors may be discovered which could affect the content, and all legal disclaimers that apply to the journal pertain.
References
- Alder TB, Rose GJ. Long-term temporal integration in the anuran auditory system. Nature Neuroscience. 1998;1:519–523. doi: 10.1038/2237. [DOI] [PubMed] [Google Scholar]
- Arak A. Sexual selection by male-male competition in natterjack toad choruses. Nature. 1983;306:261–262. [Google Scholar]
- Aubin T, Jouventin A. Cocktail-party effect in king penguins. Proceedings of the Royal Society: Biological Sciences. 1998;265:1665–1673. [Google Scholar]
- Bacon SP, Grantham DW. Modulation masking: Effects of modulation frequency, depth, and phase. Journal of the Acoustical Society of America. 1989;85:2575–2580. doi: 10.1121/1.397751. [DOI] [PubMed] [Google Scholar]
- Bacon SP, Opie JM, Montoya DY. The effects of hearing loss and noise masking on the masking release for speech in temporally complex backgrounds. Journal of Speech Language and Hearing Research. 1998;41:549–563. doi: 10.1044/jslhr.4103.549. [DOI] [PubMed] [Google Scholar]
- Bee MA. Sound source segregation in grey treefrogs: spatial release from masking by the sound of a chorus. Animal Behaviour. 2007a;74:549–558. [Google Scholar]
- Bee MA. Selective phonotaxis by male wood frogs (Rana sylvatica) to the sound of a chorus. Behavioral Ecology and Sociobiology. 2007b;61:955–966. [Google Scholar]
- Bee MA. Finding a mate at a cocktail party: Spatial release from masking improves acoustic mate recognition in grey treefrogs. Animal Behaviour. 2008a;75:1781–1791. doi: 10.1016/j.anbehav.2007.10.032. [DOI] [PMC free article] [PubMed] [Google Scholar]
- Bee MA. Parallel female preferences for call duration in a diploid ancestor of an allotetraploid treefrog. Animal Behaviour. 2008b;76:845–853. doi: 10.1016/j.anbehav.2008.01.029. [DOI] [PMC free article] [PubMed] [Google Scholar]
- Bee MA, Micheyl C. The “cocktail party problem”: What is it? How can it be solved? and Why should animal behaviorists study it? Journal of Comparative Psychology. 2008;122:235–251. doi: 10.1037/0735-7036.122.3.235. [DOI] [PMC free article] [PubMed] [Google Scholar]
- Bee MA, Schwartz JJ. Behavioral measures of signal recognition thresholds in frogs in the presence and absence of chorus-shaped noise. Journal of the Acoustical Society of America. 2009;126:2788–2801. doi: 10.1121/1.3224707. [DOI] [PMC free article] [PubMed] [Google Scholar]
- Bee MA, Vélez A, Forester JD. Sound level discrimination by Cope’s gray treefrog (Hyla chrysoscelis) in the presence and absence of chorus-shaped noise. Journal of the Acoustical Society of America. doi: 10.1121/1.3699271. in review. [DOI] [PMC free article] [PubMed] [Google Scholar]
- Bronkhorst AW. The cocktail party phenomenon: A review of research on speech intelligibility in multiple-talker conditions. Acustica. 2000;86:117–128.21. [Google Scholar]
- Brumm H, Slabbekoorn H. Acoustic communication in noise. Advances in the Study of Behavior. 2005;35:151–209. [Google Scholar]
- Bush SL, Gerhardt HC, Schul J. Pattern recognition and call preferences in treefrogs (Anura: Hylidae): a quantitative analysis using a no-choice paradigm. Animal Behaviour. 2002;63:7–14. [Google Scholar]
- Christie K, Schul J, Feng AS. Phonotaxis to male’s calls embedded within a chorus by female gray treefrogs, Hyla versicolor. Journal of Comparative Physiology A. 2010;196:569–579. doi: 10.1007/s00359-010-0544-2. [DOI] [PubMed] [Google Scholar]
- Cooke M. A glimpsing model of speech perception in noise. Journal of the Acoustical Society of America. 2006;119:1562–1573. doi: 10.1121/1.2166600. [DOI] [PubMed] [Google Scholar]
- Edwards CJ, Alder TB, Rose GJ. Auditory midbrain neurons that count. Nature Neuroscience. 2002;5:934–936. doi: 10.1038/nn916. [DOI] [PubMed] [Google Scholar]
- Fellers G. Aggression, territoriality, and mating behaviour in North American treefrogs. Animal Behaviour. 1979;27:107–119. [Google Scholar]
- Gerhardt HC. Sound pressure levels and radiation patterns of vocalizations of some North American frogs and toads. Journal of Comparative Physiology A. 1975;102:1–12. [Google Scholar]
- Gerhardt HC. Phonotaxis in female frogs and toads: execution and design of experiments. In: Klump GM, Dooling RJ, Fay RR, Stebbins WC, editors. Methods in Comparative Psychoacoustics. Birkhäuser Verlag; Basel: 1995. pp. 209–220. [Google Scholar]
- Gerhardt HC, Huber F. Acoustic Communication in Insects and Anurans: Common Problems and Diverse Solutions. Chicago: Chicago University Press; 2002. [Google Scholar]
- Gerhardt HC, Klump GM. Masking of acoustic signals by the chorus background noise in the green treefrog: A limitation on mate choice. Animal Behaviour. 1988a;36:1247–1249. [Google Scholar]
- Gerhardt HC, Klump GM. Phonotactic responses and selectivity of barking treefrogs (Hyla gratiosa) to chorus sounds. Journal of Comparative Physiology A. 1988b;163:795–802. [Google Scholar]
- Gerhardt HC, Tanner SD, Corrigan CM, Walton HC. Female preference functions based on call duration in the gray tree frog (Hyla versicolor) Behavioral Ecology. 2000;11:663–669. [Google Scholar]
- Gustafsson HA, Arlinger SD. Masking of speech by amplitude modulated-noise. Journal of the Acoustical Society of America. 1994;95:518–529. doi: 10.1121/1.408346. [DOI] [PubMed] [Google Scholar]
- Hawley ML, Litovski RY, Culling JF. The benefit of binaural hearing in a cocktail party: Effect of location and type of interferer. Journal of the Acoustical Society of America. 2004;115:833–843. doi: 10.1121/1.1639908. [DOI] [PubMed] [Google Scholar]
- Hulse SH. Auditory scene analysis in animal communication. Advances in the Study of Behavior. 2002;31:163–200. [Google Scholar]
- Joris PX, Schreiner CE, Rees A. Neural processing of amplitude-modulated sounds. Physiological Reviews. 2004;84:541–577. doi: 10.1152/physrev.00029.2003. [DOI] [PubMed] [Google Scholar]
- Klump GM. Bird communication in the noisy world. In: Kroodsma DE, Miller EH, editors. Ecology and Evolution of Acoustic Communication in Birds. Ithaca, NY: Cornell University Press; 1996. pp. 321–338. [Google Scholar]
- Kwon BJ, Turner CW. Consonant identification under maskers with sinusoidal modulation: Masking release or modulation interference? Journal of the Acoustical Society of America. 2001;110:1130–1140. doi: 10.1121/1.1384909. [DOI] [PubMed] [Google Scholar]
- Langemann U, Klump GM. Perception and acoustic communication networks. In: McGregor PK, editor. Animal Communication Networks. Cambridge: Cambridge University Press; 2005. pp. 451–480. [Google Scholar]
- Love EK, Bee MA. An experimental test of noise-dependent voice amplitude regulation in Cope’s grey treefrog (Hyla chrysoscelis) Animal Behaviour. 2010;80:509–515. doi: 10.1016/j.anbehav.2010.05.031. [DOI] [PMC free article] [PubMed] [Google Scholar]
- Marshall VT, Schwartz JJ, Gerhardt HC. Effects of heterospecific call overlap on the phonotactic behaviour of grey treefrogs. Animal Behaviour. 2006;72:449–459. [Google Scholar]
- McDermott JH. The cocktail party problem. Current Biology. 2009;19:R1024–R1027. doi: 10.1016/j.cub.2009.09.005. [DOI] [PubMed] [Google Scholar]
- Nelken I, Rotman Y, Yosef OB. Responses of auditory-cortex neurons to structural features of natural sounds. Nature. 1999;397:154–157. doi: 10.1038/16456. [DOI] [PubMed] [Google Scholar]
- Nityananda V, Bee MA. Spatial Release from Masking in a Free-field Source Identification Task by Gray Treefrogs. Hearing Research. doi: 10.1016/j.heares.2012.01.003. in review. [DOI] [PMC free article] [PubMed] [Google Scholar]
- Richards DG, Wiley RH. Reverberations and amplitude fluctuations in the propagation of sound in a forest: Implications for animal communication. American Naturalist. 1980;115:381–399. [Google Scholar]
- Richardson C, Lengagne T. Multiple signals and male spacing affect female preference at cocktail parties in treefrogs. Proceedings of the Royal Society: Biological Sciences. 2010;277:1247–1252. doi: 10.1098/rspb.2009.1836. [DOI] [PMC free article] [PubMed] [Google Scholar]
- Ronacher B, Hoffmann C. Influence of amplitude modulated noise on the recognition of communication signals in the grasshopper Chorthippus biguttulus. Journal of Comparative Physiology A. 2003;189:419–425. doi: 10.1007/s00359-003-0417-z. [DOI] [PubMed] [Google Scholar]
- Schul J, Bush SL. Non-parallel coevolution of sender and receiver in the acoustic communication system of treefrogs. Proceedings of the Royal Society: Biological Sciences. 2002;1502:1847–1852. doi: 10.1098/rspb.2002.2092. [DOI] [PMC free article] [PubMed] [Google Scholar]
- Schwartz JJ, Bee MA. Anuran signal production in noisy environments. In: Brumm H, editor. Animal Communication and Noise. Springer; New York: in press. [Google Scholar]
- Schwartz JJ, Freeberg TM. Acoustic interaction in animal groups: Signaling in noisy and social contexts - Introduction. Journal of Comparative Psychology. 2008;122:231–234. doi: 10.1037/0735-7036.122.3.231. [DOI] [PubMed] [Google Scholar]
- Schwartz JJ, Gerhardt HC. Spatially mediated release from auditory masking in an anuran amphibian. Journal of Comparative Physiology A. 1989;166:37–41. [Google Scholar]
- Schwartz JJ, Marshall VT. Forms of call overlap and their impact on advertisement call attractiveness to females of the gray treefrog, Hyla versicolor. Bioacoustics. 2006;16:39–56. [Google Scholar]
- Schwartz JJ, Buchanan BW, Gerhardt HC. Female mate choice in the gray treefrog (Hyla versicolor) in three experimental environments. Behavioral Ecology and Sociobiology. 2001;49:443–455. [Google Scholar]
- Schwartz JJ, Buchanan BW, Gerhardt HC. Acoustic interaction among male gray treefrogs, Hyla versicolor, in a chorus setting. Behavioral Ecology and Sociobiology. 2002;53:9–19. [Google Scholar]
- Schwartz JJ, Brown R, Turner S, Dushaj K, Castano M. Interference risk and the function of dynamic shifts in calling in the gray treefrog (Hyla versicolor) Journal of Comparative Psychology. 2008;122:283–288. doi: 10.1037/0735-7036.122.3.283. [DOI] [PubMed] [Google Scholar]
- Schwartz JJ, Huth K, Hunce R, Lentine B. Effect of anomalous pulse timing on call discrimination by females of the gray treefrog (Hyla versicolor): Behavioral correlates of neurobiology. The Journal of Experimental Biology. 2010a;213:2066–2072. doi: 10.1242/jeb.043372. [DOI] [PubMed] [Google Scholar]
- Swanson EM, Tekmen SM, Bee MA. Do female anurans exploit inadvertent social information to locate breeding aggregations? Canadian Journal of Zoology. 2007;85:921–932. [Google Scholar]
- Vélez A, Bee MA. Signal recognition by frogs in the presence of temporally fluctuating chorus-shaped noise. Behavioral Ecology and Sociobiology. 2010;64:1695–1709. doi: 10.1007/s00265-010-0983-3. [DOI] [PMC free article] [PubMed] [Google Scholar]
- Vélez A, Schwartz JJ, Bee MA. Anuran signal perception in noisy environments. In: Brumm H, editor. Animal Communication and Noise. Springer; New York: in press. [Google Scholar]
- Vestergaard MD, Fyson NRC, Patterson RD. The mutual roles of temporal glimpsing and vocal characteristics in cocktail-party listening. Journal of the Acoustical Society of America. 2011;130:429–439. doi: 10.1121/1.3596462. [DOI] [PubMed] [Google Scholar]
- Wollerman L. Acoustic interference limits call detection in a Neotropical frog Hyla ebraccata. Animal Behaviour. 1999;57:529–536. doi: 10.1006/anbe.1998.1013. [DOI] [PubMed] [Google Scholar]
- Wollerman L, Wiley RH. Background noise from a natural chorus alters female discrimination of male calls in a Neotropical frog. Animal Behaviour. 2002;63:15–22. [Google Scholar]
Associated Data
This section collects any data citations, data availability statements, or supplementary materials included in this article.