

Abstract
The digital age has brought both technical advances and ethical quandaries regarding data acquisition and image presentation in the field of cell biology. Image manipulation has drawn considerable attention in the past decade, leading to general guidelines for ethical data processing. However, effective methods of image presentation have been discussed only cursorily and have been largely overlooked. Under standard viewing conditions, the human visual system imposes limitations for readers analyzing fluorescence images. In this paper, I discuss the advantages and limitations of image-manipulation techniques with respect to the human visual system, including contrast stretching, nonlinear grayscale transformations, and pseudocoloring. While online data viewing presents innovative ways to access image information, most images continue to be viewed in static publications, in which image presentation is critical for effective information transmission.
All fluorescence images are manipulated before publication. Representative images are selected, irrelevant or extraneous information is cropped out, and image size and resolution are adjusted to the needs of the publishing journal. Beyond these minimal adjustments, which manipulations are acceptable and which are not? Guidelines that outline what is not acceptable have been widely enacted based on ethical standards of data presentation (Rossner, 2002; Rossner and Yamada, 2004). However, little attention has been paid to acceptable manipulations (Brown, 2007). In this paper, I provide a brief overview of acceptable fluorescence image manipulations and their impact on feature visibility.
CONTRAST STRETCHING
Contrast is one of the most important aspects of feature visibility. Detail discrimination relies on contrast, which is the difference in brightness between regions of the same field of view. The human visual system can detect (at best) ∼100 different gray levels in one visual scene, it is therefore difficult to resolve features that are only a few gray values brighter than their surroundings (Pawley, 2006). As a result, increased contrast generally yields better detail discrimination. However, modifications that increase contrast can mask other spatial information, so transformations to fluorescence images must be applied cautiously.
Modern scientific cameras can acquire images with a dynamic range that is significantly larger than the human eye can detect or that computer monitors can display (for example, 16-bit cameras encode 65,536 gray levels, whereas monitors display only 256 values). Additionally, most fluorescence images do not utilize the fully available camera bit-depth, so scaling fluorescence images is the first and simplest transformation to improve image visibility. The image histogram illustrates the distribution of pixels with specified gray values. The image in Figure 1A uses only a subset of the available gray levels, with most pixels falling in the dark range (background). To display an image using the full range of available gray values, contrast is “stretched.” Contrast stretching sets the brightest pixel as white and the darkest pixel as black, redistributing the intermediate gray values without altering the shape of the histogram (Figure 1B). The common “autoscale” function automatically performs this transformation, and it does not alter the underlying spatial information. At minimum, all images for publication should be contrast-stretched to the upper/lower limits of an image's dynamic range. Failing to do so unnecessarily limits the contrast of relevant features.
FIGURE 1:

Contrast stretch and nonlinear (power-law) transformations. Original (A) and scaled (B–F) images of GFP-v-SNARE in yeast cells responding to mating pheromone. Autoscale contrast stretch (B) redistributes pixel values across the whole display range, without losing spatial information. Contrast can be stretched further (C) by setting an intermediate gray value (B, arrowhead) as white, but gray values in the range above the upper limit are clipped (C, asterisks), losing spatial information in the brightest regions. The nonlinear power-law transformation (D and E) redistributes gray values according to a logarithmic formula with exponent γ, resulting in increased contrast for a subset of gray values. Inversion (F) of an autoscaled image (as in B) displays dark values as light and vice versa without altering the distribution of pixel intensities.
Occasionally, the gray values of a relevant feature occupy a subset of the entire grayscale range of an image. In that case, contrast can be stretched further. For example, an intermediate pixel value (Figure 1B, arrowhead) can be set as white, so the lower gray values occupy a wider range of display levels, increasing contrast in the region of interest (Figure 1C). However, stretching contrast past the upper and lower bounds results in “clipping”: the pixel values that fall above the selected upper bound are displayed as white and vice versa for black. Because all clipped pixels are displayed as white (or black), clipping eliminates differences in pixel intensities (i.e., spatial information) in the brightest regions. In general, clipping can be useful if the clipped regions are scientifically irrelevant (e.g., bright dead cells, hot pixels) or distracting (a bright cortex when the region of interest is the cytoplasm).
NONLINEAR TRANSFORMATIONS
An alternative to contrast stretching is the use of nonlinear transformations, which convert an input gray value into an output display level according to a predetermined formula. A wide variety of transformation formulas are available for use in image processing (Russ, 2006; Gonzalez and Woods, 2008; Spring et al., 2010). The power-law transformation is the most commonly used nonlinear transformation in biology; it displays pixel intensities according to a logarithmic formula in which the exponent γ determines output intensities. A γ < 1 stretches dark values and compresses light values, and vice versa for γ > 1 (Figure 1, D and E).
Nonlinear transformations have the advantage that, when performed conservatively, they increase the contrast for certain gray levels without clipping low/high pixel intensities. Caution must be exercised, however, because transformations that significantly compress gray values (for the power-law transformation, very large or very small γ values) can have the same effect as clipping. If light pixel intensities are significantly compressed, then the brightest pixel intensities will be compressed so much that all are displayed as “white,” the same effect as clipping. Note that all nonlinear transformations must be disclosed, since they change the relationship between gray values within a single image.
Regardless of the transformation performed, identical scaling should be applied to images from the same field of view or from a single time lapse. Applying the same transformation avoids artificial differences in perceived brightness or contrast and allows accurate comparisons between images.
INVERSION
Another transformation to increase the reader's visual sensitivity to dim features is inversion. Inversion maps dark values to light and vice versa, without altering the distribution of gray values (Figure 1F). The advantage of inversion comes from the sensitivity of the human visual system, which continually adapts to ambient light levels. The effect is similar to autoscaling, such that the brightest visible point in any field of view is perceptually bright, regardless of absolute luminance levels. Since readers encounter images in the context of a bright white page, the visual system sets the page, not the brightest value in the image, as “white” (Cataliotti and Gilchrist, 1995). The result is that gray values in the image are perceptually darkened—a problem when gray features need to be distinguished from a black background.
Inverting images solves the problem of visual adaptation without altering the underlying data. An inverted image presents a gray fluorescence signal on a white background, which has increased perceptual contrast for readers adapted to a white page in bright conditions. Note that inversion is most effective when dim features are of greatest relevance; after inversion, bright features are displayed as dark values, for which sensitivity is decreased. One of the additional benefits of inversion is a reduction in ink usage during printing.
COLOR-CODED CONTRAST
Visualizing slight differences in gray values can be facilitated with the use of color look-up tables (LUTs), which display gray levels according to a set map of colors, rather than intensity (Figure 2A). While the human eye can only distinguish up to 100 gray values in a scene, it can distinguish a wide range of color hues. Thus a rainbow LUT can display increasing segments of gray values as shades of red, yellow, green, and blue (Figure 2B). The result is that small differences in gray values can be distinguished, even across a wide dynamic range (note in Figure 2B that features are distinguishable in both the bright cell tip and the dim cytoplasm). However, caution should be used when applying color LUTs, because human perception of color is nonlinear, as described in Pseudocoloring. Additionally, if a scientific conclusion relies on slight differences in gray levels, quantitative data should accompany the image.
FIGURE 2:
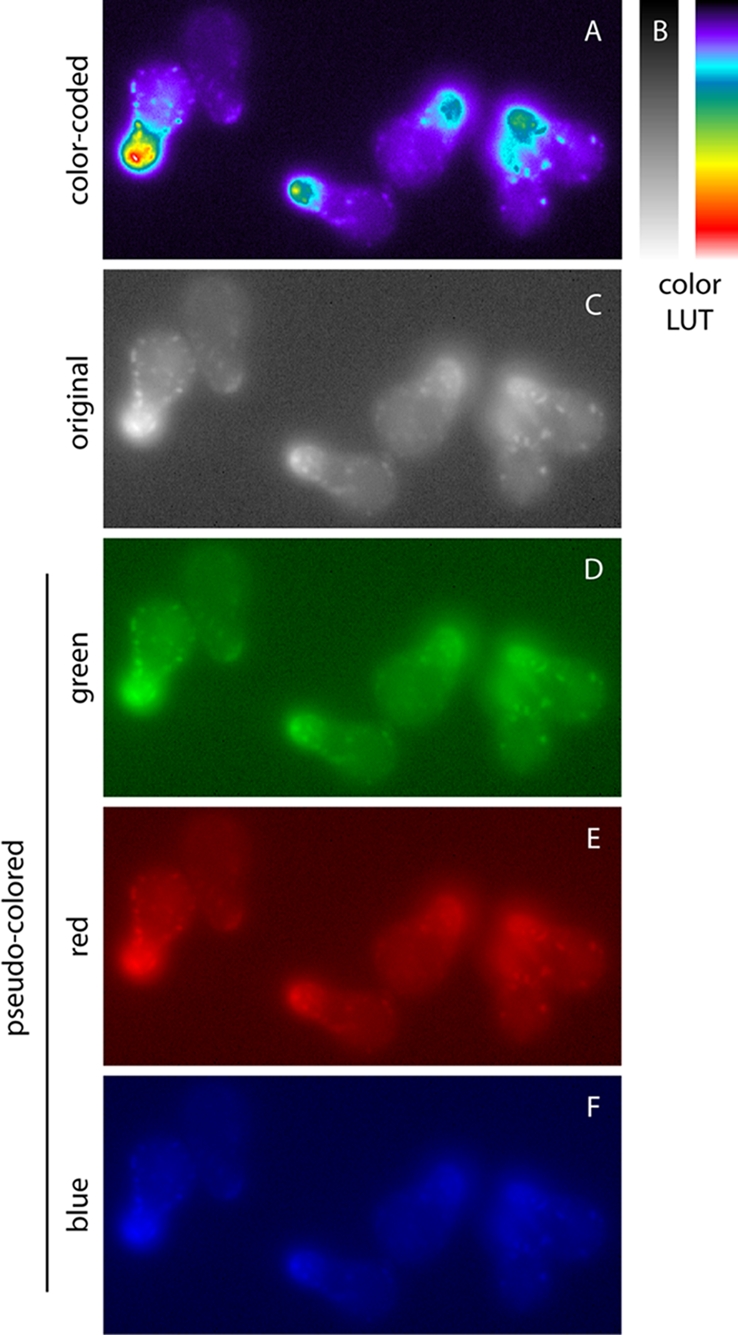
Color-coded contrast and pseudocoloring. Color-coded contrast (A) increases visual sensitivity to shallow contrast by representing gray values as varying color hues, according to an arbitrary color LUT (B). Pseudocoloring (D–F) applies a single-hue LUT to a grayscale image (C), resulting in gray levels represented by color brightness. The original image is identical to the power-law transformation (γ = 3.0) from Figure 1.
PSEUDOCOLORING
While most fluorescence images are captured in gray scale, many images are pseudocolored for publication. Pseudocoloring applies a color LUT to an image, such that “white” is displayed as the brightest value of a specific color, for example, green for green fluorescent protein (GFP; Figure 2, C–F). Computer monitors display colors in RGB (red, green, blue), so a green pseudocolored image displays pixel intensity in the G channel only.
Pseudocoloring results in several problems for visualizing contrast. Human color perception is nonlinear (Pokorny and Smith, 1970; Welland and Donnelly, 2006). Thus distinguishing changes in wavelength depends on the color; for example, we see changes better in the yellow range than in the blue range. Additionally, the human visual system is less able to harvest light in the blue–violet range, and visual acuity is reduced in that range as well (Mollon, 1982). This phenomenon explains why yellows and greens appear bright and blues and purples appear dark, even when luminance values are held constant. This is true for the optimal human visual-processing system; color blindness compounds the problem.
Additionally, monitors represent color with the RGB color gamut, and printers use CMYK (cyan, magenta, yellow, black), which covers a smaller subset of the visible color space. Thus printing an image converts RGB to CMYK, which can introduce perceived hue and saturation changes. Because fluorescence information is encoded in color for pseudocolored images, this conversion decreases information fidelity for printed articles.
To avoid problems from color perception, single-channel images should be presented in gray scale. For colocalization studies, pseudocoloring is currently the best method for comparing multiple probes. Where possible, grayscale images of each probe should be presented alongside the overlay to allow inspection of individual channels. Finally, alternatives to traditional red–green overlays have been proposed (including magenta–green or cyan–yellow) to facilitate information transmission for the color blind (Okabe and Kei, 2002).
ONLINE DATA VIEWING
The transition to online journal publication introduces the possibility for better image display. The Journal of Cell Biology (JCB) has been a pioneer in the field, creating the JCB DataViewer, which allows readers to view and analyze published images online (Hill, 2008). This application allows readers to separate multichannel overlays into single channels, to set display levels, to turn on and off pseudocoloring, and to scroll through Z-stacks (among other features). By choosing display parameters, readers can better assess the validity of the authors’ conclusions and look for features unaddressed by the authors.
While the JCB DataViewer solves many image-display problems, efficient display is still critical for images destined for publication. Currently, JCB is the only journal with an online image-visualization application. Additionally, many readers still print or read papers in the PDF format. Finally, even if every image were available for visualization in an online application, only a subset of readers with a special interest in the topic would likely access the available information.
Thus many published images are still viewed in print, and most are inaccessible for further analysis. As a result, authors should take care to present their fluorescence images with a focus on efficient visualization of relevant features.
SUMMARY
Effective image presentation is critical for publications that rely on the reader's interpretation of fluorescence images to support scientific conclusions. Image scaling, including contrast stretching, nonlinear transformations, and inversion, as well as the use of pseudocolor, can significantly improve the visibility of relevant features. However, these modifications should be used only in the appropriate contexts, and the associated risks (Table 1) should be evaluated before images are finalized for publication.
TABLE 1:
Summary of image-manipulation techniques, appropriate application contexts, and associated limitations.
| Manipulation | Use it when… | Cautions |
|---|---|---|
| Contrast stretch | The dynamic range of an image does not utilize the full available bit-depth. | Be careful of clipping, which eliminates spatial information in very bright or very dark regions. |
| Extraneous bright/dark signal is present. | Apply identically to all comparable images. | |
| Nonlinear transformation (e.g., power-law [γ]) | Both dim and bright features are relevant. | Depending on the value of γ, can have the same effect as clipping. |
| Changes intensity relationships within one image; therefore must be disclosed in text. | ||
| Inversion | Dim features are relevant. | Increases perceived contrast for dim features, but decreases contrast for bright features, without changing underlying information. |
| Color-coded contrast | Very small differences in intensities must be visualized. | Nonlinear color vision and RGB to CMYK conversion during printing decreases information fidelity. |
| Features in both the dim and bright regions are relevant. | If contrast is shallow but critical for a conclusion, quantitative data should accompany the image. | |
| Pseudocoloring | A multi-channel overlay is used to compare localization of multiple probes. | Contrast is best viewed in gray scale, thus avoid pseudocoloring for single-channel images. Nonlinear color vision and RGB-to-CMYK conversion during printing decreases information fidelity. Use magenta–green or cyan–yellow for the color blind. |
Acknowledgments
Many thanks to Sam Johnson for fruitful discussions, clarifications, and a critical reading of the manuscript. I am indebted to Alan Gilchrist for assistance in researching visual perception. Thanks to Daniel Lew, Audrey Howell, Hsin Chen, Sara Bristow, Chi-Fang Wu, and Eileen Thorsos for comments on the manuscript. I am grateful to the anonymous reviewers for direction and insightful comments.
Abbreviations used:
- GFP
green fluorescent protein
- JCB
Journal of Cell Biology
- LUT
look-up table
Footnotes
REFERENCES
- Brown C. Fluorescence microscopy—avoiding the pitfalls. J Cell Sci. 2007;120:1703–1705. doi: 10.1242/jcs.03433. [DOI] [PubMed] [Google Scholar]
- Cataliotti J, Gilchrist A. Local and global processes in surface lightness perception. Percept Psychophys. 1995;57:125–135. doi: 10.3758/bf03206499. [DOI] [PubMed] [Google Scholar]
- Gonzalez R, Woods R. Digital Image Processing. 3rd. Upper Saddle River, NJ: Prentice Hall; 2008. [Google Scholar]
- Hill E. Announcing the JCB DataViewer, a browser-based application for viewing original image files. J Cell Bio. 2008;183:969–970. [Google Scholar]
- Mollon JD. Color vision. Annu Rev Psychol. 1982;33:41–85. doi: 10.1146/annurev.ps.33.020182.000353. [DOI] [PubMed] [Google Scholar]
- Okabe M, Kei I. Color Universal Design (CUD): How to Make Figures and Presentations That Are Friendly to Colorblind People. 2002. http://jfly.iam.u-tokyo.ac.jp/color (accessed 13 September 2011)
- Pawley J. Handbook of Biological Confocal Microscopy. 3rd. New York: Springer Science + Business; 2006. [Google Scholar]
- Pokorny J, Smith VC. Wavelength discrimination in the presence of added chromatic fields. J Opt Soc Am. 1970;60:562–569. doi: 10.1364/josa.60.000562. [DOI] [PubMed] [Google Scholar]
- Rossner M. Figure manipulation: assessing what is acceptable. J Cell Bio. 2002;158:1151. [Google Scholar]
- Rossner M, Yamada KM. What's in a picture? The temptation of image manipulation. J Cell Bio. 2004;166:11–15. doi: 10.1083/jcb.200406019. [DOI] [PMC free article] [PubMed] [Google Scholar]
- Russ J. The Image Processing Handbook. 5th. Boca Raton, FL: CRC Press; 2006. [Google Scholar]
- Spring K, Russ J, Davidson M. Basic Properties of Digital Images. Olympus Microscopy Resource Center. 2010. www.olympusmicro.com/primer/digitalimaging/digitalimagebasics.html (accessed 21 December 2011)
- Welland M, Donnelly N. Are we properly using our brains in seismic interpretation? Leading Edge. 2006;25:142–144. [Google Scholar]