Abstract
Insertions and deletions (indels), together with nucleotide substitutions, are major drivers of sequence evolution. An excess of deletions over insertions in genomic sequences—the so-called deletional bias—has been reported in a wide range of species, including mammals. However, this bias has not been found in the coding sequences of some mammalian species, such as human and mouse. To determine the strength of the deletional bias in mammals, and the influence of mutation and selection, we have quantified indels in both neutrally evolving noncoding sequences and protein-coding sequences, in six mammalian branches: human, macaque, ancestral primate, mouse, rat, and ancestral rodent. The results obtained with an improved algorithm for the placement of insertions in multiple alignments, Prank+F, indicate that contrary to previous results, the only mammalian branch with a strong deletional bias is the rodent ancestral branch. We estimate that such a bias has resulted in an ∼2.5% sequence loss of mammalian syntenic region in the ancestor of the mouse and rat. Further, a comparison of coding and noncoding sequences shows that negative selection is acting more strongly against mutations generating amino acid insertions than against mutations resulting in amino acid deletions. The strength of selection against indels is found to be higher in the rodent branches than in the primate branches, consistent with the larger effective population sizes of the rodents.
Short insertions and deletions (indels) account for a significant amount of the variation in mammalian genomes and are likely to make an important contribution to species-specific traits (Britten 2002; Wetterbom et al. 2006). Their importance for medical genetics is highlighted by the fact that they have been implicated in a wide range of human diseases, the archetypal example being the phenylalanine deletion at position 508 in the CFTR protein that results in cystic fibrosis (Riordan et al. 1989). Currently, there are about 27,000 short indels known to be associated with human disease (Stenson et al. 2009). However, to date there have been relatively few large-scale genomic studies on indels in comparison to the number of studies that have focused on nucleotide substitutions. In fact, sections of multiple alignments containing gaps (i.e., representing indel events) are often actively excluded from comparative analyses, perhaps due to a lack of suitable models describing the mechanisms involved in indel creation.
The best-characterized mechanism of indel generation is through sequence-slippage in the regions of repetitive sequence during DNA replication (Weber and Wong 1993), but this explains only a fraction of all indel events, with many appearing in areas of nonrepetitive sequence (Messer and Arndt 2007). Recombination has also been implicated in indel creation, as suggested by the overrepresentation of recombination-associated motifs in the vicinity of indels (Ball et al. 2005), while genome-wide mapping of recombination and replication-related features in the human genome suggests that recombination may be more important in the generation of insertions and that replication may be more relevant for deletions (Kvikstad et al. 2007).
Early studies using homologous protein families (de Jong and Ryden 1981) and human and mouse pseudogenes (Graur et al. 1989; Ophir and Graur 1997; Zhang and Gerstein 2003) found an excess of deletions over insertions, suggesting the existence of a mutational bias favoring deletions, and a recent study analyzing indels in noncoding regions in a set of 17 species, including representatives from Archaea, Bacteria, and Eukaryota, concluded that this deletional bias is universal (Kuo and Ochman 2009).
Large-scale analyses of indels in mammals have yielded contrasting results. In a comparison of rat, mouse, and human genomes, it was observed that all three branches showed a strong deletional bias (Cooper et al. 2004; Gibbs et al. 2004). In line with this, an analysis of unique introns from single-copy genes in human and chimpanzee found that deletions outnumbered insertions by a ratio of 1.7/1 (Kuo and Ochman 2009). However, insertions tended to be longer than deletions, and the deletional bias disappeared when the length of event was taken into account. Taylor et al. (2004) performed the first large-scale analysis of indels in orthologous rat and mouse proteins, using human as the outgroup. Surprisingly, they found that whereas in rat, the deletion-to-insertion (Del/Ins) ratio was 1.7, in mouse it was only 1.1. These differences are intriguing because they differ substantially from the findings for genomic sequence windows, where both species showed a marked excess of deletions over insertions and because these species have similar protein substitution rates, denoting similar selection strength (Gibbs et al. 2004; Toll-Riera et al. 2010). A further study that used chimp and an additional nonprimate mammal to infer the polarity of indel events in humans (Chen et al. 2007) found that, similar to the findings for mouse, the Del/Ins ratio in human coding sequences was close to 1, implying a lack of deletion bias. Thus it remains unclear whether a universal deletion bias exists.
In order to clarify the possible differences between coding and noncoding sequences and to be able to differentiate between mutational and selective forces, it is desirable to collect sequences from different genomic regions in a set of related species. The current availability of several relatively high-coverage (upwards of 6×) mammalian genomes (Lander et al. 2001; Venter et al. 2001; Waterston et al. 2002; Gibbs et al. 2004, 2007; Elsik et al. 2009) allows comparison of the rates of insertion and deletion in different branches of the mammalian phylogeny, for both coding and noncoding sequences. Several fundamental questions can be addressed: Is the proportion of deletions to insertions (mutational bias) similar across different mammalian branches? How do constraints in protein sequences affect the frequencies of indels with respect to any background mutational bias? Are species with smaller effective population sizes (e.g., primates) accumulating more indels due to less efficient negative selection?
To answer these questions, we have used large sets of coding (one-to-one orthologous proteins) and noncoding sequences (ancestral repeats) from five mammalian species. By applying parsimony, we have estimated the number of indels in six branches, four corresponding to relatively recent times (human, macaque, mouse, and rat) and two corresponding to deeper evolutionary periods (primate and rodent ancestral branches). Importantly, for the first time in this type of analysis, we have used a recently described multiple alignment algorithm, Prank+F, which, contrary to other existing methods, does not underestimate the number of insertions during alignment, as shown by sequence evolution simulations (Loytynoja and Goldman 2008). In accordance, it has been shown that Prank+F performs significantly better than other popular alignment algorithms when testing for evidence of positive selection in the presence of indels, as it reduces overalignment (Fletcher and Yang 2010). By use of this algorithm, the rodent ancestral branch is observed to have a strong deletional bias (Del/Ins ratio of 2.4), whereas the remaining branches show only moderate, or no significant, bias (Del/Ins ratio of 0.82–1.39). Additionally, comparison of coding with noncoding sequences indicates that, in all six lineages, insertions are more strongly eliminated from protein-coding sequences by selection than are deletions.
Results
Estimating background levels of lineage-specific mutation in noncoding regions
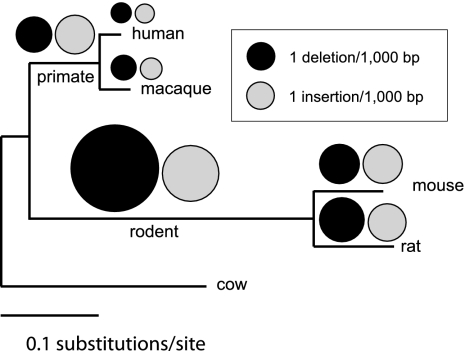
In order to estimate background indel rates and to disentangle the impact of mutation and selection, we decided to use mammalian ancestral repeat sequences as a control set with which to compare our set of orthologous coding sequences. Mammalian ancestral repeats are regions of the genome that contain long-dead transposons, the signature of which is still visible in syntenic regions of modern-day mammalian genomes. These regions are believed to be essentially function-free and thus constitute a good proxy for neutral evolution (Waterston et al. 2002; Lunter et al. 2006), providing a measure of the background mutation rate. Multiple sequence alignment (MSA) was performed with Prank+F (Loytynoja and Goldman 2008; Fletcher and Yang 2010), a program especially suitable for the estimation of indels, as it does not tend to underestimate the number of insertions, as commonly happens with other multiple alignment programs (Supplemental Tables 1–3). Using cow as outgroup, we estimated the number of indels (size, 1–30 bp) for six different branches in the mammalian phylogeny (Fig. 1). Due to the evolutionary proximity of the species under investigation, most observations were consistent with a unique insertion or deletion event (84%). The remaining cases, where it is clear that multiple events have occurred, were discounted from further analysis since it is not possible to unequivocally deduce the history of such events. While we considered events from 1–30 bp in length, the vast majority were 1 or 2 bp in size (Supplemental Table 4).
Figure 1.
Number of insertions and deletions in ancestral repeats in six mammalian branches. Events estimated from Prank+F alignments using parsimonious criteria. No data are provided for the cow as it is the outgroup.
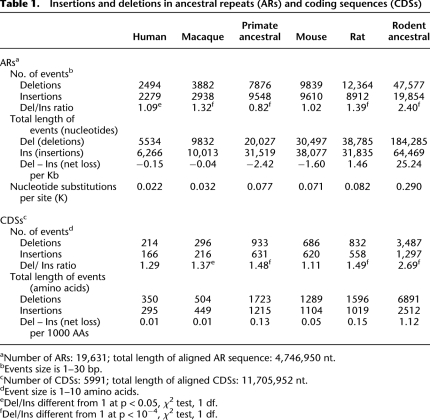
Taking insertions and deletions together, the number of indel events in different branches was roughly proportional to the branch nucleotide substitution rate (Table 1). However, we found important differences in the Del/Ins ratio, a somewhat surprising finding considering the evolutionary proximity of the species considered here (divergence time, <100 Myr ago). The lineage with the highest Del/Ins ratio was the ancestral rodent branch, with a value of 2.4. The rat and macaque also showed a clear mutational bias favoring deletions, though it was more moderate, being 1.39 and 1.32, respectively, whereas human and mouse showed little or no bias. Surprisingly, in the ancestral primate branch the opposite bias was observed, with insertions being more frequent than deletions (Del/Ins, 0.82).
Table 1.
Insertions and deletions in ancestral repeats (ARs) and coding sequences (CDSs)
Deletions are better tolerated than insertions in coding sequences
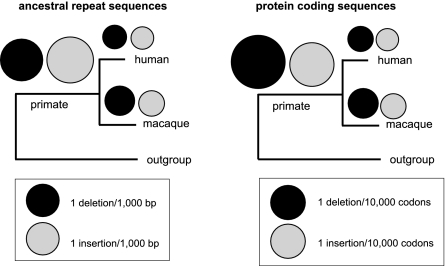
By using the same methodology as described above, we identified amino acid indels (length 1–10) in a set of 5991 one-to-one orthologous coding sequences from the same five species. The majority of indel events (60%–74%, depending on branch) were one amino acid in length, with an approximately exponential decrease in frequency with increasing length. In contrast to the observations for ancestral repeats, deletions in coding sequences outnumbered insertions in all six branches (Table 1). In the primate ancestral branch, which had the strongest contrast, Del/Ins was 1.48 in coding sequences, nearly double the 0.82 ratio observed in ancestral repeats (Fig. 2). This suggests that insertions are less well tolerated than deletions in coding sequences, compared with the “neutral” mutational bias. Similar results were obtained when we varied the phylogenetic tree employed by Prank+F or when we used a different outgroup species (Supplemental Table 5).
Figure 2.
Comparison between the number of insertions and deletions in ancestral repeats and coding sequences in primate branches. Events estimated from Prank+F alignments using parsimonious criteria. Note that a different scale is used in each case. The deletion-to-insertion ratio increased in coding sequences for all three branches. For a similar comparison for the rodent branches, please refer to Table 1.
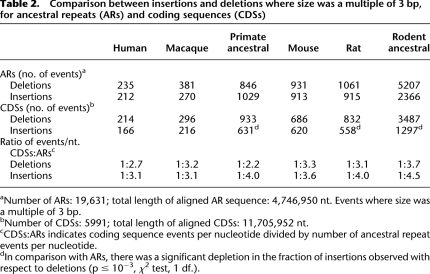
How strong is selection in eliminating indel mutations from coding sequences? To discard the effect of frame-disrupting mutations, we compared all events that had a length that was a multiple of 3 bp in ancestral repeats and coding sequences (Table 2). Overall, there were 3.3 times more deletions and four times more insertions in ancestral repeats than in coding sequences, further suggesting that in proteins insertions are more often deleterious than deletions. The difference is particularly striking in the primate ancestral branch, where only one in every four insertions was accepted on average, in comparison with one in every 2.2 deletions. In the rodents the constraints were stronger for both types of mutation, with only one in 4.5 insertions and one in 3.7 deletions being accepted on average.
Table 2.
Comparison between insertions and deletions where size was a multiple of 3 bp, for ancestral repeats (ARs) and coding sequences (CDSs)
Estimated net sequence loss in the ancestral rodent branch
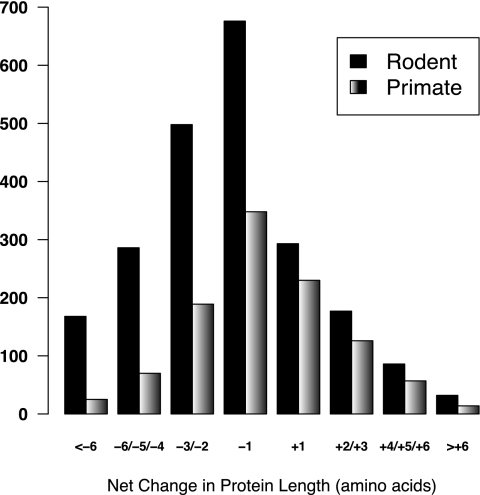
Over time a bias in the accumulation of indels may result in a reduction (through an excess of deletions) or an increase (through an excess of insertions) in genome size. This was especially relevant in the case of the rodent ancestral branch, where the net loss of DNA equated to ∼2.5% of the syntenic noncoding sequence analyzed. In protein sequences, which have a much lower number of indels due to negative selection, the net loss of amino acid sequence in the rodent ancestral branch was, on average, 1.12 amino acids per 1000 amino acids. Figure 3 shows the excess of amino acid sequence loss in the rodent branch compared with the primate branch. An extreme case is the insulinoma-associated protein 2, a marker for the imminent onset of type 1 diabetes (De Grijse et al. 2010), in which a series of deletions in an ancestral rodent have resulted in the protein being ∼10% shorter in rodents than in primates (Supplemental Fig. 1).
Figure 3.
Increased protein sequence loss in the rodent branch. Negative values indicate net sequence loss; positive values, net sequence gain. Cases in which there were no insertions or deletions, or in which they balanced out, are not included. The other branches produced a similar graph to that of the primate branch.
Sequence context of indels in protein sequences
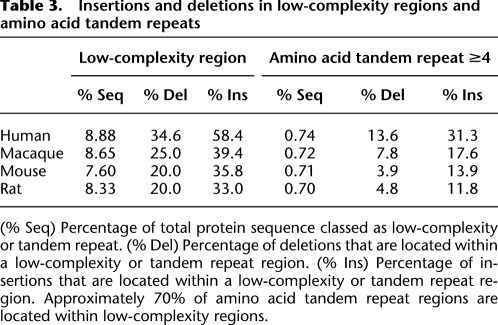
Indels in coding sequences are an important source of genetic variation and may result in the modification of the structure or function of the protein. Therefore we inspected the sequence context in which indels occurred, as well as any association with protein function. We found that both low-complexity regions and amino acid tandem repeats were markedly enriched in indels (Table 3). Overall, low complexity regions showed about 2.5-fold to fourfold enrichment for deletions and fourfold to 6.5-fold enrichment for insertions. The greatest enrichment was found in the human branch, in which 34.6% of deletions and 58.4% of insertions were located in regions of low complexity. Enrichment in regions of amino acid tandem repeats was even further marked, ranging from about 5.5- to 18-fold for deletions and 17- to 42-fold for insertions, confirming the prominent role that replication slippage has in the generation of indels in proteins.
Table 3.
Insertions and deletions in low-complexity regions and amino acid tandem repeats
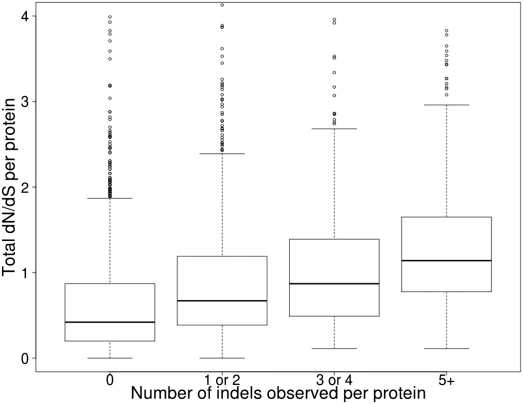
Taking the ratio of nonsynonymous to synonymous substitutions (dN/dS) as proxy for selective pressure, we investigated whether there was any relationship between dN/dS and the presence or absence of an indel in a particular protein. This analysis was performed on a reduced data set of 3126 protein alignments that had passed stringent filters to avoid dN/dS overestimation (Methods). This data set remained very similar in terms of the distribution of indels to the complete 5991 orthologous protein data set (Supplemental Table 6). Proteins that have incorporated at least one indel event have significantly higher dN/dS than do proteins with no indel events, indicating that they are evolving more rapidly (Fig. 2; Supplemental Table 7). In addition, a positive relationship was observed between increasing numbers of indels per protein and total dN/dS, indicating that there is a significant correlation between the number of observed indel events and the rate of protein evolution (Fig. 4). A similarly significant correlation was found for both insertions (rho = 0.22) and deletions (rho = 0.33) when examined independently.
Figure 4.
Positive relationship between nonsynonymous-to-synonymous substitution (dN/dS) ratio and number of indels in coding sequences. Box-plot representation of dN/dS versus number of indel events. The y-axis is the sum of the dN/dS for all branches for a particular protein. The x-axis is the total number of indels observed in all branches for a particular protein. The area within the box contains 50% of the data; the horizontal line is the median; outliers (5%) are represented as small circles. Each category is significantly different from each of the others (P ≪ 0.0001, Wilcoxon rank sum test). Spearman's rank correlation rho = 0.34 (P ≪ 0.0001).
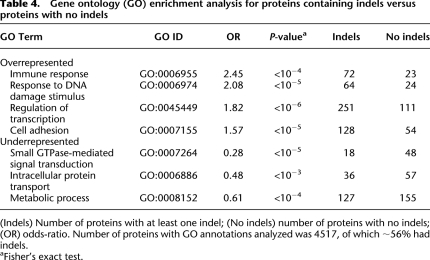
In order to examine whether there was a relationship between protein function and the occurrence of indels, we undertook a Gene Ontology (GO) enrichment analysis. We found that proteins that were classified as being involved in the regulation of transcription, response to DNA damage stimulus, and immune response were from 1.8- to 2.5-fold overrepresented in the indel-containing group, whereas proteins involved in metabolic processes, intracellular protein transport, and small GTPase-mediated signal transduction were from 1.6- to 3.5-fold underrepresented in the indel-containing group (Table 4).
Table 4.
Gene ontology (GO) enrichment analysis for proteins containing indels versus proteins with no indels
Discussion
The idea that mammalian genomes accumulate more small deletions than small insertions (deletional bias) has become widely accepted, having been reported in a number of studies. For example, an early study of 156 pseudogenes from humans and murids identified a total of 441 deletions and 161 insertions (Ophir and Graur 1997). In agreement, subsequent analysis of a large number of syntenic genomic sequences from human, mouse and rat found that deletions were about two to three times more frequent than insertions in all branches analyzed (Gibbs et al. 2004). We have reexamined this question using a relatively novel multiple alignment algorithm, Prank+F, which was developed specifically to minimize the problem of overalignment and prevent the underestimation of insertions typically observed when using other multiple alignment algorithms (Loytynoja and Goldman 2005, 2008). MSA is rarely a perfect process, and thus it is likely that there are still some incorrectly defined indels in this study. However, we believe that the Prank algorithm gives a more accurate view of reality in this data set than do other multiple alignment algorithms. Of the six branches analyzed here, we only observed a high Del/Ins bias (Del/Ins of 2.4) in the rodent ancestral branch, the remaining branches having a Del/Ins between 0.82 and 1.39. Very similar results were obtained with a set of 746 3′ UTR sequences, supporting the robustness and generality of our observations (Supplemental Table 8).
What explains such differences? The fact that Prank+F better identifies lineage-specific insertions is probably the main contributor. When we built multiple alignments with other programs, such as MAFFT and ClustalW, we systematically obtained a much lower number of insertions than with Prank+F in both ancestral repeat and coding sequences (Supplemental Tables 2, 3). Only for the rodent ancestral branch are our findings similar to those reported by Gibbs et al. (2004). This is consistent with the fact that events in the rodent ancestral branch are supported by two sequences (mouse and rat) instead of one and thus are expected to be more robust to the choice of multiple alignment program.
One major concern we had when we started this study was preventing the alignment of nonhomologous protein regions, due, for example, to the inclusion of incorrectly annotated exons or the use of partially annotated genes, as this would result in an increase in the number of false positives and would make comparisons between branches less reliable. For this reason we applied several prealignment and post-alignment filters. The first set of filters included the removal of orthologous sets in which the length difference between the shortest and the longest protein was >50% of the length of the longest protein, and sets for which there was no concordance in the identification of one-to-one orthologs in two different Ensembl versions (49 and 55). The second set of filters, implemented once we had the alignments, included the removal of indel events adjacent to exon boundaries and of indels located in areas of the alignment where exon identity was <50%. Whereas the later set of filters was based on the identification of problematic regions in the alignments, the first set was based on a priori assumptions about when a sequence set was to be trusted, and was thus more debatable. We observed that removal of prealignment filters provided similar results in relation to the deletion/insertion ratios as with the use of the filters (Supplemental Table 9). However, in doing so the relationship between the number of indel events per protein between the macaque and the human branches suspiciously increased (from 1.35 to 1.53). As the macaque is by far the species with the most incorrectly annotated genes among those considered here, the results indicate that using filters in the prealignment phase is likely to provide more reliable results without introducing any significant biases in relation to the Del/Ins ratio.
Another possible source of error in our indel estimation is the quality of the underlying genomic sequence and annotation. Low genomic sequence coverage may result in sequence errors that artificially inflate the number of indels, especially if the genomes compared are very close and contain relatively few differences (Meader et al. 2010). Of the genomes considered here, sequence quality scores are only available for the macaque and cow, the genomes of the other species being considered close to finished. Of these two species, the macaque sequence appears to be of lower quality, as exemplified by the fact that 11% of macaque exons investigated here had at least 1 nucleotide (nt) with a quality score of less than 40 (equivalent to one error per 10,000 nt), whereas the equivalent figure in the cow was just 5%. A total of 42 (8%) of the coding indels observed in the macaque lineage fall in regions of low-quality sequence (quality score, <40). However, in 18 (42%) of these cases, the lowest quality score for a nucleotide in the region surrounding the event was still greater than 30 (equivalent to one error per 1000 nt), and thus they are not necessarily all false positives. Importantly, insertions and deletions are affected similarly, and our general conclusions should not be affected.
What is causing the deletional bias in the rodent ancestral branch? A strong bias is observed both in transcribed (coding, 3′ UTR) and nontranscribed (ancestral repeat) sequences, which is not consistent with it being the result of a selective advantage associated with lowering transcriptional or translational costs. Selection for a lower cost of DNA replication is also very unlikely since the fitness gain would likely be even less than that for transcription/translation. Therefore, it may simply be a mutational bias governed by random drift. It has been proposed that organisms with smaller population sizes have larger genomes due to the accumulation of a greater number of slightly deleterious insertions (Lynch and Conery 2003). Although primates have somewhat larger genomes than do rodents (Supplemental Table 10) and have smaller population sizes, we did not observe a systematic tendency leading to the accumulation of more insertions than deletions in the primate branches. For example the Del/Ins ratio was slightly higher in human than in mouse. Therefore, at least for short events, such as those considered here, no such correlation is observed.
What are the consequences of the ancestral rodent deletional bias? In considering the length of indels, we estimate that, in mammalian syntenic regions, the rodent genome has shrunk by ∼2.5%, whereas the expansion of the ancestral primate genome due to the excess of insertions over deletions is an order of magnitude smaller (0.25%). Therefore, in the ancestral Euarchontoglires (the group common to primates and rodents), the size of syntenic regions would most likely have been more similar to the primate genome than to the rodent genome. Differences in the deletion mutational bias have previously been implicated in changes in genome size in different species of insects (Petrov et al. 2000). Our data correlate with the observed decrease in genome size in rodent species with respect to primate species (Waterston et al. 2002; Gibbs et al. 2004). However, this cannot explain the ∼10% difference in genome size, and therefore other processes, such as differential rate of expansion of transposable elements and accumulation of segmental duplications, are likely to have contributed more to the observed difference.
In comparing ancestral repeats with coding sequences, we conclude that the majority of indel mutations are eliminated in coding sequences, as previously reported in a comparison of human genes and pseudogenes (Chen et al. 2007). In addition, we found that insertions in coding sequence were more often eliminated than were deletions in all lineages, suggesting that they tend to be more deleterious. We also observe that the rate of tolerance of both insertions and deletions was lower in the rodent lineages than in the primate lineages (Table 2). This is similar to the lower dN/dS rate observed in the rodents with respect to the primates (Toll-Riera et al. 2010) and consistent with the larger effective population sizes of the rodent species, which results in more efficient purifying selection in this group (Kimura 1968; Ohta 1973; Nielsen et al. 2005; Axelsson and Ellegren 2009).
Sequence slippage during replication is a highly mutagenic process that can lead to rapid changes in the size of orthologous amino acid tandem repeats in otherwise highly conserved sequences from closely related mammalian species (Alba and Guigo 2004; Mularoni et al. 2008). In accordance with the results from a previous study of indels in mouse and rat coding sequences (Taylor et al. 2004), we found that a larger fraction of insertions than deletions mapped to amino acid tandem repeat regions in all species. This suggests that replication slippage is more important in the generation of insertions than deletions, contrary to the findings of Kvikstad et al. (2007). Finding a larger number of insertions than deletions in amino acid tandem repeats is consistent with previous observations that short tandem repeat tracts have a tendency to increase in length (Ellegren 2004). In concordance we observed that, in general, proteins containing amino acid tandem tracts, or low complexity regions, tended to be longer than proteins lacking these sequences (Supplemental Table 11).
A number of studies have shown that nucleotide substitution rate and indels are correlated at the genomic level (Waterston et al. 2002; Kvikstad et al. 2007; Tian et al. 2008). Here we found evidence that this correlation extends to rate of substitution and indels at the amino acid level of coding sequences. This type of observation has typically been interpreted in terms of a relaxation of selective constraints permitting both increased amino acid substitution and greater tolerance of indels in a particular protein. However in a recent article, Tian et al. (2008) found nucleotide divergence to be significantly elevated surrounding genomic indels at a distance of up to 100 nt in a wide range of taxa, suggesting that indel heterozygosity may itself be mutagenic toward surrounding sequence, thus leading to the observed association between substitutions and indels in genomic DNA sequence.
Investigation of GO terms associated with proteins that had indels found a highly significant enrichment for terms associated with regulation of transcription (Table 4). Proteins involved in transcriptional regulation are known to be rich in amino acid tandem repeat tracts (Karlin et al. 2002; Alba and Guigo 2004). However, the observed enrichment remained significant even when indels found in such tracts were discounted. This result is in accordance with previous findings for rat and mouse (Taylor et al. 2004), and for human (Chen et al. 2007), but contrary to recent work in nematodes that found that proteins associated with transcription pathways in the KEGG database had the lowest frequency of indel events (Wang et al. 2009). This suggests that at least in mammals, proteins associated with transcription appear to be under less selective pressure, perhaps allowing exploration of different functional profiles in response to varying environmental stresses. Immune response proteins have long been known to be evolving quickly (Li 1997) and were also found to be enriched in indels. As observed here, Chen et al. (2007) also reported underrepresentation of human proteins associated with metabolic processes in the indel containing group, suggesting that these proteins are under relatively strong selective pressure. These findings highlight the fact that different selective pressures in different taxa are likely to result in differences in indel tolerance in different protein families.
The study presented here has clarified the evolution of indel accumulation in different primate and rodent branches. By using the algorithm Prank+F, we have observed that, contrary to previous reports, the only branch with a marked Del/Ins mutational bias, resulting in substantial sequence shortening, is the rodent ancestral branch. It also appears that protein sequences tolerate deletions better than insertions, resulting in an increase in the Del/Ins ratio for coding sequences in all branches. Further comparative genomics studies including more species should help identify with more precision when the rodents experienced their greatest DNA loss.
Methods
Sequences
Ancestral repeats
All repeats classified as being mammalian ancestral were downloaded from RepBase Update (version 15.07) (Jurka et al. 2005) and identified in pre-repeat-masked output for the Human Genome Build 19 (February 2009), obtained from RepeatMasker (http://www.repeatmasker.org). This provided the coordinates for 106,749 ancestral repeat regions in the human genome, which were mapped to syntenic regions in the other four species using the 28-way vertebrate alignment track of the UCSC Genome Browser (Miller et al. 2007) via Galaxy (Goecks et al. 2010).
Coding sequences
All orthologous genes designated ortholog_one2one in Ensembl release 49 (March 2008) across the five mammalian species Homo sapiens, Macaca mulatta, Mus musculus, Rattus norvegicus, and Bos taurus were identified using Ensembl BioMart (Hubbard et al. 2007). Protein sequence, cDNA sequence, and exon boundary coordinates were obtained for each gene. Following filtering and the application of quality controls, the final number of complete ortholog sets available for analysis was 5991 (for further details, see Supplemental Methods). Please refer to supplementary file for a detailed description of the filtering process.
Multiple sequence alignments
MSAs of proteins for the five species were generated using three distinct multiple-alignment algorithms; ClustalW (Thompson et al. 1994), MAFFT (Katoh et al. 2002), and Prank+F (Loytynoja and Goldman 2008). As Prank+F performs best when a phylogenetic tree with branch lengths is provided, we calculated the evolutionary distance separating the different lineages using ProML (Felsenstein 2005), on the basis of a multiple alignment of a random sample of 155 one-to-one orthologs generated by T-coffee (Notredame et al. 2000). This provided the following distance tree, (((human:0.0105, macaque:0.0231):0.0371, (mouse:0.0265, rat:0.0351):0.0771), cow:0.0720), similar to that for genomic nucleotide substitutions per site reported previously (Miller et al. 2007). Neither the use of the branch lengths quoted by Miller et al. (2007) nor the use of Monodelphis domestica as an outgroup significantly altered the number of indel events identified (Supplemental Table 5). Of the three algorithms tested, Prank+F was best at separating short regions of sequence that were nonhomologous, rather than collapsing the alignment. This was most clearly exemplified in the case of exons that are only present in one of the five protein orthologs being aligned, thereby having no orthologous counterpart with which to align in the other species. These cases were defined by the exact coincidence of gap limits to exon boundaries, Prank+F identifying many more such cases than MAFFT or ClustalW (Supplemental Table 1). In general, while the three algorithms identified approximately the same number of deletion events, ClustalW and MAFFT consistently underestimated the number of insertion events (Supplemental Tables 2, 3). Therefore the Prank+F alignments were used as the basis of all further analysis.
Identification of lineage-specific indels
The principle of parsimony was used to identify lineage-specific indels in six mammalian branches, using the orthologous cow sequence as outgroup (Fig. 5). In coding sequences, ∼2.7% of indels (181 deletions, 170 insertions) were over 10 amino acid residues in length. Upon manual inspection, it was found that approximately half of these were the result of errors in exon boundary annotations for long exons in Ensembl and were thus unlikely to represent bona fide indels (see also Supplemental Methods). Therefore we focus here only on indels of up to 10 amino acids in length. For consistency, only indels of up to 30 bp (99.2% of all indels observed) were considered in noncoding sequences. In order to compare indels in ancestral repeats and coding sequences, we also used a subset of events that had a length that was a multiple of 3 bp. For more details on this comparison, please refer to the Supplementary File.
Figure 5.
Identification of lineage-specific insertions and deletions. In this hypothetical region of an amino acid multiple alignment, there are six regions containing gaps. The regions identified by numerals below the alignment can be assigned unequivocally to a particular branch in the species tree: 111 indicates a deletion (EDD) in the ancestral rodent branch; 22, an insertion (EE) in the ancestral primate branch; 3, an insertion (F) in human; and 4, a deletion (L) in the macaque branch. The regions identified by Xs below the alignment involve at least two distinct indel events, the nature of which cannot be established with confidence; regions of this type were discounted from further analysis.
Estimation of nucleotide substitution rates
cDNA alignments corresponding to the aforementioned protein alignments were used to estimate nonsynonymous (dN) and synonymous (dS) substitution rates using the free-ratio model of CodeML (Yang 2007). Only those protein-coding sequences for which all exons showed similarity equal to, or greater than, 50% were used for the comparison of indel and nucleotide substitution rates in the different branches of the tree. This data set, named CodeML subset, was thus limited to 3126 alignments. Branch-specific nucleotide substitution rates for the 19,631 ancestral repeat MSAs were calculated using BaseML from PAML and the HKY85 substitution model (Yang 2007).
Analysis of sequence context of indels
Areas of low complexity in the proteins were identified using SEG (Wootton and Federhen 1996) with default settings. SEG was also used to identify all tandem amino acid tracts of individual amino acids of length four or longer. For more details, please refer to the Supplemental File.
GO analysis
GO classifications for each protein in the data set were obtained using the BioMart facility of Ensembl, and 4567 human proteins from the 5991 ortholog data set had GO annotations. As one-to-one orthologs already represent a biased data set with respect to the complete proteome, enrichment analysis was performed by comparing proteins in the data set that had at least one observed indel in any of the species (56%) with those that had no observed indels (44%).
Acknowledgments
We received financial support from the Generalitat de Catalunya (Formació Personal Investigador to S.L.), Ministerio de Ciencia e Innovación (Formación Personal Universitario to M.T.-R., BIO2009-08160), Fundación Javier Lamas (N.R.-T.), and Fundació Institució Catalana de Recerca i Estudis Avançats (M.M.A.).
Footnotes
[Supplemental material is available for this article.]
Article published online before print. Article, supplemental material, and publication date are at http://www.genome.org/cgi/doi/10.1101/gr.121897.111.
References
- Alba MM, Guigo R 2004. Comparative analysis of amino acid repeats in rodents and humans. Genome Res 14: 549–554 [DOI] [PMC free article] [PubMed] [Google Scholar]
- Axelsson E, Ellegren H 2009. Quantification of adaptive evolution of genes expressed in avian brain and the population size effect on the efficacy of selection. Mol Biol Evol 26: 1073–1079 [DOI] [PubMed] [Google Scholar]
- Ball EV, Stenson PD, Abeysinghe SS, Krawczak M, Cooper DN, Chuzhanova NA 2005. Microdeletions and microinsertions causing human genetic disease: common mechanisms of mutagenesis and the role of local DNA sequence complexity. Hum Mutat 26: 205–213 [DOI] [PubMed] [Google Scholar]
- Britten RJ 2002. Divergence between samples of chimpanzee and human DNA sequences is 5%, counting indels. Proc Natl Acad Sci 99: 13633–13635 [DOI] [PMC free article] [PubMed] [Google Scholar]
- Chen FC, Chen CJ, Li WH, Chuang TJ 2007. Human-specific insertions and deletions inferred from mammalian genome sequences. Genome Res 17: 16–22 [DOI] [PMC free article] [PubMed] [Google Scholar]
- Cooper GM, Brudno M, Stone EA, Dubchak I, Batzoglou S, Sidow A 2004. Characterization of evolutionary rates and constraints in three mammalian genomes. Genome Res 14: 539–548 [DOI] [PMC free article] [PubMed] [Google Scholar]
- De Grijse J, Asanghanwa M, Nouthe B, Albrecher N, Goubert P, Vermeulen I, Van Der Meeren S, Decochez K, Weets I, Keymeulen B, et al. 2010. Predictive power of screening for antibodies against insulinoma-associated protein 2 β (IA-2β) and zinc transporter-8 to select first-degree relatives of type 1 diabetic patients with risk of rapid progression to clinical onset of the disease: implications for prevention trials. Diabetologia 53: 517–524 [DOI] [PubMed] [Google Scholar]
- de Jong WW, Ryden L 1981. Causes of more frequent deletions than insertions in mutations and protein evolution. Nature 290: 157–159 [DOI] [PubMed] [Google Scholar]
- Ellegren H 2004. Microsatellites: simple sequences with complex evolution. Nat Rev Genet 5: 435–445 [DOI] [PubMed] [Google Scholar]
- Elsik CG, Tellam RL, Worley KC, Gibbs RA, Muzny DM, Weinstock GM, Adelson DL, Eichler EE, Elnitski L, Guigo R, et al. 2009. The genome sequence of taurine cattle: a window to ruminant biology and evolution. Science 324: 522–528 [DOI] [PMC free article] [PubMed] [Google Scholar]
- Felsenstein J 1989. PHYLIP - Phylogeny Inference Package (Version 3.2). Cladistics 5: 164–166 [Google Scholar]
- Fletcher W, Yang Z 2010. The effect of insertions, deletions, and alignment errors on the branch-site test of positive selection. Mol Biol Evol 27: 2257–2267 [DOI] [PubMed] [Google Scholar]
- Gibbs RA, Weinstock GM, Metzker ML, Muzny DM, Sodergren EJ, Scherer S, Scott G, Steffen D, Worley KC, Burch PE, et al. 2004. Genome sequence of the Brown Norway rat yields insights into mammalian evolution. Nature 428: 493–521 [DOI] [PubMed] [Google Scholar]
- Gibbs RA, Rogers J, Katze MG, Bumgarner R, Weinstock GM, Mardis ER, Remington KA, Strausberg RL, Venter JC, Wilson RK, et al. 2007. Evolutionary and biomedical insights from the rhesus macaque genome. Science 316: 222–234 [DOI] [PubMed] [Google Scholar]
- Goecks J, Nekrutenko A, Taylor J 2010. Galaxy: a comprehensive approach for supporting accessible, reproducible, and transparent computational research in the life sciences. Genome Biol 11: R86 doi: 10.1186/gb-2010-11-8-r86 [DOI] [PMC free article] [PubMed] [Google Scholar]
- Graur D, Shuali Y, Li WH 1989. Deletions in processed pseudogenes accumulate faster in rodents than in humans. J Mol Evol 28: 279–285 [DOI] [PubMed] [Google Scholar]
- Hubbard TJ, Aken BL, Beal K, Ballester B, Caccamo M, Chen Y, Clarke L, Coates G, Cunningham F, Cutts T, et al. 2007. Ensembl 2007. Nucleic Acids Res 35: D610–D617 [DOI] [PMC free article] [PubMed] [Google Scholar]
- Jurka J, Kapitonov VV, Pavlicek A, Klonowski P, Kohany O, Walichiewicz J 2005. Repbase Update, a database of eukaryotic repetitive elements. Cytogenet Genome Res 110: 462–467 [DOI] [PubMed] [Google Scholar]
- Karlin S, Brocchieri L, Bergman A, Mrazek J, Gentles AJ 2002. Amino acid runs in eukaryotic proteomes and disease associations. Proc Natl Acad Sci 99: 333–338 [DOI] [PMC free article] [PubMed] [Google Scholar]
- Katoh K, Misawa K, Kuma K, Miyata T 2002. MAFFT: a novel method for rapid multiple sequence alignment based on fast Fourier transform. Nucleic Acids Res 30: 3059–3066 [DOI] [PMC free article] [PubMed] [Google Scholar]
- Kimura M 1968. Evolutionary rate at the molecular level. Nature 217: 624–626 [DOI] [PubMed] [Google Scholar]
- Kuo CH, Ochman H 2009. Deletional bias across the three domains of life. Genome Biol Evol 1: 145–152 [DOI] [PMC free article] [PubMed] [Google Scholar]
- Kvikstad EM, Tyekucheva S, Chiaromonte F, Makova KD 2007. A macaque's-eye view of human insertions and deletions: differences in mechanisms. PLoS Comput Biol 3: 1772–1782 [DOI] [PMC free article] [PubMed] [Google Scholar]
- Lander ES, Linton LM, Birren B, Nusbaum C, Zody MC, Baldwin J, Devon K, Dewar K, Doyle M, FitzHugh W, et al. 2001. Initial sequencing and analysis of the human genome. Nature 409: 860–921 [DOI] [PubMed] [Google Scholar]
- Li W-H 1997. Molecular evolution. Sinauer, Sunderland, MA [Google Scholar]
- Loytynoja A, Goldman N 2005. An algorithm for progressive multiple alignment of sequences with insertions. Proc Natl Acad Sci 102: 10557–10562 [DOI] [PMC free article] [PubMed] [Google Scholar]
- Loytynoja A, Goldman N 2008. Phylogeny-aware gap placement prevents errors in sequence alignment and evolutionary analysis. Science 320: 1632–1635 [DOI] [PubMed] [Google Scholar]
- Lunter G, Ponting CP, Hein J 2006. Genome-wide identification of human functional DNA using a neutral indel model. PLoS Comput Biol 2: e5 doi: 10.1371/journal.pcbi.0020005 [DOI] [PMC free article] [PubMed] [Google Scholar]
- Lynch M, Conery JS 2003. The origins of genome complexity. Science 302: 1401–1404 [DOI] [PubMed] [Google Scholar]
- Meader S, Hillier LW, Locke D, Ponting CP, Lunter G 2010. Genome assembly quality: assessment and improvement using the neutral indel model. Genome Res 20: 675–684 [DOI] [PMC free article] [PubMed] [Google Scholar]
- Messer PW, Arndt PF 2007. The majority of recent short DNA insertions in the human genome are tandem duplications. Mol Biol Evol 24: 1190–1197 [DOI] [PubMed] [Google Scholar]
- Miller W, Rosenbloom K, Hardison RC, Hou M, Taylor J, Raney B, Burhans R, King DC, Baertsch R, Blankenberg D, et al. 2007. 28-way vertebrate alignment and conservation track in the UCSC Genome Browser. Genome Res 17: 1797–1808 [DOI] [PMC free article] [PubMed] [Google Scholar]
- Mularoni L, Toll-Riera M, Albà MM 2008. Comparative genetics of trinucleotide repeats in the human and ape genomes. In Encyclopedia of life sciences. Wiley, Chichester, UK [Google Scholar]
- Nielsen R, Bustamante C, Clark AG, Glanowski S, Sackton TB, Hubisz MJ, Fledel-Alon A, Tanenbaum DM, Civello D, White TJ, et al. 2005. A scan for positively selected genes in the genomes of humans and chimpanzees. PLoS Biol 3: e170 doi: 10.1371/journal.pbio.0030170 [DOI] [PMC free article] [PubMed] [Google Scholar]
- Notredame C, Higgins DG, Heringa J 2000. T-Coffee: A novel method for fast and accurate multiple sequence alignment. J Mol Biol 302: 205–217 [DOI] [PubMed] [Google Scholar]
- Ohta T 1973. Slightly deleterious mutant substitutions in evolution. Nature 246: 96–98 [DOI] [PubMed] [Google Scholar]
- Ophir R, Graur D 1997. Patterns and rates of indel evolution in processed pseudogenes from humans and murids. Gene 205: 191–202 [DOI] [PubMed] [Google Scholar]
- Petrov DA, Sangster TA, Johnston JS, Hartl DL, Shaw KL 2000. Evidence for DNA loss as a determinant of genome size. Science 287: 1060–1062 [DOI] [PubMed] [Google Scholar]
- Riordan JR, Rommens JM, Kerem B, Alon N, Rozmahel R, Grzelczak Z, Zielenski J, Lok S, Plavsic N, Chou JL, et al. 1989. Identification of the cystic fibrosis gene: cloning and characterization of complementary DNA. Science 245: 1066–1073 [DOI] [PubMed] [Google Scholar]
- Stenson PD, Mort M, Ball EV, Howells K, Phillips AD, Thomas NS, Cooper DN 2009. The Human Gene Mutation Database: 2008 update. Genome Med 1: 13 doi: 10.1186/gm13 [DOI] [PMC free article] [PubMed] [Google Scholar]
- Taylor MS, Ponting CP, Copley RR 2004. Occurrence and consequences of coding sequence insertions and deletions in mammalian genomes. Genome Res 14: 555–566 [DOI] [PMC free article] [PubMed] [Google Scholar]
- Thompson JD, Higgins DG, Gibson TJ 1994. CLUSTAL W: improving the sensitivity of progressive multiple sequence alignment through sequence weighting, position-specific gap penalties and weight matrix choice. Nucleic Acids Res 22: 4673–4680 [DOI] [PMC free article] [PubMed] [Google Scholar]
- Tian D, Wang Q, Zhang P, Araki H, Yang S, Kreitman M, Nagylaki T, Hudson R, Bergelson J, Chen JQ 2008. Single-nucleotide mutation rate increases close to insertions/deletions in eukaryotes. Nature 455: 105–108 [DOI] [PubMed] [Google Scholar]
- Toll-Riera M, Laurie S, Alba MM 2010. Lineage-specific variation in intensity of natural selection in mammals. Mol Biol Evol 28: 383–398 [DOI] [PubMed] [Google Scholar]
- Venter JC, Adams MD, Myers EW, Li PW, Mural RJ, Sutton GG, Smith HO, Yandell M, Evans CA, Holt RA, et al. 2001. The sequence of the human genome. Science 291: 1304–1351 [DOI] [PubMed] [Google Scholar]
- Wang Z, Martin J, Abubucker S, Yin Y, Gasser RB, Mitreva M 2009. Systematic analysis of insertions and deletions specific to nematode proteins and their proposed functional and evolutionary relevance. BMC Evol Biol 9: 23 doi: 10.1186/1471-2148-9-23 [DOI] [PMC free article] [PubMed] [Google Scholar]
- Waterston RH, Lindblad-Toh K, Birney E, Rogers J, Abril JF, Agarwal P, Agarwala R, Ainscough R, Alexandersson M, An P, et al. 2002. Initial sequencing and comparative analysis of the mouse genome. Nature 420: 520–562 [DOI] [PubMed] [Google Scholar]
- Weber JL, Wong C 1993. Mutation of human short tandem repeats. Hum Mol Genet 2: 1123–1128 [DOI] [PubMed] [Google Scholar]
- Wetterbom A, Sevov M, Cavelier L, Bergstrom TF 2006. Comparative genomic analysis of human and chimpanzee indicates a key role for indels in primate evolution. J Mol Evol 63: 682–690 [DOI] [PubMed] [Google Scholar]
- Wootton JC, Federhen S 1996. Analysis of compositionally biased regions in sequence databases. Methods Enzymol 266: 554–571 [DOI] [PubMed] [Google Scholar]
- Yang Z 2007. PAML 4: phylogenetic analysis by maximum likelihood. Mol Biol Evol 24: 1586–1591 [DOI] [PubMed] [Google Scholar]
- Zhang Z, Gerstein M 2003. Patterns of nucleotide substitution, insertion and deletion in the human genome inferred from pseudogenes. Nucleic Acids Res 31: 5338–5348 [DOI] [PMC free article] [PubMed] [Google Scholar]


