Abstract
Cancer is a disease driven by genetic variation and mutation. Exome sequencing can be utilized for discovering these variants and mutations across hundreds of tumors. Here we present an analysis tool, VarScan 2, for the detection of somatic mutations and copy number alterations (CNAs) in exome data from tumor–normal pairs. Unlike most current approaches, our algorithm reads data from both samples simultaneously; a heuristic and statistical algorithm detects sequence variants and classifies them by somatic status (germline, somatic, or LOH); while a comparison of normalized read depth delineates relative copy number changes. We apply these methods to the analysis of exome sequence data from 151 high-grade ovarian tumors characterized as part of the Cancer Genome Atlas (TCGA). We validated some 7790 somatic coding mutations, achieving 93% sensitivity and 85% precision for single nucleotide variant (SNV) detection. Exome-based CNA analysis identified 29 large-scale alterations and 619 focal events per tumor on average. As in our previous analysis of these data, we observed frequent amplification of oncogenes (e.g., CCNE1, MYC) and deletion of tumor suppressors (NF1, PTEN, and CDKN2A). We searched for additional recurrent focal CNAs using the correlation matrix diagonal segmentation (CMDS) algorithm, which identified 424 significant events affecting 582 genes. Taken together, our results demonstrate the robust performance of VarScan 2 for somatic mutation and CNA detection and shed new light on the landscape of genetic alterations in ovarian cancer.
Exome sequencing of tumor samples and matched normal controls has the potential to rapidly identify protein-altering mutations across hundreds of patients, potentially enabling the discovery of recurrent events driving tumor development and growth (International Cancer Genome Consortium 2010; Stratton 2011). Yet the analysis of such data presents significant challenges. Sequencing coverage is nonuniform across targeted regions and from one sample to the next (Ng et al. 2009; Bainbridge et al. 2010; Teer et al. 2010). Many regions achieve high read depth (more than 100×), which can confound variant callers and depth-based filters if not properly addressed (Ku et al. 2011). Repetitive and paralogous sequences can give rise to numerous false positives. The detection of somatic mutations in tumor genomes is even more challenging. The genomes of primary tumors are genetically heterogeneous (Ding et al. 2010), with frequent rearrangements (Campbell et al. 2008) and copy number alterations (CNAs) (Beroukhim et al. 2010). Further, somatic mutations are relatively rare compared with germline variation, often representing <0.1% of variants in a tumor genome (Ley et al. 2008; Mardis et al. 2009). Simply subtracting variants in the matched normal from variants in the tumor (Wei et al. 2011) is poorly suited for the analysis of exome sequence data, because it fails to account for regions that were undersampled in the normal. Accurate mutation detection requires a direct, simultaneous comparison of tumor–normal pairs at every position in the exome, but few algorithms to do so have been described.
Numerous algorithms have been developed to assess genome-wide copy number using whole-genome sequencing (WGS) data. Most of these approaches (Campbell et al. 2008; Alkan et al. 2009; Chiang et al. 2009; Yoon et al. 2009; Abyzov et al. 2011) would be confounded by exome data sets, because of the biases introduced by hybridization and the sparse and uneven coverages throughout the genome. However, when both DNA samples in a tumor–normal pair were captured and sequenced under identical hybridization conditions, we reasoned that it might be possible to detect somatic CNAs (SCNAs) as deviations from the log-ratio of sequence coverage depth within a tumor–normal pair, and then quantify the deviations statistically. Such an approach would provide a gene-centric view of copy number in a tumor sample, though it would be limited to the ∼1% of the genome captured by current exome platforms.
Previously, we published VarScan (Koboldt et al. 2009), an algorithm for variant detection in next-generation sequencing data. We have since released a new tool, VarScan 2 (http://varscan.sourceforge.net), with several improvements, including the ability to identify somatic mutation, loss of heterozygosity (LOH), and CNA events in tumor–normal pairs. VarScan 2 analyzes sequence data from a tumor sample and its corresponding normal sample simultaneously, applying heuristic methods and a statistical test to detect variants—single nucleotide variants (SNVs) and insertions/deletions (indels)—and classify them by somatic status. By direct comparison of normalized sequence depth, our method also detects SCNAs in the tumor genome.
Here, we utilize VarScan 2 for the analysis of exome sequence data from 151 patients with high-grade serous ovarian adenocarcinoma (HGS-OVCa) that were initially characterized within the Cancer Genome Atlas (TCGA) project (Cancer Genome Atlas Research Network 2011). We present a robust pipeline for the detection of both germline (inherited) and somatic (acquired) mutations by exome sequencing and describe filtering approaches for detecting variants with high sensitivity and specificity. To evaluate the performance of our SCNA detection algorithm, we compare our results to copy number data from high-density SNP array and WGS approaches. Our results demonstrate the accuracy of VarScan 2 for somatic mutation and CNA detection and enable a new survey of the genetic landscape in ovarian carcinoma.
Results
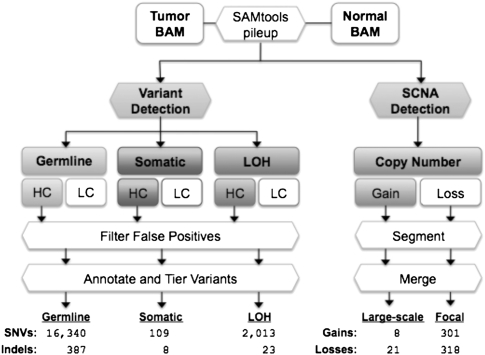
The VarScan 2 algorithm reads SAMtools pileup or mpileup output from tumor and normal samples simultaneously, performing pairwise comparisons of base calls and normalized sequence depth at each position (Fig. 1). For variant detection, a heuristic algorithm determines the genotype for normal and tumor samples independently based on adjustable minimum thresholds for coverage, base quality, variant allele frequency, and statistical significance. In single samples, the latter value is computed by Fisher's exact test of the read counts supporting each allele (reference and variant) compared to the expected distribution based on sequencing error alone. By default, VarScan 2 requires a minimum coverage of 3×, minimum phred base quality of 20, allele frequency of at least 8%, and a P-value of <0.05. Variants with a variant allele frequency of >75% are called homozygous. These represent the initially recommended parameters, and they are fully adjustable by the user.
Figure 1.
The VarScan 2 mutation and copy number alteration detection algorithms. Alignments in BAM format for a tumor–normal pair are read simultaneously to identify inherited (germline), loss-of-heterozygosity (LOH), and somatic mutation events. Variants in each category are further classified as high confidence (HC) or low confidence (LC). HC variants are filtered to remove false positives from common sequencing- and alignment-related artifacts (see Table 1). The resulting variants are annotated and organized by tier; the average number of “tier 1” coding variants per tumor is shown for each category. At positions with at least 20× coverage (default), copy number alterations are detected by comparison of Q20 read depths from matched tumor–normal pairs, normalized based on the amount of input data for each sample. Raw contiguous regions from VarScan 2 are processed by circular binary segmentation (CBS) and a subsequent merging procedure that joins adjacent segments yields a set of somatic copy number alterations, which are further classified as large-scale (>25% of chromosome arm) or focal (<25%) events. Shown are the average numbers of events detected in 142 ovarian exomes.
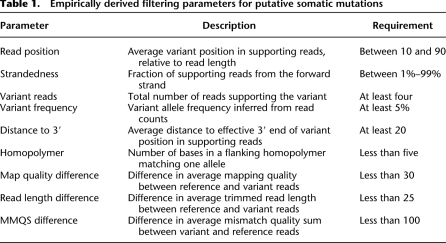
At every position where one or both samples had a variant, VarScan performs a direct comparison between tumor and normal genotypes (heuristic) and supporting read counts (Fisher's exact test) to determine the somatic status. Variants present in both samples are classified as somatic (acquired), variants heterozygous in the normal but homozygous in the tumor are classified as LOH, and variants shared between samples are classified as germline (inherited). To further refine these predictions, we developed a false-positive filter that removes likely false positives due to sequencing- or alignment-related artifacts. The filter evaluates each variant for nine empirically derived criteria to distinguish true variants from probable artifactual calls (Table 1; Supplemental Fig. 1).
Table 1.
Empirically derived filtering parameters for putative somatic mutations
To identify SCNAs, VarScan 2 compares Q20 (base quality ≥ 20) read depths between tumor and normal samples for contiguous regions of coverage. After normalizing for the amount of input data (unique bases mapped), the relative copy number change is inferred as the log2 of the ratio of tumor depth to normal depth for each contiguous region. The output of this algorithm—a set of regions, each with defined start and stop positions and a log ratio representing the copy number change in the tumor—is similar to hybridization-based copy number data and amenable to the same segmentation methods. Therefore, we apply a circular binary segmentation (CBS) algorithm (Seshan and Olshen 2010) to delineate segments by copy number and identify significant change-points. A subsequent joining procedure merged adjacent segments of similar copy number and classified them as either large-scale (>25% of chromosome arm) or focal events (see Methods).
Application to 151 ovarian cancer tumor–normal pairs
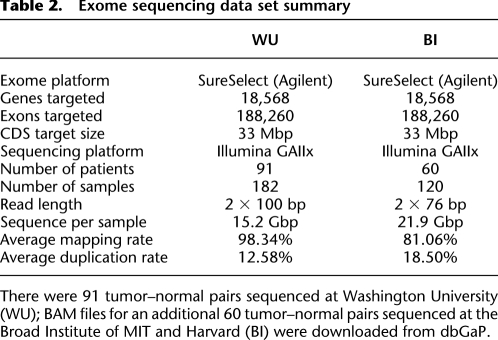
To evaluate our methods, we applied them to exome data for tumor samples and matched normals from 151 serous ovarian carcinomas that we previously characterized (Cancer Genome Atlas Research Network 2011) as part of the Cancer Genome Atlas (Table 2). On average, we identified 18,462 coding SNVs per tumor, of which 16,340 (88.5%) were germline variants, 2013 (10.9%) were LOH events, and 109 (0.59%) were somatic mutations (Fig. 1). Gapped alignments of the relatively long (76–100 bp), paired-end reads in our data set also permitted the identification of small indels ranging in size from 1–55 bp. On average, we detected 418 coding indels per exome, of which 387 (92.6%) were germline variants, 23 (5.50%) were LOH, and eight (1.91%) were somatic mutations.
Table 2.
Exome sequencing data set summary
We also applied VarScan 2 to detect SCNAs. To minimize the effect of variable coverage between tumor and normal samples, we excluded nine samples with <50% of target CDS bases covered at greater than 20-fold, and focused our analysis on 142 tumor–normal pairs with sufficient sequence coverage (Supplemental Information; Supplemental Table 1). On average across 142 patient samples, we detected 29 large-scale events (eight gains and 21 losses) and 619 focal events (301 gains and 318 losses) per tumor exome (Fig. 1; Supplemental Table 5).
Comparison of germline variants to high-density SNP array genotypes
To evaluate the performance of our mutation detection approach, we utilized orthogonal validation data from two sources. First, to evaluate the accuracy of germline variant detection, we compared VarScan 2 consensus genotypes for exome data to high-density SNP array data made available by TCGA (Cancer Genome Atlas Research Network 2011). To minimize the influence of sequence coverage, we compared only sites that achieved eightfold coverage or higher in either the tumor or matched normal sample, and examined only those within the ∼33-Mbp CDS target region. On average, each sample had 5425 germline SNPs with informative array genotypes and sufficient coverage in the exome. Genotype concordance between VarScan 2 consensus genotypes and array genotypes was 99.56% (Supplemental Information; Supplemental Fig. 2A), supporting a high accuracy for germline variant detection by VarScan 2.
To better understand concordance metrics, we investigated the 2854 discrepancies between array and exome data (Supplemental Fig. 2B). Of these, 27% of these were genotyped as reference (wild type) by array but called heterozygous (21%) or homozygous variant (6%) in the sequencing data. On average, these sites achieved high depth (206× and 129×, respectively) and variant allele frequencies (46.7% and 97.0%) by exome sequencing (Supplemental Fig. 3). This suggests that many are true variants missed by the array, possibly due to misclustering or allele dropout (Koboldt et al. 2006). Another 17% of discrepancies were heterozygous on both platforms, but the variant allele observed in sequence data was different from that reported by SNP array. An examination of these revealed that the majority (83.3%) were reverse-complementary allele combinations (e.g., G/A variant in exome data genotyped as C/T); most likely, the strand orientation reported for the SNP array genotype was incorrect. The most common discrepancy (45%) occurred at sites called heterozygous by array but homozygous variant using exome data. Some 105 of these (8.2%) had 100% variant allele frequency with 20× or more coverage and are likely true homozygotes, but roughly half of all such discrepancies (615, or 48%) had less than 20× coverage in exome data and likely reflect an allelic bias favoring the variant. We conclude that germline variants called using exome data are highly accurate (99.56%), and a significant fraction of the discrepancies can be attributed to array genotyping error or imbalanced allelic representation in the sequence data.
Finally, to investigate the portion of the exome that is callable by our method, we computed the fraction of CDS bases covered by at least 20 reads (Supplemental Table 1) in each sample. As an estimate of overall sensitivity for coding variants, we also determined the proportion of heterozygous SNPs (by array genotype) in the CDS target that were detected by VarScan 2 as germline variants, regardless of the coverage of those positions (Supplemental Fig. 4). There were nine outlier samples that achieved relatively poor CDS coverage with correspondingly poor detection of heterozygous SNPs. Excluding these, we find that, on average, 79.62% of CDS bases are covered 20× or more in each sample and that 81.42% of heterozygous SNPs are detected by VarScan 2. From these metrics, we conclude that ∼80% of coding sequences are “callable” by Agilent SureSelect exome sequencing and VarScan 2 analysis.
Orthogonal validation of somatic mutations
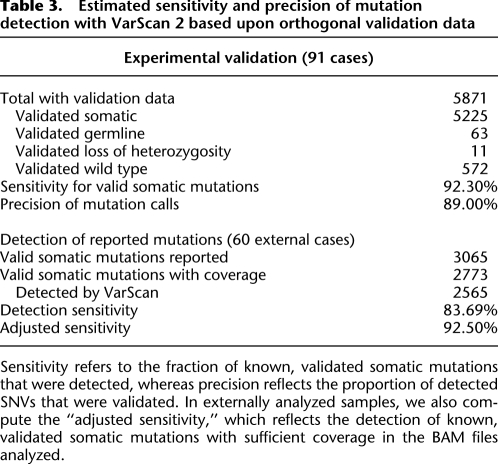
To assess the specificity of somatic mutation detection, we validated putative somatic coding SNVs by PCR and deep resequencing (Table 3). Of 5871 mutations for which we obtained validation data, 5225 (89.00%) were confirmed as true somatic mutations, 572 (9.74%) were refuted as wild type, 63 (1.07%) were germline variants, and 11 (0.19%) were due to LOH in the tumor. In general, exome sequence depth was lower and observed variant allele frequency markedly reduced among predicted SNVs that were refuted as wild type, compared with validated somatic mutations (Supplemental Fig. 5). We also attempted to validate 2458 putative mutations that were removed by the false-positive filter. Of these, 292 were confirmed as valid somatic mutations (11.88%) while 2073 (84.34%) were refuted as wild type. Thus, our filtering strategy retained 94.71% of valid mutations while removing 78.37% of false positives. We conclude that this approach dramatically increases the true-positive rate of mutation detection, with a relatively small reduction (5.3%) in overall sensitivity.
Table 3.
Estimated sensitivity and precision of mutation detection with VarScan 2 based upon orthogonal validation data
To further assess the sensitivity of mutation detection, we compared our predictions to validated somatic mutations reported for 60 tumor–normal pairs that were analyzed externally (Cancer Genome Atlas Research Network 2011). These cases harbored a total of 3065 valid somatic mutations, of which we detected 2565 (83.7%). When we investigated the 500 valid mutations missed by our approach, we found that 93 had been detected but deemed low confidence (LC), 51 were high confidence (HC) but removed by the filter, and 298 had less than fourfold coverage in one or both samples at the time the binary alignment/map (BAM) files were downloaded (Supplemental Information; Supplemental Table 2). By adjusting for uncovered sites, our approach identified 2565 of 2767 (92.70%) mutations with sufficient sequence coverage. Taken together, these results demonstrate that our approach yields high sensitivity and precision for somatic mutation detection.
We attempted to validate 141 HC somatic indels detected by VarScan 2. Of these, 85 (60.28%) were confirmed as somatic, 30 (21.28%) were refuted as wild type, and 26 (18.4%) were found to be germline or LOH events (Supplemental Table 8). There were also 80 validated somatic indels among the externally analyzed tumor–normal pairs. Some 73 had coverage in the BAM files that we downloaded; of these, 65 (89.04%) were detected as HC somatic mutations by VarScan 2. While more comprehensive evaluations are needed, these results suggest that our method detects somatic indels with high sensitivity (89%) but a moderate true-positive rate (60%).
Comparison to single-sample methods for somatic mutation detection
We next sought to demonstrate the superiority of our method, which compares tumor and normal samples simultaneously, to more simplistic approaches for somatic mutation calling. For this analysis, we selected five ovarian cancer cases for which both exome and whole-genome sequencing (WGS) data were available (marked in Supplemental Table 1). By using the exome data, we identified tumor-specific SNPs by a simple subtraction method (see Supplemental Methods), which yielded 152,708 candidate mutations per tumor (on average). In contrast, VarScan 2 detected 508 somatic mutations per tumor (on average) for the same data set (Supplemental Table 9).
Given the large number of calls generated by the subtraction method, it was possible that a significant fraction of these were valid somatic mutations that had not been part of our validation experiment. To investigate this possibility, we determined the fraction of mutations called in each set that were also detected in the WGS data by a different algorithm, named SomaticSniper (Larson et al. 2011). Of the 2538 HC mutations called by VarScan in exome data, 1716 (67.61%) were called by SomaticSniper in WGS data. In contrast, only 7353 of 763,539 calls (0.96%) made by the subtraction method were supported by SomaticSniper calls.
Next, we evaluated the sensitivity of each method to detect the known somatic mutations described above. A total of 290 validated somatic mutations had been reported for these five cases in the TCGA study. Of these, 247 (85.17%) were found by the subtraction method, while 264 (91.03%) were detected by VarScan 2 (Supplemental Table 9). Surprisingly, these results suggest that a subtraction method may also suffer slightly lower sensitivity for valid somatic mutations, possibly due to false-positive calls in the matched normal sample. We conclude that our method for somatic mutation calling delivers comparable sensitivity and dramatically higher precision, than do simple subtraction-based approaches.
Orthogonal validation of SCNAs
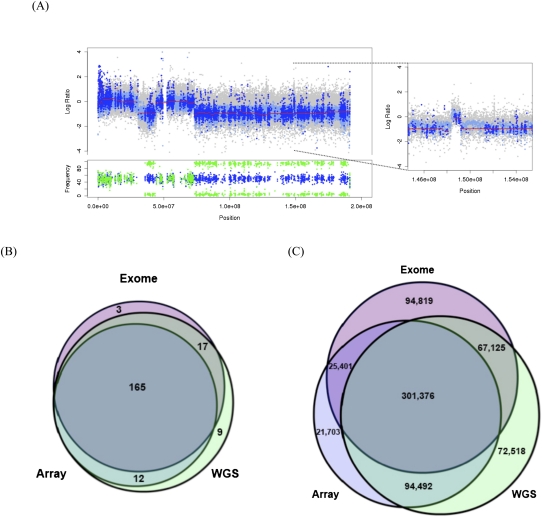
To evaluate the accuracy of SCNA detection, we compared copy number data for five ovarian tumors that were assessed by high-density SNP array, exome, and WGS (see Supplemental Methods). Strikingly, the exome-based copy number estimates from our algorithm were remarkably consistent with those of array and WGS data and demonstrated an ability to detect both large-scale and focal events (see example in Fig. 2A). A systematic comparison of these three approaches is more difficult, since both array and exome data are limited to a very small fraction of the genome (SNPs and exons, respectively); only WGS yields unbiased genome-wide copy number estimates. All three approaches, however, should be able to detect large-scale gains and losses of chromosome arms because these events typically span several megabases. Thus, we compared the overlap of large-scale events from exome, array, and WGS data sets for the five cases (Fig. 2B; Supplemental Table 3). A total of 206 large-scale CNAs were detected, of which 165 (80.10%) were detected by all three approaches, suggesting that most of these represent real events. Our exome-based method predicted 185 large-scale events (90% of the total); nearly all were supported by array or WGS data sets, and 89.2% were supported by both. A visual review of events not detected by WGS or array revealed that most were present but did not meet thresholds for calling an amplification (log2 ratio > 0.20) or deletion (log2 ratio < −0.10). In contrast, the ∼10% of large-scale events missed by our exome method were largely due to oversegmentation in sparsely targeted regions of the genome. WGS data sets yielded the most calls overall, likely reflecting a wider and more unbiased coverage of the genome.
Figure 2.
Detection of large-scale and focal copy number alterations by sequencing- and array-based approaches. (A) Deletions and focal amplifications of chromosome 4 in sample TCGA-24-1103. Copy number estimates from array (gray), WGS (light blue), and exome (dark blue) indicate two regions of deletion as well as a focal amplification (window). Red lines indicate segmented exome CBS calls. (Below) Variant allele frequencies in the normal (blue) and tumor (green) indicate regions of loss of heterozygosity (LOH) in deleted segments. (B) Intersection of large-scale copy number alterations detected by SNP array, whole-genome sequencing, and exome sequencing approaches for five HGS-OVCa cases. For details, see Supplemental Table 3. (C) Intersection of gene-level (focal) copy number alterations detected by SNP array, whole-genome sequencing, and exome sequencing approaches for five HGS-OVCa cases.
A similar comparison for focal copy number events is challenging, since exome and SNP array data sets survey different, noncontiguous portions of the genome. To address this, we performed a three-platform comparison of copy number events affecting coding sequences. At every exon, we determined a copy number status (amplification, deletion, or neutral) based upon the best-overlapping segment from SNP array, exome, or WGS copy number data sets. There were 677,434 copy-number–altered exons (about 135,000 per case) in the five cases at which we could make this comparison. Of these, 72.1% were detected by two platforms and 44.49% were detected by all three (Fig. 2C), suggesting that this comparison strategy is reasonably accurate given the different portions of the genome surveyed by each platform.
Our exome-based method detected 488,721 focal events (72.14% of the total), achieving higher sensitivity than the SNP array (65.39%) but lower than WGS (79.05%). This result is somewhat unsurprising, given the limited resolution of SNP arrays and the superior coverage breadth and uniformity offered by WGS. If we consider the intersection of events supported by both the array and WGS platforms to be a gold standard, there were 395, 868 such focal events, of which our method detected 301,376 (76.13%). There were 161,944 events (23.91%) detected by exome or WGS methods but not by SNP arrays, consistent with the expectation of limited resolution for the array platform. A significant portion of the focal events that we detected using exome data (80.60%) were supported by at least one other platform, suggesting that the majority are likely to be real events. This is particularly promising because the exome method detected a higher fraction of platform-specific calls (94,819), which are likely to include small focal copy number changes missed by other platforms.
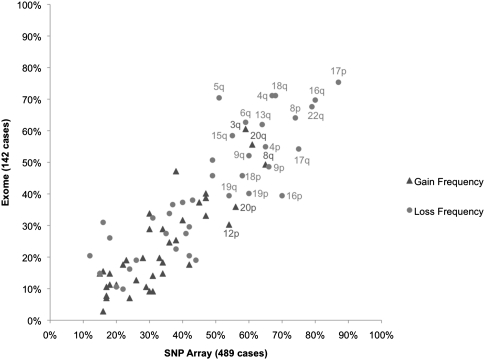
Encouraged by these results, we next compared recurrent large-scale gains and losses in the 142 exome cases included in this study to those of a larger data set (489 cases, array data) analyzed by TCGA (Cancer Genome Atlas Research Network 2011). Most of the cases we studied were part of the TCGA analysis, which identified 30 recurrent large-scale alterations (eight gains and 22 losses), all of which had been reported previously. Our method identified all recurrent gains and losses reported by TCGA (Fig. 3; Supplemental Information; Supplemental Table 4; Cancer Genome Atlas Research Network 2011). Further, the frequencies of arm-level events detected in our data set and the TCGA data set were highly correlated (r2 = 0.84 for gains, 0.86 for losses), suggesting that our exome-based approach was sufficiently robust to recapitulate the results of our previous array-based findings. Taken together, the results suggest that our method identifies somatic CNAs with an accuracy comparable to array-based and WGS approaches and that our set of 142 cases is representative of the larger cohort (n = 489) studied by TCGA.
Figure 3.
Recurrent chromosome-arm gains and losses in ovarian cancer. Eight significant gains and 22 significant losses of chromosome arms identified by TCGA in SNP array data for 489 cases were recapitulated using exome data for 142 cases. Observed frequencies were highly correlated between data sets for both gains (r2 = 0.84) and losses (r2 = 0.86).
Identification of recurrent CNAs with CMDS
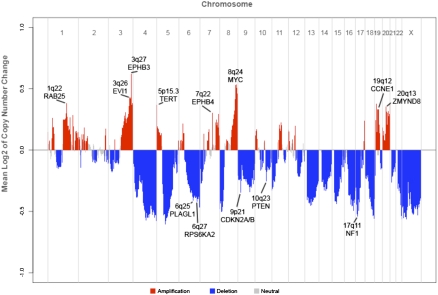
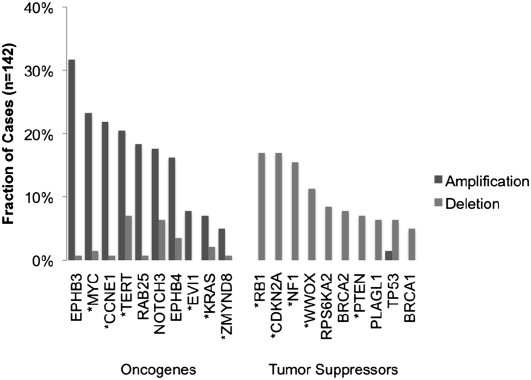
High-grade serous ovarian tumors possess highly rearranged genomes, owing in part to defects in homologous recombination pathways (Patel et al. 1998; Xu et al. 1999; Bowtell 2010; Cancer Genome Atlas Research Network 2011). Genetic alterations that promote carcinogenesis, e.g., the amplification of oncogenes and deletion of tumor-suppressor genes, are likely to be recurrent across multiple tumors. Indeed, when we analyzed the mean copy number change across 142 cases genome-wide (Fig. 4), we observed a striking pattern of recurrent copy number events. Many of these correspond to large-scale gains and losses shown in Figure 3. Focal amplifications and deletions are also apparent; the majority of these have already been reported in ovarian cancer (Cancer Genome Atlas Research Network 2011). Notable examples include amplifications MYC, CCNE1, and EVI1 (also called MECOM), as well as deletions of tumor suppressors NF1, PTEN, and CDKN2A/CDKN2B (Fig. 5).
Figure 4.
Global copy number alteration profile of ovarian cancer. Average log2 of copy number difference is plotted for chromosomes 1–22 and X. Amplifications are shown in red, deletions in blue, and neutral regions in gray. Significant peaks associated with known oncogenes or tumor suppressor genes are indicated.
Figure 5.
Frequent copy number alteration of ovarian cancer genes. Exome-based copy number estimates were used to compute the proportion of ovarian cancer tumors (n = 142) exhibiting amplification or deletion of key ovarian cancer genes. Asterisks (*) indicate significantly altered genes identified from SNP array data in our previous study.
Intriguingly, we also observed tight focal amplifications of EPH receptors EPHB3 (3q27) and EPHB4 (7q22) (Figs. 4, 5), which are known to be overexpressed in ovarian carcinoma (Alam et al. 2008) but were not significant in SNP array data for 489 cases analyzed by TCGA. We reasoned that the high-resolution, exome-centric nature of our data set might enable identification of new recurrent CNAs (RCNAs) in ovarian cancer. To identify such regions, we applied the correlation matrix diagonal segmentation (CMDS) algorithm (Zhang et al. 2010) to segmented exome-based copy number data for 142 cases. CMDS employs a population-based approach to identify statistically significant RCNAs and is particularly sensitive for focal events. Our analysis identified 424 significant focal RCNAs targeting 582 known genes (Supplemental Table 6). Gene set analysis of these 582 genes revealed 10 significantly enriched pathways (P < 0.0005) (Supplemental Table 7). Focal adhesion (23 genes, P = 1.22 × 10⁻¹³) and ECM–receptor interaction (15 genes, P = 7.87 × 10⁻¹²) were the most significant pathways, suggesting that cell–cell and cell–matrix adhesion molecules are often dysregulated in high-grade ovarian carcinoma.
Discussion
In summary, we have developed an approach for simultaneous detection of germline variants, somatic mutations, LOH, and SCNAs using exome sequence data from matched tumor and normal samples. Unlike other methods for mutation detection, our algorithm reads data from tumor and normal samples simultaneously, enabling direct pairwise comparisons of base calls at each position. For germline variant detection, we observed a high genotype concordance (99.56%) between the VarScan results and high-density SNP arrays, with a significant fraction of discordant sites attributed to imbalanced allelic representation or errors in the array data.
For somatic mutation detection, we demonstrated that our method provides similar sensitivity and a dramatically higher true-positive rate compared with more simplistic approaches that analyze tumor and normal samples independently. We also demonstrated that our filtering strategy removes the vast majority of false positives due to sequencing or alignment artifacts, while preserving sensitivity for true mutations. Indeed, in exome sequence data for 151 ovarian tumors characterized by TCGA, our approach identified 5225 valid somatic mutations with 94.71% sensitivity and a 89.00% true-positive rate. We observed a comparable sensitivity (89%) and a moderate true-positive rate (60%) for validated somatic indels, though the number of such variants in our data set (158) was relatively small. It should also be noted that our method detects indels based upon gapped Smith-Waterman alignments and will miss larger events that cannot be spanned by a single read.
By evaluating tumor and normal samples simultaneously using heuristics and a Fisher's exact test, the VarScan 2 algorithm offers some key advantages for mutation detection in cancer. First, it exploits the digital nature of massively parallel sequence data to detect small but significant differences between normal and tumor samples. This capability is especially important for studies of human cancers, as tumor samples are often genetically heterogeneous (Ding et al. 2010), while matched normals may contain DNA from malignant cells, particularly among patients with liquid tumors (Ley et al. 2008; Mardis et al. 2009).
We also described a novel method for detecting SCNAs using exome data and undertook a number of analyses to demonstrate its accuracy. First, in five ovarian cancer cases, we compared the results of our method to those of both SNP array and WGS platforms. These comparisons demonstrated that 95% of large-scale events and 80% of focal events identified by our approach are supported by an orthogonal platform. For focal CNAs of coding sequences, the sensitivity of our method (72%) was higher than that of SNP arrays (65%) but lower than that of WGS (79%). Second, we compared RCNAs in our data set of 142 cases to the results of our previous study (Cancer Genome Atlas Research Network 2011). We identified all recurrent large-scale CNAs initially reported for these samples (using array data for 489 cases), with frequencies that were highly correlated (r2 = 0.84 for gains, 0.86 for losses). We also confirmed frequent focal copy number perturbations of known ovarian cancer genes (e.g., gains of MYC, RAB25, and CCNE1 and losses of NF1, CDKN2A/B, and PTEN) consistent with both our previous findings and results reported by other studies using different methods (Bast et al. 2009). Further, we identified new putative focal amplifications (EPHB3 and EPHB4) that had not been significant in our previous analysis but are known to be overexpressed in ovarian tumors (Alam et al. 2008). Overexpression of EPHB4 in particular has been implicated in numerous cancers; in ovarian cancer, it is significantly associated with advanced disease and correlates with poor outcome (Kumar et al. 2007). While these findings have not been validated by orthogonal approaches, they illustrate the potential for our method to generate new hypotheses of events that may be driving carcinogenesis.
By use of the CMDS algorithm, we identified 424 significant focal RCNAs containing some 582 genes. Gene set analysis identified focal adhesion and ECM–receptor interaction as significantly altered pathways. These findings are consistent with current knowledge of ovarian carcinoma and other epithelial cancers, in which dysregulation of cell–cell and cell–matrix signaling represents a key step in tumor development, growth, and invasion. Taken together, these results suggest that our method for exome-based CNA detection both confirms and extends the results of traditional approaches.
Importantly, the samples studied here all were processed using similar hybrid capture protocols (Agilent SureSelect) and were sequenced on the same platform (Illumina GAIIx). By comparing samples from the same individual sequenced under identical conditions, our approach to CNA detection avoids GC content and mapping biases that complicate traditional sequence-based methods. However, the CNA calling could be confounded by paired samples that were sequenced under different conditions or on different sequencing platforms. Further, although we normalized for data input (unique bases mapped), it is possible that fluctuations in capture specificity and/or sequence representation could influence sequence depth between sample pairs, which might affect our results. One possible strategy to address this would be to normalize for unique on target bases (i.e., capture specificity) using the results of coverage reporting software such as RefCov (T. Wylie and J. Walker, http://gmt.genome.wustl.edu/gmt-refcov/current). Discordant read-pairs may also offer a source of supporting evidence for CNAs caused by structural variation (SV). We are currently evaluating both strategies to improve sensitivity and specificity.
Exome sequencing has the potential to rapidly screen the coding regions of tumor samples for somatic alterations. The analysis methods described here will help realize that potential by enabling the simultaneous identification of germline variants, mutations, and SCNAs in matched tumor–normal pairs. By design, an exome sequencing strategy prioritizes protein-altering mutations, which are not only easier to interpret in the context of pathways and biological processes but may encode “druggable” targets. It is important to realize, however, that exome sequencing surveys only ∼1% of the tumor genome. This strategy will miss many noncoding mutations, as well as larger events (e.g., SV) that may contribute to tumor development and progression. Ultimately, WGS will be required to identify the full spectrum of somatic alterations in tumor genomes.
Methods
Mutation detection algorithm
Given pileup input for a tumor sample and matched normal control, the mutation detection algorithm performs several steps at each position. First, it determines if both samples meet the minimum coverage requirement (by default, three reads with base quality ≥20) and determines a genotype for each sample individually based upon the read bases observed. By default, a variant allele must be supported by at least two independent reads and at least 8% of all reads. If no variant allele meets the criteria, the position is called wild type (homozygous reference) in that sample. If multiple variant alleles are observed, the most-supported (by read count, and then by base quality) variant allele is chosen. Variants are called homozygous if supported by 75% or more of all reads at a position; otherwise they are called heterozygous. Positions where neither sample is determined to be variant are excluded unless the –validation flag is set to 1. Next, at positions where one or both samples have a variant, the algorithm performs a direct comparison between normal and tumor as follows.
If the genotypes do not match, then their read counts are evaluated by one-tailed Fisher's exact test in a two-by-two table (see Supplemental Fig. 6), comparing the number of reference-supporting reads (outcome 1) and variant-supporting reads (outcome 2) observed in tumor (category 1) to the numbers that were observed in normal (category 2). If the resulting P-value meets the significance threshold (default 0.10), then the variant is called somatic (if the normal matches the reference) or LOH (if the normal is heterozygous). If the difference does not meet the significance threshold, the variant is called germline and processed as described below.
If the genotypes match, the variant is called germline. The variant P-value is computed by one-tailed Fisher's exact test (FET) in a two-by-two table, comparing the total number of reference-supporting reads and the total number of variant supporting reads (normal and tumor values are combined) to the expected distribution for a nonvariant position due to sequencing error (0.01%). For example, the expected read distribution for a nonvariant position with 500× coverage in each sample would be 999 reference-supporting reads, and one variant-supporting read due to sequencing error.
Germline, LOH, and somatic mutations are further categorized as HC or LC by the VarScan processSomatic command. By default, somatic mutations are deemed HC if the variant allele frequency is at least 10% in tumor, <5% in normal, and the FET P-value is less than 0.07. Germline variants are deemed HC if they have at least 10% variant allele frequency in both normal and tumor samples. LOH variants are deemed HC if the variant allele frequency is at least 10% in the normal sample and the FET P-value is less than 0.07. Any variant not meeting the HC criteria is deemed LC. Positions that are homozygous in normal but heterozygous in tumor (gain of heterozygosity) or where the variant allele is not the same (e.g., a SNP and an indel) are presumed to be sequencing/alignment artifacts and are discarded.
CNA detection algorithm
Given pileup input for a tumor sample and matched normal, the CNA detection algorithm first determines that at least one of the samples meets the minimum coverage requirement. To reduce noise from spurious differences at low coverage, the default setting for this parameter (20) is higher than that of mutation detection. Next, the algorithm computes the depth of high-quality bases (phred base quality ≥20) individually for tumor and normal samples. These depths are recorded for each consecutive position until (1) a gap in minimum coverage is encountered, (2) the end of the chromosome is reached, or (3) the ratio of tumor depth to normal depth changes significantly, as computed by Fisher's exact test. For each contiguous region, the relative copy number change (C) in the tumor is inferred as the log base 2 of the normalized depth ratio:
Here DT is the average tumor depth, DN is the average normal depth, IN is the number of uniquely mapped bases in the normal BAM, and IT is the number of uniquely mapped bases in the tumor BAM. The number of uniquely mapped bases is computed using SAMtools flagstat information for each BAM file, specifically as
where RM is the number of reads mapped, Dup is the proportion of mapped reads marked as duplicates, and L is the average read length. Raw copy number regions with chromosome, start position, stop position, and log2 value underwent CBS in the DNAcopy package (Seshan and Olshen 2010) to produce segmented calls delineated by significant change-points of at least three standard deviations (Supplemental Methods). Adjacent segments of similar copy number from the CBS algorithm were merged by an internally developed Perl script (MergeSegments), and classified by size. Events encompassing >25% of a chromosome arm were classified as large-scale; all others were considered focal events.
Software implementation
The VarScan 2 core software was developed in Java; the false-positive filter was implemented in Perl. Binary executables, scripts, and source code are free for noncommercial use and available at http://varscan.sourceforge.net. The false-positive filter requires the bam-readcount utility (D. Larson et al., https://github.com/genome/bam-readcount), which is written and compiled in C.
Ovarian cancer data
The ovarian cancer data set, including exome sequence data, SNP array data, and validated somatic mutations, was generated and published by the Cancer Genome Atlas Research Network (Cancer Genome Atlas Research Network 2011). The WGS data for the five cases utilized in the cross-platform copy number comparison will be described in a separate publication. Exome and WGS sequence data are available in BAM format at the dbGaP database (http://www.ncbi.nlm.nih.gov/gap). Identifiers for samples in this study are in Supplemental Table 1.
Mutations were called in exome data for 151 tumor–normal pairs by the VarScan somatic command with the following parameters: –min-coverage 4,–min-var-freq 0.08,–p-value 0.05,–strand-filter 1–min-avg-qual 20. HC mutations were filtered to remove false positives using the criteria described in Table 1 (see Supplemental Methods). Filter-passed somatic mutations were annotated using gene structure and UCSC (Karolchik et al. 2003) annotation information, assigning each mutation to one of four tiers as previously described (Ley et al. 2008; Mardis et al. 2009). Only tier 1 mutations, which alter coding sequence (nonsynonymous, synonymous, splice site, or noncoding RNA), were reported in Figure 1 or selected for orthogonal validation. CNAs were called in exome data for 142 tumor–normal pairs (nine poor-coverage tumors were excluded) by the VarScan copynumber command with the following parameters: –min-coverage 20–min-region-size 100. Raw CNA calls underwent CBS and a subsequent merging procedure as described in Supplemental Methods.
RCNA identification, annotation, and pathway analysis
The CMDS algorithm (Zhang et al. 2010) was applied to identify regions of statistically significant RCNAs. For each tumor sample, the merged segmented copy number events (see Supplemental Methods) were cross-referenced with the coordinates of about 200,000 protein-coding exons to obtain the mean log2 of copy number change for the start position and stop position of each exon. CMDS was configured to run with a minimum of 20 markers (exon starts or stops), corresponding to roughly one region tested per gene. Regions meeting the significance threshold (P < 0.0001) were merged if within 100 kb of one another, yielding a set of 520 candidate RCNA regions. These were visually reviewed to identify target genes, and remove peaks encompassing six or more unrelated genes, as the target of these nonfocal events was unclear.
The cytoBand.txt and refGene.txt files from the UCSC Genome Browser Database (Karolchik et al. 2003) version hg18 were used to annotate CNA events with cytogenetic band and RefSeq gene information, respectively, using a customized Perl script. Information on specific genes from the RefSeq and KEGG databases was retrieved using GeneCards (Safran et al. 2002) version 3.0. Pathway-based analysis of 582 RCNA genes was performed using KEGG and GO database information using WebGestalt Gene Set Analysis Toolkit version 2.0 (http://bioinfo.vanderbilt.edu/webgestalt/) with the default settings (hypergeometric test, BH correction, at least two genes per category).
Acknowledgments
We thank Heather Schmidt and Joelle Veizer for extensive manual review of predicted mutations, John Wallis for insightful comments on the manuscript, and Mike Wendl for statistical discussions. We also thank the medical genomics, analysis pipeline, and technology development groups of the Genome Institute at Washington University in St. Louis, as well as the members of the Cancer Genome Atlas research consortium, for their support.
Footnotes
[Supplemental material is available for this article.]
Article published online before print. Article, supplemental material, and publication date are at http://www.genome.org/cgi/doi/10.1101/gr.129684.111.
References
- Abyzov A, Urban AE, Snyder M, Gerstein M 2011. CNVnator: An approach to discover, genotype, and characterize typical and atypical CNVs from family and population genome sequencing. Genome Res 21: 974–984 [DOI] [PMC free article] [PubMed] [Google Scholar]
- Alam SM, Fujimoto J, Jahan I, Sato E, Tamaya T 2008. Coexpression of EphB4 and ephrinB2 in tumour advancement of ovarian cancers. Br J Cancer 98: 845–851 [DOI] [PMC free article] [PubMed] [Google Scholar]
- Alkan C, Kidd JM, Marques-Bonet T, Aksay G, Antonacci F, Hormozdiari F, Kitzman JO, Baker C, Malig M, Mutlu O, et al. 2009. Personalized copy number and segmental duplication maps using next-generation sequencing. Nat Genet 41: 1061–1067 [DOI] [PMC free article] [PubMed] [Google Scholar]
- Bainbridge MN, Wang M, Burgess DL, Kovar C, Rodesch MJ, D'Ascenzo M, Kitzman J, Wu YQ, Newsham I, Richmond TA, et al. 2010. Whole exome capture in solution with 3 Gbp of data. Genome Biol 11: R62 doi: 10.1186/gb-2010-11-6-r62 [DOI] [PMC free article] [PubMed] [Google Scholar]
- Bast RC Jr, Hennessy B, Mills GB 2009. The biology of ovarian cancer: new opportunities for translation. Nat Rev Cancer 9: 415–428 [DOI] [PMC free article] [PubMed] [Google Scholar]
- Beroukhim R, Mermel CH, Porter D, Wei G, Raychaudhuri S, Donovan J, Barretina J, Boehm JS, Dobson J, Urashima M, et al. 2010. The landscape of somatic copy-number alteration across human cancers. Nature 463: 899–905 [DOI] [PMC free article] [PubMed] [Google Scholar]
- Bowtell DD 2010. The genesis and evolution of high-grade serous ovarian cancer. Nat Rev Cancer 10: 803–808 [DOI] [PubMed] [Google Scholar]
- Campbell PJ, Stephens PJ, Pleasance ED, O'Meara S, Li H, Santarius T, Stebbings LA, Leroy C, Edkins S, Hardy C, et al. 2008. Identification of somatically acquired rearrangements in cancer using genome-wide massively parallel paired-end sequencing. Nat Genet 40: 722–729 [DOI] [PMC free article] [PubMed] [Google Scholar]
- Cancer Genome Atlas Research Network 2011. Integrated genomic analyses of ovarian carcinoma. Nature 474: 609–615 [DOI] [PMC free article] [PubMed] [Google Scholar]
- Chiang DY, Getz G, Jaffe DB, O'Kelly MJ, Zhao X, Carter SL, Russ C, Nusbaum C, Meyerson M, Lander ES 2009. High-resolution mapping of copy-number alterations with massively parallel sequencing. Nat Methods 6: 99–103 [DOI] [PMC free article] [PubMed] [Google Scholar]
- Ding L, Ellis MJ, Li S, Larson DE, Chen K, Wallis JW, Harris CC, McLellan MD, Fulton RS, Fulton LL, et al. 2010. Genome remodelling in a basal-like breast cancer metastasis and xenograft. Nature 464: 999–1005 [DOI] [PMC free article] [PubMed] [Google Scholar]
- International Cancer Genome Consortium 2010. International network of cancer genome projects. Nature 464: 993–998 [DOI] [PMC free article] [PubMed] [Google Scholar]
- Karolchik D, Baertsch R, Diekhans M, Furey TS, Hinrichs A, Lu YT, Roskin KM, Schwartz M, Sugnet CW, Thomas DJ, et al. 2003. The UCSC Genome Browser Database. Nucleic Acids Res 31: 51–54 [DOI] [PMC free article] [PubMed] [Google Scholar]
- Koboldt DC, Miller RD, Kwok PY 2006. Distribution of human SNPs and its effect on high-throughput genotyping. Hum Mutat 27: 249–254 [DOI] [PMC free article] [PubMed] [Google Scholar]
- Koboldt DC, Chen K, Wylie T, Larson DE, McLellan MD, Mardis ER, Weinstock GM, Wilson RK, Ding L 2009. VarScan: Variant detection in massively parallel sequencing of individual and pooled samples. Bioinformatics 25: 2283–2285 [DOI] [PMC free article] [PubMed] [Google Scholar]
- Ku CS, Naidoo N, Pawitan Y 2011. Revisiting Mendelian disorders through exome sequencing. Hum Genet 129: 351–370 [DOI] [PubMed] [Google Scholar]
- Kumar SR, Masood R, Spannuth WA, Singh J, Scehnet J, Kleiber G, Jennings N, Deavers M, Krasnoperov V, Dubeau L, et al. 2007. The receptor tyrosine kinase EphB4 is overexpressed in ovarian cancer, provides survival signals and predicts poor outcome. Br J Cancer 96: 1083–1091 [DOI] [PMC free article] [PubMed] [Google Scholar]
- Larson DE, Harris CC, Chen K, Koboldt DC, Ding L, Wilson RK 2011. SomaticSniper: Identification of somatic point mutations in whole genome sequencing data. Bioinformatics (in press). doi: 10.1093/bioinformatics/btr665 [DOI] [PMC free article] [PubMed] [Google Scholar]
- Ley TJ, Mardis ER, Ding L, Fulton B, McLellan MD, Chen K, Dooling D, Dunford-Shore BH, McGrath S, Hickenbotham M, et al. 2008. DNA sequencing of a cytogenetically normal acute myeloid leukaemia genome. Nature 456: 66–72 [DOI] [PMC free article] [PubMed] [Google Scholar]
- Mardis ER, Ding L, Dooling DJ, Larson DE, McLellan MD, Chen K, Koboldt DC, Fulton RS, Delehaunty KD, McGrath SD, et al. 2009. Recurring mutations found by sequencing an acute myeloid leukemia genome. N Engl J Med 361: 1058–1066 [DOI] [PMC free article] [PubMed] [Google Scholar]
- Ng SB, Turner EH, Robertson PD, Flygare SD, Bigham AW, Lee C, Shaffer T, Wong M, Bhattacharjee A, Eichler EE, et al. 2009. Targeted capture and massively parallel sequencing of 12 human exomes. Nature 461: 272–276 [DOI] [PMC free article] [PubMed] [Google Scholar]
- Patel KJ, Yu VP, Lee H, Corcoran A, Thistlethwaite FC, Evans MJ, Colledge WH, Friedman LS, Ponder BA, Venkitaraman AR 1998. Involvement of Brca2 in DNA repair. Mol Cell 1: 347–357 [DOI] [PubMed] [Google Scholar]
- Safran M, Solomon I, Shmueli O, Lapidot M, Shen-Orr S, Adato A, Ben-Dor U, Esterman N, Rosen N, Peter I, et al. 2002. GeneCards 2002: towards a complete, object-oriented, human gene compendium. Bioinformatics 18: 1542–1543 [DOI] [PubMed] [Google Scholar]
- Seshan VE, Olshen AB 2010. DNAcopy: A package for analyzing DNA copy data. BioPerl. http://bioconductor.org/help/bioc-views/release/bioc/html/DNAcopy.html
- Stratton MR 2011. Exploring the genomes of cancer cells: progress and promise. Science 331: 1553–1558 [DOI] [PubMed] [Google Scholar]
- Teer JK, Bonnycastle LL, Chines PS, Hansen NF, Aoyama N, Swift AJ, Abaan HO, Albert TJ, Margulies EH, Green ED, et al. 2010. Systematic comparison of three genomic enrichment methods for massively parallel DNA sequencing. Genome Res 20: 1420–1431 [DOI] [PMC free article] [PubMed] [Google Scholar]
- Wei X, Walia V, Lin JC, Teer JK, Prickett TD, Gartner J, Davis S, Stemke-Hale K, Davies MA, Gershenwald JE, et al. 2011. Exome sequencing identifies GRIN2A as frequently mutated in melanoma. Nat Genet 43: 442–446 [DOI] [PMC free article] [PubMed] [Google Scholar]
- Xu X, Weaver Z, Linke SP, Li C, Gotay J, Wang XW, Harris CC, Ried T, Deng CX 1999. Centrosome amplification and a defective G2-M cell cycle checkpoint induce genetic instability in BRCA1 exon 11 isoform-deficient cells. Mol Cell 3: 389–395 [DOI] [PubMed] [Google Scholar]
- Yoon S, Xuan Z, Makarov V, Ye K, Sebat J 2009. Sensitive and accurate detection of copy number variants using read depth of coverage. Genome Res 19: 1586–1592 [DOI] [PMC free article] [PubMed] [Google Scholar]
- Zhang Q, Ding L, Larson DE, Koboldt DC, McLellan MD, Chen K, Shi X, Kraja A, Mardis ER, Wilson RK, et al. 2010. CMDS: a population-based method for identifying recurrent DNA copy number aberrations in cancer from high-resolution data. Bioinformatics 26: 464–469 [DOI] [PMC free article] [PubMed] [Google Scholar]


