

Abstract
In randomized trials, the effect of vitamin D supplementation on blood pressure has been equivocal, while most prospective cohort studies have shown that the risk of incident hypertension is lower in people with higher levels of 25-hydroxyvitamin D (25(OH)D). The authors examined the association between levels of 25(OH)D and changes in blood pressure and incident hypertension in 4,863 postmenopausal women recruited into the Women’s Health Initiative between 1993 and 1998. Over 7 years, there were no significant differences in the adjusted mean change in systolic or diastolic blood pressure by quartile of 25(OH)D. The covariate-adjusted risk of incident hypertension was slightly lower in the upper 3 quartiles of 25(OH)D compared with the lowest quartile, but this was statistically significant only in the third quartile (hazard ratio = 0.67, 95% confidence interval: 0.46, 0.96). There was no significant linear or nonlinear trend in the risk of incident hypertension by untransformed or log-transformed continuous values of 25(OH)D. In postmenopausal women in this study, serum levels of 25(OH)D were not related to changes in blood pressure, and evidence for an association with lower risk of incident hypertension was weak.
Keywords: blood pressure, calcifediol, hypertension, prospective studies, vitamin D
Although some animal studies suggest that vitamin D supplementation may lower blood pressure (1, 2), the results of randomized trials in humans have been equivocal (3–5). The largest of these, the Women’s Health Initiative randomized trial of dietary supplementation with calcium plus vitamin D (CaD), included long-term follow-up of over 36,000 women (6). Over a median follow-up time of 7 years, there was no significant difference in the mean change over time in systolic blood pressure (SBP) or diastolic blood pressure (DBP), or in incident hypertension between the randomized active and placebo treatment groups, either overall or in the subgroups with low intake of vitamin D or low serum levels of vitamin D (7). However, the lack of effect on blood pressure in the Women’s Health Initiative CaD trial may have reflected an insufficient contrast in supplemental intake between the intervention and control groups. This could have resulted from too low a dose of vitamin D (400 IU/day) or nonadherence to study medication in the intervention group and from use of supplemental vitamin D in the control group.
Despite the inconclusive evidence from clinical trials, it is important to consider data from observational studies, which may include more representative populations with wider variations in vitamin D intake and serum levels. Although most of the biologic action including the possible blood pressure effects is likely mediated through 1,25-dihyroxyvitamin D3, 25-hydroxyvitamin D3 (25(OH)D) is generally considered the best biomarker for assessing vitamin D status. Several prospective studies have suggested that the risk of incident hypertension is lower among men and women with higher levels of 25(OH)D. In a study of male and female health professionals, the relative risk of self-reported incident hypertension with 25(OH)D levels of <30 ng/mL (or <75 nmol/L) was 3.2 (95% confidence interval (CI): 1.4, 7.3) compared with individuals with 25(OH)D levels of ≥30 ng/mL, after adjustment for age, race, menopausal status, body mass index, and physical activity (8). A case-control study in another cohort of nurses aged 32–52 years similarly found an elevated adjusted risk of self-reported incident hypertension among women with 25(OH)D blood levels of <30 ng/mL (relative risk = 1.5, 95% CI: 1.1, 2.0) (9). Another population-based study among women aged 22–44 years at baseline found that a low level of 25(OH)D predicted a 3.0-fold risk (95% CI: 1.1, 8.7) of incident systolic hypertension 13 years later, although there was no difference in the rate of change in blood pressure over the same time period (10). However, in contrast to these studies, a recent Norwegian study did not find an association of 25(OH)D levels with future hypertension or an increase in measured blood pressure (11). Thus, evidence from prospective studies regarding the association of 25(OH)D levels with the development of high blood pressure is also mixed.
The Women’s Health Initiative CaD trial data set includes several thousand women aged 50–79 years with baseline measurements of serum 25(OH)D who had long-term follow-up including annual blood pressure measurements by trained technicians, semiannual determinations of self-reported incident hypertension treatment, and periodic medication inventories. Because the trial results did not reveal any effect of the supplement intervention on hypertension or blood pressure, we used these data in an observational study to prospectively examine the association of baseline levels of 25(OH)D and changes in blood pressure and incident hypertension in postmenopausal women enrolled in the Women’s Health Initiative.
MATERIALS AND METHODS
Between 1993 and 1998, postmenopausal women aged 50–79 years were recruited at 40 US clinical centers into the Women’s Health Initiative randomized trials assessing the risks and benefits of hormone therapy and dietary modification (12, 13). Participants enrolled in one or both trials were further invited to join the CaD trial at their first (n = 33,070) or second (n = 3,212) annual follow-up visit. Baseline serum 25(OH)D levels were measured in 4,867 participants in 2 nested case-control studies in the CaD trial (7, 14–16). Cases in the first study had incident hip, spine, arm, or wrist fractures (n = 1,510) or colorectal cancer (n = 331) and in the second study had incident invasive breast cancer (n = 1,081). Controls were individually matched to case participants according to age, clinical center, race or ethnic group, and month of blood draw and were respectively free of fracture, colorectal cancer, or breast cancer for the duration of the study. We excluded 4 participants whose blood draw date occurred after the first annual follow-up visit, for a final sample of 4,863 women for this analysis.
Blood specimens were obtained after an overnight fast at the randomization visit, processed, frozen at −70°C, and stored according to a standard protocol. The specimens were analyzed with the DiaSorin Liaison chemiluminescent immunoassay system at DiaSorin headquarters (Stillwater, Minnesota) in 2 batches with blinded control runs at periodic intervals (coefficient of variation, 11.8%). The fracture and colorectal cancer cases and controls were analyzed in 2005, and the breast cancer cases and controls were analyzed in 2007. Case and control samples were measured in tandem in random order.
Blood pressure was measured by certified staff using standardized procedures and instruments, in the right arm, with a conventional mercury sphygmomanometer and an appropriately sized cuff, after the participant was seated and resting for 5 minutes (17). Two measurements, obtained at least 30 seconds apart, were performed at the enrollment visit and at each subsequent annual visit. The average of the 2 measurements was used for analyses.
At enrollment, participants were asked whether they had been diagnosed by a physician with high blood pressure or hypertension and if they were taking medications for hypertension. Then, at each semiannual contact, participants were asked, “Since the date given on the front of this form, has a doctor prescribed any of the following pills or treatments?” The choices included “pills for hypertension.” Medication inventories were conducted at enrollment and at the first, third, sixth, and ninth annual visits. The product or generic name of the medications on the label was entered into the study database and matched to the corresponding item in a pharmacy database (Master Drug Data Base (MDDB); Medi-Span (Wolters Kluwer Health), Indianapolis, Indiana). Drugs from the following classes were considered to be antihypertensive agents: angiotensin-converting enzyme inhibitors, angiotensin receptor blockers, β-blockers, calcium channel blockers, diuretics, centrally acting antihypertensive agents, vasodilators, and combinations of these medications. At enrollment in the Women’s Health Initiative study, 94% of women with self-reported hypertension treatment had an antihypertensive agent in the baseline drug inventory, and 79% with incident self-reported hypertension treatment during the first year of the trial brought an antihypertensive medication to the year 1 drug inventory.
Demographic variables and health history data were self-reported at the Women’s Health Initiative baseline. Dietary data were collected by using a validated food frequency questionnaire (17). Total calcium and vitamin D intakes included both dietary and supplement sources determined from the medication and supplement inventory. Metabolic equivalent task scores were calculated from the frequency and duration of recreational physical activity (18).
Serum vitamin D quartiles (<34.4, 34.4–47.6, 47.7–64.6, and ≥64.7 nmol/L) were created on the basis of the levels in the combined control groups. To convert nmol/L to ng/mL, divide by 2.496. We also conducted analyses using categories of serum 25(OH)D that are commonly used in clinical practice (<25, 25–<50, 50–<75, and ≥75 nmol/L). Blood pressure change was determined by using annual blood pressure measurements collected through 7 years of follow-up minus the blood pressure at the CaD randomization visit. Associations between baseline serum 25(OH)D level and change in systolic or diastolic pressure over time were analyzed by using generalized estimating equations. All participants with at least one blood pressure change measurement were included in the repeated measures models. Correlations among responses within a participant were specified as unstructured. Because the sample of participants with serum 25(OH)D measures was not a random sample of the cohort, probability sampling weights were incorporated into the models to approximate the analysis that would have occurred if serum 25(OH)D data had been available for the whole cohort. Weights were estimated as the inverse of the sampling fractions from strata defined by age in decades, race/ethnicity (white, black, Hispanic, other), and case status in the prior case-control studies. Because of this weighting, the results were more heavily influenced by the controls than the cases. In sensitivity analyses, we also examined the results in controls only. Plots of longitudinal data were based on fitted means from these models where both serum 25(OH)D and time were modeled as class variables and the association of serum 25(OH)D with blood pressure change was allowed to vary over time. We also evaluated change in systolic or diastolic pressure, under assumptions that the associations with 25(OH)D were constant over time. Because generalized estimating equation models are valid when data are missing completely at random but not necessarily under other missing data mechanisms, we conducted sensitivity analyses that included only women with blood pressure measured at all 7 years of follow-up.
To control for potential confounding, we adjusted all models for the case-control matching factors: age at initial screening (continuous), race/ethnicity, clinical center of blood draw, and month of blood draw. Additional models were adjusted for CaD trial assignment to intervention or placebo, education (less than high school, high school degree/general education diploma, education beyond high school), alcohol intake (nondrinker, <1 drink/day, ≥1 drinks/day), smoking (never smoked, past smoker, current smoker), body mass index at CaD enrollment, baseline physical activity (metabolic equivalent task (MET) hours/week), blood pressure at enrollment (normotensive, prehypertensive, hypertensive), antihypertensive medication use at time of CaD enrollment, and history of cardiovascular disease or diabetes at baseline. Body mass index, smoking status, and antihypertensive medication use were updated at each annual visit in the models as time-varying variables. Dietary and supplemental vitamin D intake were considered as covariates in a separate model, because intake could be in the causal pathway as a determinant of serum 25(OH)D levels. Similarly, because the baseline 25(OH)D level could be causally related to baseline blood pressure, we conducted additional analyses that did not adjust for baseline blood pressure.
The association of 25(OH)D level with incident hypertension was examined by using Cox proportional hazards models to estimate adjusted hazard ratios and 95% confidence intervals. The time in days from CaD enrollment was used as the basic time variable. Incident hypertension was defined as the first self-report of medication prescribed for hypertension or any blood pressure of ≥140/90 mm Hg during 7 years of follow-up among 2,153 women who did not have hypertension at CaD enrollment (no self-report of hypertension treatment, no antihypertensive medications in inventory, and blood pressure at all visits of <140/90 mm Hg prior to randomization). Follow-up time was censored for women not developing hypertension at the time of the last documented follow-up contact, death, or September 15, 2005 (whichever came first). As in the longitudinal analyses of blood pressure change, the inverse of estimated sampling probabilities was used to weight each observation in the estimation of risk, additionally taking into account that not all women in the complete cohort who developed hypertension had serum 25(OH)D measurements available for the present study (19). To evaluate the potentially nonlinear association between serum 25(OH)D and incident hypertension, we estimated hazard ratios and 95% confidence intervals using fully adjusted restricted cubic spline models with knots at 19.2, 40.9, 58.4, and 94.7 nmol/L (20). Linearity was evaluated by a Wald test of the coefficients of the second and third spline transformations, and the overall association of serum 25(OH)D and incident hypertension was evaluated by testing all 3 spline coefficients.
The association of 25(OH)D and incident hypertension within specific subgroups was examined by extending the models to include interaction terms between the categorical 25(OH)D variable and each factor of interest. Covariates in the incident hypertension models differed slightly from those described above because of the exclusion of women with hypertension at CaD enrollment. Therefore, blood pressure at enrollment included only normotensive and prehypertensive categories. Because none of the participants in analyses were taking antihypertensive medication at enrollment and the self-report of initiating antihypertensive treatment during follow-up was part of the incident hypertension outcome, these were not included as covariates. All P values presented are 2 sided. Data analyses were performed by using STATA, version 10, software (StataCorp LP, College Station, Texas).
RESULTS
At baseline, the mean age was 66 (standard deviation, 7) years, the mean blood pressure was 127/74 mm Hg, and 49% of the participants had hypertension. In unadjusted analyses by serum 25(OH)D quartiles, low serum levels were associated with the following baseline characteristics: older age, minority race/ethnicity, lower educational level, blood draw during winter or spring, history of cardiovascular disease or diabetes, higher blood pressure, hypertension, higher body mass index, lower physical activity, current smoking, lower alcohol intake, lower calcium intake, and lower vitamin D intake (Table 1). Among the 4,863 participants, by the end of the CaD study, 318 (6.5%) had died, 54 withdrew, and an additional 18 women were considered lost to follow-up.
Table 1.
Baseline Characteristics of Calcium Plus Vitamin D Trial Participants (n = 4,863) According to Quartile of Measured 25-Hydroxyvitamin D Level (nmol/L) Among Women Recruited Into the Women’s Health Initiative Between 1993 and 1998a
| No. | % | Quartile 1 (Median, 25.5 nmol/L; Range, 1–<34.4) |
Quartile 2 (Median, 40.9 nmol/L; Range, 34.4–<47.7) |
Quartile 3 (Median, 55.4 nmol/L; Range, 47.7–<64.7) |
Quartile 4 (Median, 78.4 nmol/L; Range, ≥64.7) |
P Value | |||||
| No. | % | No. | % | No. | % | No. | % | ||||
| Age at screening, years | |||||||||||
| 50–59 | 1,298 | 26.7 | 368 | 28.0 | 315 | 23.9 | 322 | 27.9 | 293 | 27.3 | <0.001 |
| 60–69 | 2,173 | 44.7 | 547 | 41.7 | 587 | 44.4 | 542 | 46.9 | 497 | 46.3 | |
| 70–79 | 1,392 | 28.6 | 398 | 30.3 | 419 | 31.7 | 292 | 25.3 | 283 | 26.4 | |
| Race/ethnicity | |||||||||||
| White | 4,324 | 88.9 | 1,068 | 81.3 | 1,182 | 89.5 | 1,065 | 92.1 | 1,009 | 94.0 | <0.001 |
| Black | 263 | 5.4 | 146 | 11.1 | 73 | 5.5 | 28 | 2.4 | 16 | 1.5 | |
| Hispanic | 127 | 2.6 | 52 | 4.0 | 25 | 1.9 | 31 | 2.7 | 19 | 1.8 | |
| Asian or Pacific Islander | 81 | 1.7 | 23 | 1.8 | 24 | 1.8 | 19 | 1.6 | 15 | 1.4 | |
| Other/unknown | 68 | 1.4 | 1.8 | 17 | 1.3 | 13 | 1.1 | 14 | 1.3 | ||
| Education | |||||||||||
| High school diploma or less | 1,171 | 24.2 | 349 | 26.7 | 327 | 24.9 | 249 | 21.8 | 246 | 23.0 | 0.003 |
| Some school after high school | 1,880 | 38.9 | 521 | 39.9 | 526 | 40.0 | 431 | 37.6 | 402 | 37.6 | |
| College degree or higher | 1,785 | 36.9 | 437 | 33.4 | 462 | 35.1 | 465 | 40.6 | 421 | 39.4 | |
| Region by solar irradiance in Langley categories | |||||||||||
| 475–500 | 980 | 20.2 | 224 | 17.1 | 244 | 18.5 | 243 | 21.0 | 269 | 25.1 | 0.12b |
| 400–430 | 793 | 16.3 | 242 | 18.4 | 228 | 17.3 | 168 | 14.5 | 155 | 14.5 | |
| 375–380 | 481 | 9.9 | 159 | 12.1 | 128 | 9.7 | 103 | 8.9 | 91 | 8.5 | |
| 350 | 1,126 | 23.2 | 297 | 22.6 | 322 | 24.4 | 266 | 23.0 | 241 | 22.5 | |
| 300–325 | 1,483 | 30.5 | 391 | 29.8 | 399 | 30.2 | 376 | 32.5 | 317 | 29.5 | |
| Latitude of clinical center at blood draw | |||||||||||
| Southern (≤37°N) | 1,531 | 31.5 | 425 | 32.4 | 403 | 30.5 | 345 | 30.0 | 358 | 33.4 | 0.423 |
| Middle (>37–40°N) | 1,025 | 21.1 | 266 | 20.3 | 288 | 21.8 | 240 | 20.8 | 231 | 21.5 | |
| Northern (>40°N) | 2,307 | 47.4 | 622 | 47.4 | 630 | 47.7 | 571 | 49.4 | 484 | 45.1 | |
| Season of blood draw | |||||||||||
| Winter | 1,117 | 23.0 | 393 | 29.9 | 302 | 22.9 | 236 | 20.4 | 186 | 17.3 | <0.001 |
| Spring | 1,221 | 25.1 | 393 | 29.9 | 346 | 26.2 | 258 | 22.3 | 224 | 20.9 | |
| Summer | 1,297 | 26.7 | 260 | 19.8 | 343 | 26.0 | 347 | 30.0 | 347 | 32.3 | |
| Fall | 1,228 | 25.3 | 267 | 20.3 | 330 | 25.0 | 315 | 27.2 | 316 | 29.5 | |
| History of CVD (MI, angina, CABG/PTCA, or stroke) | |||||||||||
| No | 4,504 | 92.6 | 1,196 | 92.0 | 1,211 | 91.7 | 1,080 | 93.4 | 1,017 | 94.8 | 0.002 |
| Yes | 359 | 7.4 | 117 | 8.9 | 110 | 8.3 | 76 | 6.6 | 56 | 5.2 | |
| History of treated diabetes | |||||||||||
| No | 4,634 | 95.4 | 1,225 | 93.4 | 1,246 | 94.4 | 1,117 | 96.6 | 1,046 | 97.5 | <0.001 |
| Yes | 226 | 4.7 | 86 | 6.6 | 74 | 5.6 | 39 | 3.4 | 27 | 2.5 | |
| History of high cholesterol requiring pills | |||||||||||
| No | 3,751 | 87.8 | 1,012 | 86.6 | 1,014 | 87.3 | 888 | 87.9 | 837 | 89.6 | 0.191 |
| Yes | 523 | 12.2 | 157 | 13.4 | 147 | 12.7 | 122 | 12.1 | 97 | 10.4 | |
| BP class at CaD enrollment (highest category) | |||||||||||
| <120/<80 mm Hg | 1,570 | 32.4 | 361 | 27.6 | 407 | 30.9 | 400 | 34.7 | 402 | 37.5 | <0.001 |
| 120–139/80–89 mm Hg | 2,120 | 43.7 | 576 | 44.1 | 584 | 44.3 | 491 | 42.6 | 469 | 43.8 | |
| 140–159/90–99 mm Hg | 929 | 19.2 | 298 | 22.8 | 268 | 20.3 | 206 | 17.9 | 157 | 14.7 | |
| ≥160/≥100 mm Hg | 232 | 4.8 | 73 | 5.6 | 59 | 4.5 | 56 | 4.9 | 44 | 4.1 | |
| Hypertension status at CaD enrollment | |||||||||||
| Not hypertensive | 2,480 | 51.0 | 583 | 44.4 | 639 | 48.4 | 632 | 54.7 | 626 | 58.4 | <0.001 |
| Treated with medications for hypertension (self-report) | 1,396 | 28.7 | 445 | 33.9 | 380 | 28.8 | 306 | 26.5 | 265 | 24.7 | |
| BP ≥140/90, not being treated | 987 | 20.3 | 285 | 21.7 | 302 | 22.9 | 218 | 18.9 | 182 | 17.0 | |
| BMI group at CaD enrollment | |||||||||||
| <25 | 1,426 | 29.5 | 255 | 19.6 | 357 | 27.2 | 376 | 32.9 | 438 | 41.1 | <0.001 |
| 25–<30 | 1,696 | 35.1 | 459 | 35.2 | 460 | 35.0 | 394 | 34.4 | 383 | 35.9 | |
| 30–<35 | 1,122 | 23.2 | 350 | 26.7 | 328 | 25.0 | 266 | 23.3 | 178 | 16.7 | |
| ≥35 | 583 | 12.1 | 239 | 18.3 | 168 | 12.8 | 108 | 9.4 | 68 | 6.4 | |
| Physical activity, MET hours/week | |||||||||||
| 0–3.00 | 1,404 | 32.4 | 497 | 41.9 | 392 | 33.4 | 287 | 28.0 | 228 | 24.2 | <0.001 |
| >3.00–<11.75 | 1,493 | 34.5 | 417 | 35.2 | 421 | 35.9 | 351 | 34.2 | 304 | 32.3 | |
| ≥11.75 | 1,431 | 33.1 | 272 | 22.9 | 360 | 30.7 | 389 | 37.9 | 410 | 43.5 | |
| Smoking | |||||||||||
| Never | 2,555 | 53.1 | 685 | 52.9 | 703 | 53.8 | 608 | 52.9 | 559 | 52.6 | 0.004 |
| Past | 1,902 | 39.5 | 481 | 37.2 | 514 | 39.3 | 469 | 40.8 | 438 | 41.2 | |
| Current | 356 | 7.4 | 128 | 9.9 | 91 | 7.0 | 72 | 6.3 | 65 | 6.1 | |
| Alcohol intake, drinks/week | |||||||||||
| None or <1 | 3,033 | 62.9 | 890 | 68.6 | 839 | 64.1 | 687 | 59.8 | 617 | 57.8 | <0.001 |
| 1–<7 | 1,243 | 25.8 | 282 | 21.7 | 331 | 25.3 | 316 | 27.5 | 314 | 29.4 | |
| ≥7 | 545 | 11.3 | 126 | 9.7 | 138 | 10.6 | 145 | 12.6 | 136 | 12.8 | |
| Total calcium intake, mg/day | |||||||||||
| <600 | 899 | 18.9 | 375 | 29.3 | 239 | 18.5 | 172 | 15.3 | 113 | 10.6 | <0.001 |
| 600–<800 | 680 | 14.3 | 202 | 15.8 | 202 | 15.7 | 170 | 15.1 | 106 | 10.0 | |
| 800–<1,200 | 1,262 | 26.5 | 337 | 26.3 | 357 | 27.7 | 302 | 26.8 | 266 | 25.1 | |
| ≥1,200 | 1,919 | 40.3 | 366 | 28.6 | 492 | 38.1 | 484 | 42.9 | 577 | 54.3 | |
| Dietary calcium intake, mg/day | |||||||||||
| ≥1,200 | 840 | 17.7 | 183 | 14.3 | 215 | 16.7 | 222 | 19.7 | 220 | 20.7 | |
| <400 | 582 | 12.2 | 209 | 16.3 | 164 | 12.7 | 120 | 10.6 | 89 | 8.4 | <0.001 |
| 400–<600 | 1,047 | 22.0 | 321 | 25.1 | 281 | 21.8 | 239 | 21.2 | 206 | 19.4 | |
| 600–<1,200 | 2,291 | 48.1 | 567 | 44.3 | 630 | 48.8 | 547 | 48.5 | 547 | 51.5 | |
| Total vitamin D intake (food and supplements), IU/day | |||||||||||
| <200 | 1,737 | 36.5 | 698 | 54.5 | 439 | 34.0 | 338 | 30.0 | 262 | 24.7 | <0.001 |
| 200–<400 | 948 | 19.9 | 256 | 20.0 | 277 | 21.5 | 216 | 19.2 | 199 | 18.7 | |
| ≥400 | 2,075 | 43.6 | 326 | 25.5 | 574 | 44.5 | 574 | 50.9 | 601 | 56.6 | |
| Dietary vitamin D, IU/day | |||||||||||
| <200 | 3,211 | 67.5 | 945 | 73.8 | 873 | 67.7 | 740 | 65.6 | 653 | 61.5 | <0.001 |
| ≥200 | 1,549 | 32.5 | 335 | 26.2 | 417 | 32.3 | 388 | 34.4 | 409 | 38.5 | |
| Dietary sodium, mg | |||||||||||
| 1–<2,039.528 | 1,218 | 25.6 | 321 | 25.1 | 340 | 26.4 | 292 | 25.9 | 265 | 25.0 | 0.729 |
| 2,039.528–<2,697.680 | 1,161 | 24.4 | 317 | 24.8 | 303 | 23.5 | 265 | 23.5 | 276 | 26.0 | |
| 2,697.680–<3,521.217 | 1,240 | 26.1 | 322 | 25.2 | 330 | 25.6 | 301 | 26.7 | 287 | 27.0 | |
| ≥3,521.217 | 1,141 | 24.0 | 320 | 25.0 | 317 | 24.6 | 270 | 23.9 | 234 | 22.0 | |
| Calcium/vitamin D assignment | |||||||||||
| CaD placebo arm | 2,461 | 50.6 | 654 | 49.8 | 693 | 52.5 | 588 | 50.9 | 526 | 49.0 | 0.353 |
| CaD intervention arm | 2,402 | 49.4 | 659 | 50.2 | 628 | 47.5 | 568 | 49.1 | 547 | 51.0 | |
Abbreviations: BMI, body mass index; BP, blood pressure; CABG, coronary artery bypass graft; CaD, calcium plus vitamin D; CVD, cardiovascular disease; MET, metabolic equivalent task; MI, myocardial infarction; PTCA, percutaneous transluminal coronary angioplasty.
To convert nmol/L to ng/mL, divide by 2.496.
Nonparametric test of trend in 25-hydroxyvitamin D level across solar irradiance categories.
Over a median follow-up time of 7 years and after adjustment for potential confounders, there were no significant differences in the mean change over time in SBP or DBP by quartile of serum 25(OH)D (Figure 1). Although SBP and DBP declined over time, the change in SBP or DBP by 25(OH)D category was not significantly different at any point in time (SBP, Pinteraction = 0.21; DBP, Pinteraction = 0.73). There were also no differences in SBP or DBP by quartile of vitamin D in stratified analysis of women with hypertension (not shown) and without hypertension (Figure 2). The results were nearly identical when using clinical cutpoints to define the serum 25(OH)D categories. Additional adjustment for vitamin D intake did not materially change the results, nor did not adjusting for baseline blood pressure. The results were also similar in analyses of controls only and in women with complete data at all 7 follow-up visits. No significant interaction of 25(OH)D quartile with non-white race was observed.
Figure 1.

Change in systolic blood pressure (A) and diastolic blood pressure (B) in Calcium plus Vitamin D Trial participants, by baseline serum 25-hydroxyvitamin D level (nmol/L), among women recruited into the Women’s Health Initiative between 1993 and 1998. Categories are as follows: quartile 1, <34.4 (solid line with filled circle); quartile 2, 34.4–47.6 (dashed line with filled square); quartile 3, 47.7–64.6 (dotted line with filled triangle); quartile 4, ≥64.7 (dotted-dashed line with filled diamond). To convert nmol/L to ng/mL, divide by 2.496. Adjusted for age, race/ethnicity, clinical center, blood draw month, calcium/vitamin D trial assignment, education, alcohol intake, smoking, body mass index, physical activity, blood pressure at enrollment, antihypertensive medication use, history of cardiovascular disease, and history of diabetes. Numbers in parentheses indicate total women with systolic or diastolic measurement at each follow-up year. The mean systolic change (mm Hg) was, for quartile 1, −4.8 (95% confidence interval (CI): −6.8, −2.8); quartile 2, −5.0 (95% CI: −6.9, −3.0); quartile 3, −4.3 (95% CI: −6.5, −2.2); quartile 4: −5.3 (95% CI: −7.4, −3.2) (P = 0.51). The mean diastolic change (mm Hg) was, for quartile 1, −3.5 (95% CI: −4.8, −2.2); quartile 2, −3.6 (95% CI: −4.9, −2.3); quartile 3, −3.5 (95% CI: −4.8, −2.2); quartile 4, −3.6 (95% CI: −4.9, −2.2) (P = 0.99).
Figure 2.

Change in systolic blood pressure (A) and diastolic blood pressure (B) in Calcium plus Vitamin D Trial participants without hypertension at baseline, by baseline serum 25-hydroxyvitamin D level (nmol/L), among women recruited into the Women’s Health Initiative between 1993 and 1998. Categories are as follows: quartile 1, <34.4 (solid line with filled circle); quartile 2, 34.4–47.6 (dashed line with filled square); quartile 3, 47.7–64.6 (dotted line with filled triangle); quartile 4, ≥64.7 (dotted-dashed line with filled diamond). To convert nmol/L to ng/mL, divide by 2.496. Adjusted for age, race/ethnicity, clinical center, blood draw month, calcium/vitamin D trial assignment, education, alcohol intake, smoking, body mass index, physical activity, blood pressure at enrollment, initiation of antihypertensive medication use during follow-up, history of cardiovascular disease, and history of diabetes. Numbers in parentheses indicate total women with systolic or diastolic measurement at each follow-up year. The mean systolic change (mm Hg) was, for quartile 1, 1.9 (95% confidence interval (CI): −0.6, 4.5); quartile 2, 1.8 (95% CI: −0.9, 4.5); quartile 3, 2.0 (95% CI: −0.8, 4.9); quartile 4, 1.4 (95% CI: −1.4, 4.2) (P = 0.88). The mean diastolic change (mm Hg) was, for quartile 1, −1.5 (95% CI: −3.3, 0.3); quartile 2, −1.6 (95% CI: −3.6, 0.3); quartile 3, −2.5 (95% CI: −4.4, −0.5); quartile 4, −2.3 (95% CI: −4.2, −0.3) (P = 0.27).
In the minimally adjusted model 1 (Table 2), the risk of incident hypertension was slightly lower in the upper 3 quartiles of 25(OH)D compared with the lowest quartile, but this was statistically significant only in the third quartile (hazard ratio = 0.70, 95% CI: 0.51, 0.96). Results were similar in models adjusted for additional potential confounders (Table 2) and when baseline blood pressure was not included as a covariate (data not shown). No significant interactions were observed with race, body mass index, smoking, or level of baseline blood pressure. In the models using clinical categories of serum 25(OH)D, compared with a level of <25 nmol/L, none of the higher categories had a significantly lower risk of incident hypertension. For example, in model 2, the relative risk of hypertension was 1.04 (95% CI: 0.65, 1.68) in women with a level of 25–<50 nmol/L, 0.84 (95% CI: 0.52, 1.36) with a level of 50–<75 nmol/L, and 0.96 (95% CI: 0.55, 1.66) with a level ≥75 nmol/L. The results were similar in model 3. There was no significant linear or nonlinear trend in the risk of incident hypertension by untransformed or log-transformed continuous values of 25(OH)D in any of the models. A cubic spline plot (Figure 3) illustrates the lack of a nonlinear association of 25(OH)D serum levels with incident hypertension after adjustment for the model 2 covariates (Plinearity = 0.09; Passociation = 0.19). Hazard ratios and 95% confidence intervals computed at the median values of quartiles 2–4 (41.4, 55.9, and 77.6 nmol/L, respectively), referent to 25 nmol/L, were 0.95 (95% CI: 0.68, 1.31), 0.79 (95% CI: 0.56, 1.10), and 0.80 (95% CI: 0.55, 1.15).
Table 2.
Hazard Ratio of Incident Hypertension (891 Cases) Among 2,153 Nonhypertensive Calcium Plus Vitamin D Trial Participants With Available Baseline 25-Hydroxyvitamin D Measurements (nmol/L) Among Women Recruited Into the Women’s Health Initiative Between 1993 and 1998
| Incident Hypertension by 25(OH)D Quartilea |
P Valueb | ||||||||
| Quartile 1 (Median, 26.2 nmol/L; Range, 1–<34.4) |
Quartile 2 (Median, 41.4 nmol/L; Range, 34.4–<47.7) |
Quartile 3 (Median, 55.9 nmol/L; Range, 47.7–<64.7) |
Quartile 4 (Median, 77.6 nmol/L; Range, ≥64.7) |
||||||
| HR | 95% CI | HR | 95% CI | HR | 95% CI | HR | 95% CI | ||
| Model 1c | 1.00 | Referent | 0.90 | 0.65, 1.25 | 0.70 | 0.51, 0.96 | 0.81 | 0.59, 1.11 | 0.20 |
| Model 2d | 1.00 | Referent | 0.92 | 0.64, 1.33 | 0.67 | 0.46, 0.96 | 0.86 | 0.61, 1.23 | 0.17 |
| Model 3e | 1.00 | Referent | 0.91 | 0.62, 1.32 | 0.66 | 0.46, 0.96 | 0.86 | 0.60, 1.23 | 0.19 |
Abbreviations: CI, confidence interval; HR, hazard ratio; 25(OH)D, 25-hydroxyvitamin D3.
Quartile 1: 234 cases, 2,686 person-years; quartile 2: 224 cases, 3,133 person-years; quartile 3: 220 cases, 3,217 person-years; quartile 4: 213 cases, 3,258 person-years.
P value for overall association.
Controlled for age, race/ethnicity, clinical center, and month of blood draw.
Controlled for the variables in model 1 plus calcium/vitamin D trial assignment, education, alcohol intake, smoking, body mass index, physical activity, blood pressure at enrollment, history of cardiovascular disease, and history of diabetes.
Controlled for the variables in model 2 and for dietary/supplemental vitamin D intake.
Figure 3.
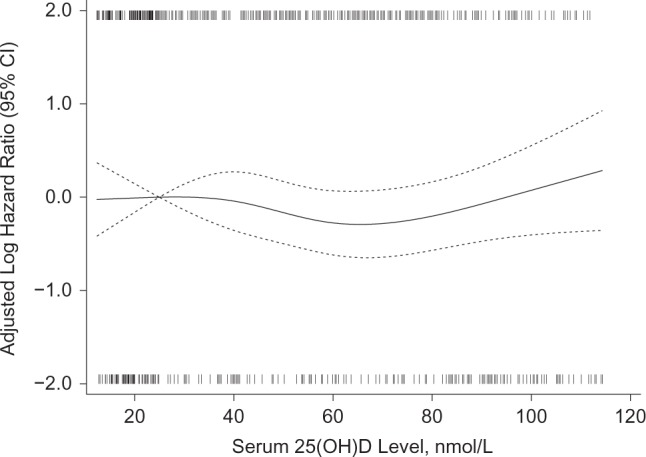
Log hazard ratio for incident hypertension in Calcium plus Vitamin D Trial participants by baseline serum 25-hydroxyvitamin D (25(OH)D) level using a fully adjusted restricted cubic spline model with knots at 19.2, 40.9, 58.4, and 94.7 nmol/L, adjusted for age, race/ethnicity, clinical center, blood draw month, calcium/vitamin D trial assignment, education, alcohol intake, smoking, body mass index, physical activity, blood pressure at enrollment, history of cardiovascular disease, and history of diabetes (Plinearity = 0.09; Passociation = 0.19), among women recruited into the Women’s Health Initiative between 1993 and 1998. The solid curve represents point estimates for a 1-unit difference in serum 25(OH)D referent to a level of 25 nmol/L; the dotted curves represent pointwise 95% confidence intervals. The thin vertical lines below the plot (cases) and above the plot (noncases) show the density of serum 25(OH)D specimens with values at each level. To convert nmol/L to ng/mL, divide by 2.496.
DISCUSSION
These prospective findings from postmenopausal women enrolled in the Women’s Health Initiative do not indicate that serum vitamin D levels are related to changes in either SBP or DBP or to incident hypertension. Although there was a suggestion that women with baseline serum 25(OH)D levels in the third quartile (approximately 48–65 nmol/L) had a slightly lower risk of incident hypertension than those in the lowest quartile, this was not an a priori hypothesis and could have been a chance finding. Compared with women with serum 25(OH)D levels of <25 nmol/L, those with levels above 50 nmol/L did not have a lower risk of incident hypertension. The cubic spline analysis does not support a linear or significant nonlinear association of 25(OH)D and risk of incident hypertension, although the slight U-shape of the plot is similar to that in population-based studies of 25(OH)D and risk of incident cardiovascular events and all-cause mortality in some studies (21, 22).
These results are consistent with findings from another recent Norwegian prospective study that included a broad age spectrum of men and women (11). Several other prospective studies did find that low levels of 25(OH)D were predictive of self-reported incident hypertension in health professionals, but these studies did not include measured blood pressure (8, 9).
A recent meta-analysis of the effect of vitamin D on blood pressure included 11 trials of α-calcidiol, cholecalciferol, calcium plus cholecalciferol, ergocalciferol, and ultraviolet B in diverse study populations of a total of 270 subjects, most of whom had blood pressure in the hypertensive range (3). The studies ranged in duration from 5 weeks to 12 months, and the Women’s Health Initiative CaD trial was not included. Overall, there were no differences in SBP, but a small difference in DBP was observed with treatment (−3.1 mm Hg, 95% CI: −5.5, −0.6). Subgroup analyses suggested less effect in trials of activated vitamin D and in trials with normotensive subjects. Two trials published after this meta-analysis (one in 165 healthy overweight German men and women (23) and another in 438 overweight and obese Norwegian men and women (5)) did not find any effects on blood pressure of 12 months of supplementation with substantial doses of cholecalciferol (3,332 IU/day and 40,000 IU/week, respectively).
Elegant experiments in vitamin D receptor knockout mice have shown increased activation of the renin-angiotensin-aldosterone system that can be reversed by administration of 1,25-hydroxyvitamin D (1, 2). Recently, human studies have similarly found that, compared with individuals with 25(OH)D levels of >75 nmol/L, those with lower levels have higher circulating levels of angiotensin II and a blunted renal plasma flow response to infused angiotensin II (an indirect measure of intrinsic renin-angiotensin system activity in the kidney) (24). These effects may differ in obese and nonobese individuals (25). Despite this evidence, consistent epidemiologic or experimental evidence of an effect of vitamin D on human blood pressure is lacking, as recently comprehensively reviewed by Vaidya and Forman (26).
The results from the present Women’s Health Initiative observational study in postmenopausal women may differ from results in younger women, who were the majority of the participants in some of the previous prospective cohort studies. Another potential reason that our results might differ from other studies is because of rigorous adjustment for potential confounders, but the results of our study changed little when additional covariates were added to models adjusted for age, race, clinical center, and month of blood draw. Probably a more important factor was the rigor with which we measured blood pressure and adjusted for commencement of antihypertensive treatment over time. Although incident hypertension was based in part upon self-reports of beginning new antihypertensive therapy, we have shown that these self-reports were quite reliable on the basis of comparisons with inventories of actual medications being taken. A limitation is that we did not have information about subsequent addition of new antihypertensive drugs or dosage adjustment. Another limitation is that 25(OH)D was measured only once; lack of precision in determining 25(OH)D levels could have hampered detecting true associations. Finally, we acknowledge that our serum 25(OH)D measurements were taken from case-control studies designed to study conditions other than hypertension, and that statistical adjustment was required to account for this design. However, we did not observe different results without statistical adjustment or in controls.
We conclude that, in generally healthy postmenopausal women, serum levels of 25(OH)D are not related to changes in blood pressure or to incident hypertension. Although the evidence that vitamin D has an effect on cardiovascular disease and mortality is inconsistent and controversial, it has generated intense interest (27–33). A large planned placebo-controlled trial, the VITamin D and OmegA-3 TriaL (VITAL), should provide more information about the effect of vitamin D supplementation on a variety of outcomes, including hypertension.
Acknowledgments
Author affiliations: HealthPartners Research Foundation, Minneapolis, Minnesota (Karen L. Margolis, Tessa J. Kerby); George Washington University, Washington, DC (Lisa W. Martin); Fred Hutchinson Cancer Research Center, Seattle, Washington (Roberta M. Ray); University of California San Diego, San Diego, California (Matthew A. Allison); University of Hawaii, Honolulu, Hawaii (J. David Curb); Medical College of Wisconsin, Milwaukee, Wisconsin (Theodore A. Kotchen); University of California Los Angeles, Los Angeles, California (Simin Liu); Albert Einstein College of Medicine, New York, New York (Sylvia Wassertheil-Smoller); and Harvard Medical School, Boston, Massachusetts (JoAnn E. Manson).
The Women’s Health Initiative program is funded by the National Heart, Lung, and Blood Institute, National Institutes of Health, US Department of Health and Human Services, through contracts N01WH22110, 24152, 32100-2, 32105-6, 32108-9, 32111-13, 32115, 32118-32119, 32122, 42107-26, 42129-32, and 44221.
Conflict of interest: none declared.
Glossary
Abbreviations
- CaD
calcium plus vitamin D
- CI
confidence interval
- DBP
diastolic blood pressure
- 25(OH)D
25-hydroxyvitamin D
- SBP
systolic blood pressure
APPENDIX
Short List of Women’s Health Initiative Investigators
Program Office—National Heart, Lung, and Blood Institute, Bethesda, Maryland: Jacques Rossouw, Shari Ludlam, Joan McGowan, Leslie Ford, and Nancy Geller. Clinical Coordinating Centers—Fred Hutchinson Cancer Research Center, Seattle, Washington: Ross Prentice, Garnet Anderson, Andrea LaCroix, Charles Kooperberg; Medical Research Labs, Highland Heights, Kentucky: Evan Stein; and University of California at San Francisco, San Francisco, California: Steven Cummings. Clinical Centers—Albert Einstein College of Medicine, Bronx, New York: Sylvia Wassertheil-Smoller; Baylor College of Medicine, Houston, Texas: Haleh Sangi-Haghpeykar; Brigham and Women’s Hospital, Harvard Medical School, Boston, Massachusetts: JoAnn E. Manson; Brown University, Providence, Rhode Island: Charles B. Eaton; Emory University, Atlanta, Georgia: Lawrence S. Phillips; Fred Hutchinson Cancer Research Center, Seattle, Washington: Shirley Beresford; George Washington University Medical Center, Washington, DC: Lisa Martin; Los Angeles Biomedical Research Institute at Harbor-UCLA Medical Center, Torrance, California: Rowan Chlebowski; Kaiser Permanente Center for Health Research, Portland, Oregon: Erin LeBlanc; Kaiser Permanente Division of Research, Oakland, California: Bette Caan; Medical College of Wisconsin, Milwaukee, Wisconsin: Jane Morley Kotchen; MedStar Research Institute/Howard University, Washington, DC: Barbara V. Howard; Northwestern University, Chicago/Evanston, Illinois: Linda Van Horn; Rush Medical Center, Chicago, Illinois: Henry Black; Stanford Prevention Research Center, Stanford, California: Marcia L. Stefanick; State University of New York at Stony Brook, Stony Brook, New York: Dorothy Lane; The Ohio State University, Columbus, Ohio: Rebecca Jackson; University of Alabama at Birmingham, Birmingham, Alabama: Cora E. Lewis; University of Arizona, Tucson/Phoenix, Arizona: Cynthia A. Thomson; University at Buffalo, Buffalo, New York: Jean Wactawski-Wende; University of California at Davis, Sacramento, California: John Robbins; University of California at Irvine, Irvine, California: F. Allan Hubbell; University of California at Los Angeles, Los Angeles, California: Lauren Nathan; University of California at San Diego, LaJolla/Chula Vista, California: Robert D. Langer; University of Cincinnati, Cincinnati, Ohio: Margery Gass; University of Florida, Gainesville/Jacksonville, Florida: Marian Limacher; University of Hawaii, Honolulu, Hawaii: J. David Curb; University of Iowa, Iowa City/Davenport, Iowa: Robert Wallace; University of Massachusetts/Fallon Clinic, Worcester, Massachusetts: Judith Ockene; University of Medicine and Dentistry of New Jersey, Newark, New Jersey: Norman Lasser; University of Miami, Miami, Florida: Mary Jo O’Sullivan; University of Minnesota, Minneapolis, Minnesota: Karen Margolis; University of Nevada, Reno, Nevada: Robert Brunner; University of North Carolina, Chapel Hill, North Carolina: Gerardo Heiss; University of Pittsburgh, Pittsburgh, Pensylvania: Lewis Kuller; University of Tennessee Health Science Center, Memphis, Tennessee: Karen C. Johnson; University of Texas Health Science Center, San Antonio, Texas: Robert Brzyski; University of Wisconsin, Madison, Wisconsin: Gloria E. Sarto; Wake Forest University School of Medicine, Winston-Salem, North Carolina: Mara Vitolins; and Wayne State University School of Medicine/Hutzel Hospital, Detroit, Michigan: Michael S. Simon. Women’s Health Initiative Memory Study—Wake Forest University School of Medicine, Winston-Salem, North Carolina: Sally Shumaker.
References
- 1.Li YC, Kong J, Wei M, et al. 1,25-Dihydroxyvitamin D3 is a negative endocrine regulator of the renin-angiotensin system. J Clin Invest. 2002;110(2):229–238. doi: 10.1172/JCI15219. [DOI] [PMC free article] [PubMed] [Google Scholar]
- 2.Zhou C, Lu F, Cao K, et al. Calcium-independent and 1,25(OH)2D3-dependent regulation of the renin-angiotensin system in 1α-hydroxylase knockout mice. Kidney Int. 2008;74(2):170–179. doi: 10.1038/ki.2008.101. [DOI] [PubMed] [Google Scholar]
- 3.Witham MD, Nadir MA, Struthers AD. Effect of vitamin D on blood pressure: a systematic review and meta-analysis. J Hypertens. 2009;27(10):1948–1954. doi: 10.1097/HJH.0b013e32832f075b. [DOI] [PubMed] [Google Scholar]
- 4.Feneis JF, Arora RR. Role of vitamin D in blood pressure homeostasis. Am J Ther. 2010;17(6):e221–e229. doi: 10.1097/MJT.0b013e3181d16999. [DOI] [PubMed] [Google Scholar]
- 5.Jorde R, Sneve M, Torjesen P, et al. No improvement in cardiovascular risk factors in overweight and obese subjects after supplementation with vitamin D3 for 1 year. J Intern Med. 2010;267(5):462–472. doi: 10.1111/j.1365-2796.2009.02181.x. [DOI] [PubMed] [Google Scholar]
- 6.Margolis KL, Ray RM, Van Horn L, et al. Effect of calcium and vitamin D supplementation on blood pressure: the Women’s Health Initiative Randomized Trial. Hypertension. 2008;52(5):847–855. doi: 10.1161/HYPERTENSIONAHA.108.114991. [DOI] [PMC free article] [PubMed] [Google Scholar]
- 7.Jackson RD, LaCroix AZ, Gass M, et al. Calcium plus vitamin D supplementation and the risk of fractures. N Engl J Med. 2006;354(7):669–683. doi: 10.1056/NEJMoa055218. [DOI] [PubMed] [Google Scholar]
- 8.Forman JP, Giovannucci E, Holmes MD, et al. Plasma 25-hydroxyvitamin D levels and risk of incident hypertension. Hypertension. 2007;49(5):1063–1069. doi: 10.1161/HYPERTENSIONAHA.107.087288. [DOI] [PubMed] [Google Scholar]
- 9.Forman JP, Curhan GC, Taylor EN. Plasma 25-hydroxyvitamin D levels and risk of incident hypertension among young women. Hypertension. 2008;52(5):828–832. doi: 10.1161/HYPERTENSIONAHA.108.117630. [DOI] [PMC free article] [PubMed] [Google Scholar]
- 10.Griffin FC, Gadegbeku CA, Sowers MR. Vitamin D and subsequent systolic hypertension among women. Am J Hypertens. 2011;24(3):316–321. doi: 10.1038/ajh.2010.226. [DOI] [PubMed] [Google Scholar]
- 11.Jorde R, Figenschau Y, Emaus N, et al. Serum 25-hydroxyvitamin D levels are strongly related to systolic blood pressure but do not predict future hypertension. Hypertension. 2010;55(3):792–798. doi: 10.1161/HYPERTENSIONAHA.109.143990. [DOI] [PubMed] [Google Scholar]
- 12.Ritenbaugh C, Patterson RE, Chlebowski RT, et al. The Women’s Health Initiative Dietary Modification trial: overview and baseline characteristics of participants. Ann Epidemiol. 2003;13(suppl 9):S87–S97. doi: 10.1016/s1047-2797(03)00044-9. [DOI] [PubMed] [Google Scholar]
- 13.Stefanick ML, Cochrane BB, Hsia J, et al. The Women’s Health Initiative postmenopausal hormone trials: overview and baseline characteristics of participants. Ann Epidemiol. 2003;13(suppl 9):S78–S86. doi: 10.1016/s1047-2797(03)00045-0. [DOI] [PubMed] [Google Scholar]
- 14.Jackson RD, LaCroix AZ, Cauley JA, et al. The Women’s Health Initiative calcium-vitamin D trial: overview and baseline characteristics of participants. Ann Epidemiol. 2003;13(suppl 9):S98–S106. doi: 10.1016/s1047-2797(03)00046-2. [DOI] [PubMed] [Google Scholar]
- 15.Wactawski-Wende J, Kotchen JM, Anderson GL, et al. Calcium plus vitamin D supplementation and the risk of colorectal cancer. Women’s Health Initiative Investigators. N Engl J Med. 2006;354(7):684–696. doi: 10.1056/NEJMoa055222. [DOI] [PubMed] [Google Scholar]
- 16.Chlebowski RT, Johnson KC, Kooperberg C, et al. Calcium plus vitamin D supplementation and the risk of breast cancer. J Natl Cancer Inst. 2008;100(22):1581–1591. doi: 10.1093/jnci/djn360. [DOI] [PMC free article] [PubMed] [Google Scholar]
- 17.Patterson RE, Kristal AR, Tinker LF, et al. Measurement characteristics of the Women’s Health Initiative food frequency questionnaire. Ann Epidemiol. 1999;9(3):178–187. doi: 10.1016/s1047-2797(98)00055-6. [DOI] [PubMed] [Google Scholar]
- 18.Ainsworth BE, Haskell WL, Leon AS, et al. Compendium of physical activities: classification of energy costs of human physical activities. Med Sci Sports Exerc. 1993;25(1):71–80. doi: 10.1249/00005768-199301000-00011. [DOI] [PubMed] [Google Scholar]
- 19.Mark SD, Katki HA. Specifying and implementing nonparametric and semiparametric survival estimators in two-stage (sampled) cohort studies with missing case data. J Am Stat Assoc. 2006;101(474):460–471. [Google Scholar]
- 20.Durrleman S, Simon R. Flexible regression models with cubic splines. Stat Med. 1989;8(5):551–561. doi: 10.1002/sim.4780080504. [DOI] [PubMed] [Google Scholar]
- 21.Wang TJ, Pencina MJ, Booth SL, et al. Vitamin D deficiency and risk of cardiovascular disease. Circulation. 2008;117(4):503–511. doi: 10.1161/CIRCULATIONAHA.107.706127. [DOI] [PMC free article] [PubMed] [Google Scholar]
- 22.Melamed ML, Michos ED, Post W, et al. 25-Hydroxyvitamin D levels and the risk of mortality in the general population. Arch Intern Med. 2008;168(15):1629–1637. doi: 10.1001/archinte.168.15.1629. [DOI] [PMC free article] [PubMed] [Google Scholar]
- 23.Zittermann A, Frisch S, Berthold HK, et al. Vitamin D supplementation enhances the beneficial effects of weight loss on cardiovascular disease risk markers. Am J Clin Nutr. 2009;89(5):1321–1327. doi: 10.3945/ajcn.2008.27004. [DOI] [PubMed] [Google Scholar]
- 24.Forman JP, Williams JS, Fisher ND. Plasma 25-hydroxyvitamin D and regulation of the renin-angiotensin system in humans. Hypertension. 2010;55(5):1283–1288. doi: 10.1161/HYPERTENSIONAHA.109.148619. [DOI] [PMC free article] [PubMed] [Google Scholar]
- 25.Vaidya A, Forman JP, Williams JS. Vitamin D and the vascular sensitivity to angiotensin II in obese Caucasians with hypertension. J Hum Hypertens. 2011;25(11):672–678. doi: 10.1038/jhh.2010.110. [DOI] [PMC free article] [PubMed] [Google Scholar]
- 26.Vaidya A, Forman JP. Vitamin D and hypertension: current evidence and future directions. Hypertension. 2010;56(5):774–779. doi: 10.1161/HYPERTENSIONAHA.109.140160. [DOI] [PubMed] [Google Scholar]
- 27.Mertens PR, Müller R. Vitamin D and cardiovascular risk. Int Urol Nephrol. 2010;42(1):165–171. doi: 10.1007/s11255-009-9685-z. [DOI] [PubMed] [Google Scholar]
- 28.Giovannucci E. Vitamin D and cardiovascular disease. Curr Atheroscler Rep. 2009;11(6):456–461. doi: 10.1007/s11883-009-0068-9. [DOI] [PubMed] [Google Scholar]
- 29.Pittas AG, Chung M, Trikalinos T, et al. Systematic review: vitamin D and cardiometabolic outcomes. Ann Intern Med. 2010;152(5):307–314. doi: 10.1059/0003-4819-152-5-201003020-00009. [DOI] [PMC free article] [PubMed] [Google Scholar]
- 30.Wang L, Manson JE, Song Y, et al. Systematic review: vitamin D and calcium supplementation in prevention of cardiovascular events. Ann Intern Med. 2010;152(2):315–323. doi: 10.7326/0003-4819-152-5-201003020-00010. [DOI] [PubMed] [Google Scholar]
- 31.Zittermann A, Gummert JF, Börgermann J. Vitamin D deficiency and mortality. Curr Opin Clin Nutr Metab Care. 2009;12(6):634–639. doi: 10.1097/MCO.0b013e3283310767. [DOI] [PubMed] [Google Scholar]
- 32.Wu-Wong JR. Potential for vitamin D receptor agonists in the treatment of cardiovascular disease. Br J Pharmacol. 2009;158(2):395–412. doi: 10.1111/j.1476-5381.2009.00171.x. [DOI] [PMC free article] [PubMed] [Google Scholar]
- 33.Pilz S, Dobnig H, Nijpels G, et al. Vitamin D and mortality in older men and women. Clin Endocrinol (Oxf). 2009;71(5):666–672. doi: 10.1111/j.1365-2265.2009.03548.x. [DOI] [PubMed] [Google Scholar]