

Abstract
Objective
To examine feasibility and test-retest reliability of encoding-task functional MRI (fMRI) in mild Alzheimer’s disease (AD).
Design
Randomized, double-blind, placebo-controlled (RCT) study.
Setting
Memory clinical trials unit.
Participants
Twelve subjects with mild AD (MMSE 24.0±0.7, CDR 1), on >6 months stable donepezil, from the placebo-arm of a larger 24-week (n=24, four scans on weeks 0,6,12,24) study.
Interventions
Placebo and three face-name paired-associate encoding, block-design BOLD-fMRI scans in 12 weeks.
Main Outcomes
Whole-brain t-maps (p<0.001, 5-contiguous voxels) and hippocampal regions-of-interest (ROI) analyses of extent (EXT, %voxels active) and magnitude (MAG, %signal change) for Novel-greater-than-Repeated (N>R) face-name contrasts. Calculation of Intraclass Correlations (ICC) and power estimates for hippocampal ROIs.
Results
Task-tolerability and data yield were high (95 of 96 scans yield good quality data). Whole-brain maps were stable. Right and left hippocampal ROI ICCs were 0.59–0.87 and 0.67–0.74, respectively. To detect 25–50% changes in 0–12 week hippocampal activity using L/R-EXT or R-MAG with 80% power (2-sided-α=0.05) requires 14–51 subjects. Using L-MAG requires >125 subjects due to relatively small signals to variance ratios.
Conclusions
Encoding-task fMRI was successfully implemented in a single-site, 24-week, AD RCT. Week 0–12 whole-brain t-maps were stable and test-retest reliability of hippocampal fMRI measures ranged from moderate to substantial. Right hippocampal-MAG may be the most promising of these candidate measures in a leveraged context. These initial estimates of test-retest reliability and power justify evaluation of encoding-task fMRI as a potential biomarker for “signal-of-effect” in exploratory and proof-of-concept trials in mild AD. Validation of these results with larger sample sizes and assessment in multi-site studies is warranted.
Key code for symbols: α = alpha, β = Beta
With the large number of potential therapies for Alzheimer’s disease (AD) entering large-scale clinical trials, there remains a critical need for biomarkers that can rapidly detect a signal-of-effect or -efficacy. Symptomatic and/or disease-modifying therapies may acutely or subacutely alter synaptic function, which may serve as a predictor of long-term response. Functional MRI (fMRI) may prove valuable to detect effects that modulate brain networks in early-phase AD trials, but the practicality of implementing longitudinal fMRI and the test-retest reliability of task-related fMRI remains unknown. Also lacking are power estimates to inform investigators regarding sample sizes required to reasonably detect AD treatment-related effects in fMRI.
Task-related fMRI studies have primarily focused on cross-sectional group comparisons of AD patients to elderly controls and subjects with mild cognitive impairment (MCI)1–25. FMRI studies in AD or MCI that assessed effects of cholinesterase-inhibitors on BOLD-fMRI activity8, 13, 16, 24–26 have either been exploratory/pilot studies or lacked RCT design, and have provided limited information on the test-retest reliability of fMRI in this population. Here, we implement fMRI in a randomized, double-blind, placebo-controlled trial (RCT) format to assess feasibility and test-retest reliability of fMRI in 12 mild AD subjects randomized to the placebo-arm of the study.
METHODS
Subjects
Twelve subjects with mild AD (MMSE 16–26) were randomized to the 12-week placebo-arm of a larger (n=24 patients) and longer (24-weeks) AD pharmaco-fMRI study. Inclusion criteria: 1) NINCDS-ADRDA criteria for Probable AD, 2) fluent in English, 3) no focal lesions on neuroimaging, 4) on a stable dose of donepezil (Aricept®) for >6 months, 5) have study partner (e.g. spouse, relative) to monitor adherence. Exclusion criteria: 1) unstable or severe medical or psychiatric illness, 2) contraindication to MRI, 3) use of other investigational agent within two months, 4) use of non-donepezil cholinesterase-inhibitor or antipsychotic within six months, and 5) ever taken memantine (Namenda ®). Subjects and partners provided consent in accordance with Human Research Committee guidelines. Subjects were remunerated $50 after each fMRI.
Study Design and Procedures
The overall study spanned 24-weeks and 9 visits, and employed a RCT (50% memantine+donepezil, 50% placebo+donepezil) parallel-group design for 12 weeks, followed by a 12-week single-blind period when all subjects received drug (100% memantine+donepezil). The reliability study data reported here was obtained from the fMRI scans at weeks 0 (baseline), 6, and 12 weeks in the placebo group only. Neuropsychological and clinical assessments included the Mini-Mental State Examination (MMSE), the ADAS-Cog, and the Clinical Dementia Rating Scale (CDR).
Functional MRI Paradigm
The details of the fMRI paradigm, sequencing and preprocessing are described in published studies1, 2, 4, 6, 7, 27 and on-line (see eMethods). The paradigm is comprised of three conditions presented in successive blocks: (i) Novel face-name pairs, (ii) Repeated face-name pairs, and (iii) Fixation cross. 84 Novel pairs and 42 Repeated pairs were displayed for 5s each across six runs. Subjects were instructed to try to remember the name paired with each face. Immediately after scanning, two post-scan behavioral/memory tests were administered: a face recognition (yes/no reply) and free-recall of name (for “yes” responses) task, and a 2-alternative forced-choice name recognition of face task.
Image Acquisition, Preprocessing and Quality Assurance
Data were acquired on a 3-T GE scanner. Each functional run was 4min and 15s (102 time-points; first 4 discarded for T1- stabilization). Preprocessing in SPM2 (http://www.fil.ion.ucl.ac.uk/spm/software/spm2/): 3×3×3 mm re-slicing in MNI space, 8 mm FWHM-Gaussian smoothing, 260s high-pass filter.
Due to scanner repair, one subject had 6- and 12-week scans performed on a 3-T Siemens scanner. Data quality assurance included: 1) manual inspection of all images sequentially for scanner spiking and excessive motion, and 2) automated artifact detection algorithms that repaired any time-point with a mean signal >3-SD of each subject’s mean global signal using an interpolation from surrounding scans (9 subjects affected). One week-6 (T2) was irreparable due to excessive intra-scan movement, and was imputed using the subject’s T1T3 averages.
Statistical Analysis: FMRI and Clinical Measures
Pre-specified analyses focused on two methods to assess changes in MAG, calculated as percent signal change, and EXT, calculated as percent active voxels, of activations for Novel greater-than Repeated (N>R) stimuli between week-0 (baseline) and week-12 fMRIs (i.e. T1–T3 change in N>R contrast). Pre-specified primary analyses were: 1) whole-brain t-test analyses and SPM maps with significance thresholds at p<0.001 and extent threshold of five contiguous voxels, and 2) Hippocampal ROI analyses with small volume corrections for multiple comparisons within a priori anatomically-defined hippocampal ROIs28.
For comparison, secondary analyses were performed on non-hippocampal a priori anatomically-defined ROIs including bilateral precuneus and posterior cingulate cortices obtained in template space using the MarsBaR application (http://marsbar.sourceforge.net/) that have previously shown robust and selective task-related, and spatio-temporally correlated activity in this fMRI paradigm1. Repeated-measures ANCOVAs assessed changes in clinical measures in the 12-weeks between T1-T3 fMRIs.
Test-retest Reliability of fMRI Activations in reliability ROIs
Test-retest reliability for EXT and MAG of N>R activity from baseline(T1) to week-12(T3) fMRIs were assessed using two complementary approaches: intraclass correlation coefficients (ICC), using a variation of ICC assessing agreement of score values (not merely correlation) for random effects models, referred to by Shrout and Fleiss (1979) as “ICC(2,1)” for reliability at a single point in time and “ICC(2,k)” for that of an average score across k time points29 (see eMethods on-line), and power analysis/sample size determination30. Since there is no standard or widely accepted definition for general adjectives that describe reliability measures/ICC values/ranges we chose to adopt conservative terminology by using the definition proposed by Shrout (1998)31 when qualitatively referring to ICCs values/ranges as follows: virtually none (0.00, 0.10); slight (0.11, 0.40); fair (0.41, 0.60); moderate (0.61, 0.80); substantial (0.81, 1.0)31. We did not utilize the widely used but much more liberal terminology of Landis and Koch32 when describing reliability values (slight (0, 0.20); fair (0.21, 0.4); moderate (0.41, 0.60), substantial (0.61, 0.80); (0.81, 1.0) almost perfect) nor several other proposed descriptors32–34. Power analyses estimated required sample sizes sensitive to 25%, 50% and 75% changes (up or down) from baseline in EXT and MAG at power levels of 70%, 80% and 90% with 2-sided-α<0.0530.
To determine whether effects of demographic (e.g. age, education), clinical (e.g., CDR, CDR-sum-of-boxes [CDR-sb], MMSE) and post-scan memory/behavioral measures contributed to hippocampal ROI test-retest variability, thereby requiring adjustment for them in the ICC calculations, interactions of baseline levels of these variables with time, in addition to their main effects as covariates, were included as predictor terms in a repeated measures ANCOVA in which EXT or MAG of fMRI activity was the dependent variable. Unlike main effects of covariates, any variance due to the covariate by time interaction, unless removed, is pooled into the subject by time interaction error variance and inappropriately augments estimated unreliability, though it represents true score variance, biasing the ICC downward. We estimated and removed this confound via regression and separation of residuals. Power analyses were based on these “adjusted ICCs”. Please refer to eMethods on-line for all ICC formulas and details of calculations (with and without adjustment) and their rationale.
RESULTS
Demographics and Clinical Characteristics
Baseline characteristics (Table 1) of the placebo-arm (PLAC, n=12) did not differ from the larger group (ALL, n=24, MMSE range 18–26) or from the drug-arm (n=12) that is not included in this report and will be reported elsewhere in an analysis of potential anti-dementia drug effects on fMRI signals. Except for decline on post-scan memory test2, there were no significant changes between baseline and week-12.
Table 1.
Demographics and clinical and memory measures at baseline and weeks 6 and 12 for the larger study (ALL, n=24) and the placebo-arm (PLAC, n=12) on which fMRI test-retest reliability was assessed.
| T1 baseline (ALL) n = 24 | T1 baseline (PLACa) n = 12 | T2 week 6 (PLACa) n = 12 | T3 week 12 (PLACa) n = 12 | |
|---|---|---|---|---|
| Demographic, mean (SEM) | ||||
| Women, n (%) | 15 (63) | 8 (67) | _ | _ |
| Age, y | 71.6 (1.7) | 71.8 (2.2) | _ | _ |
| Education, y | 16.0 (0.6) | 16.2 (0.8) | _ | _ |
| Clinical measure, mean (SEM) | ||||
| MMSE, correct | 24.0 (0.7) | 24.3 (0.8) | 23.6 (1.0) | 23.6 (0.7) |
| ADAS-Cogb, errors | 26.2 (1.9) | 25.1 (2.6) | 25.6 (3.3) | 25.5 (2.7) |
| CDR sum of boxesb (CDR-sb) | 4.7 (0.5) | 4.0 (0.6) | 4.0 (0.6) | 4.3 (0.7) |
| CDRb | 1.0 (0.1) | 0.9 (0.1) | 1.0 (0.1) | 1.0 (0.1) |
| Post-scan memory tests, mean (SEM) | ||||
| Recall of name, % correct | 67.0 (1.9) | 65.7 (2.5) | 58.3 (2.8) | 63.0 (4.1) |
| 2-Alternative forced choice name recognition, % correct | 68.8 (3.3) | 73.2 (4.7) | 59.0* (4.7) | 60.7* (3.5) |
Abbreviations: SEM, standard error of the mean; MMSE, mini-mental state exam; ADAS-Cog = Alzheimer’s Disease Assessment Scale Cognitive Subscale; CDR, Clinical Dementia Rating scale; ALL, Group of all 24 subjects; PLAC= placebo-arm (n=12)
Placebo-arm (PLAC, n=12), whose data were used to assess fMRI test-retest reliability, there where there no significant changes in performance over 12 weeks, with the exception of decline on post-scan name recognition test performance between baseline and subsequent visits (* p<0.05 difference compared to T1)
Higher values on ADAS-Cog, CDR-sb and CDR represent worse performance and more advanced dementia severity. In contrast, higher values on MMSE and MT1 and MT2 represent better performance.
Feasibility, Tolerability and Data Quality
All subjects enrolled in the larger study completed the 24-week study with four fMRI scans. 95/96 fMRI scans yielded acceptable-quality data. Baseline whole-brain N>R activation maps for the group of 24 subjects and placebo-arm (n=12) showed similar regional activity (Figure 1), and difference maps between them were null (ie., had no significant clusters) (not shown).
Figure 1.
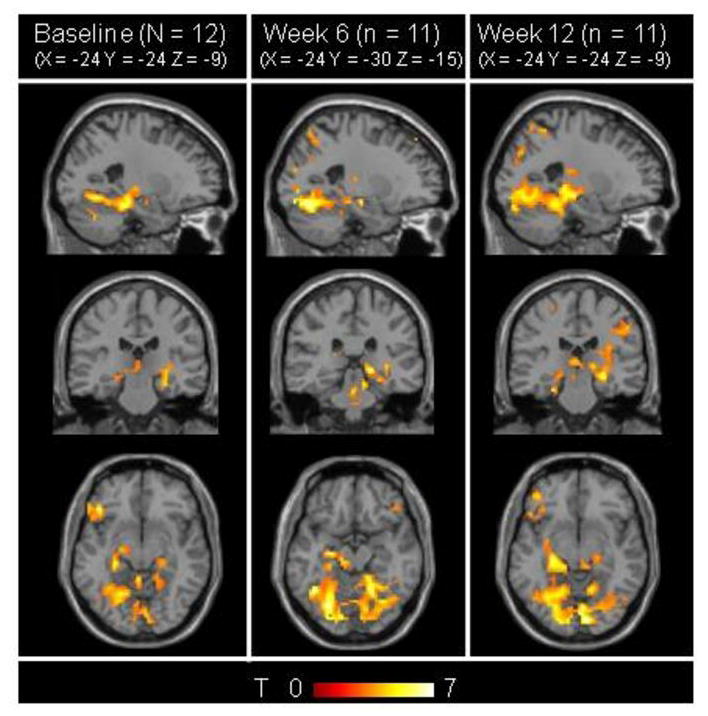
Stability of whole-brain SPM maps. N>R contrast maps (p<0.001, 5-voxel extent) for the same template coordinate (-24, -24, -9) for the placebo-arm (PLAC, n=12) at baseline (A), week 6 (T2) (n=11) (B) and week 12 (T3) (n=12) (C). Mapwise activity patterns are stable and consistent with patterns found in previous studies 1, 2. Difference maps with p<0.01, 5-voxel extent threshold (not shown) show no significant clusters (i.e. no significant differences between baseline, week 6 and week 12 scans).
Stability of fMRI Whole-Brain Maps and Hippocampal ROI Activity Across 12 Weeks
Reliability analyses were performed in the placebo-subgroup (n=12). Regional activity patterns for N>R contrasts were consistent with past studies using the same paradigm 1, 2. At each scan, areas of significant N>R activity were found in bilateral hippocampi, right inferior frontal cortex, right cingulate, and right prefrontal cortex (Figure 1B, 1C, 1D and Table 2). Also, whole-brain N>R activation maps for all permutations of difference maps between time-points T1, T2, and T3 (e.g. T1-T2, T1-T3) were stable and showed no clusters of significant activity differing between sessions.
Table 2.
Peak voxels with significanta differences in N>R contrast at baseline scan (n = 12).
| Region | MNI | Talairach | p | psmall volume-correctedb |
|---|---|---|---|---|
| R Hippocampus | 27 −27 −9 | −27 −27 −6 | 0.022 | 0.014 |
| L Hippocampus | −24 −27 −9 | 24 −27 −6 | 0.011 | 0.007 |
| R Inferior Frontal | 42 30 −9 | 42 29 −9 | 0.001 | 0.0004 |
| R Cingulate | 9 30 33 | 9 31 29 | 0.025 | 0.016 |
| R Prefrontal | 30 45 0 | 30 44 −2 | 0.001 | 0.0003 |
Abbreviations: MNI, Montreal Neurological Institute; N>R, Novel > Repeated face-name pair; R, right; L, Left
Whole-brain SPM analysis for significance threshold of p<0.001 with extent threshold of five contiguous voxels. MNI and Talairach coordinates are shown for the peak voxel in a cluster.
Small volume-corrected p-value represents p-value for peak voxel in a cluster with small-volume correction accounting for ROI size(# of voxels in ROI)-dependent multiple comparison adjustment – ie., multiple-comparison adjustment of p-value based only # of voxels in the ROI (not the whole brain).
The mean EXT and MAG for right and left hippocampal ROIs did not significantly vary across sessions (weeks 0,6,12) (Figure 2) or from the larger group of 24 subjects at baseline (see eFigure 1 on-line). Repeated-measures AN(C)OVAs revealed no significant changes for hippocampal ROI signals, with or without covariance adjustments of baseline characteristics (p>0.25). Sensitivity analysis that varied statistical (p=0.01-0.001) and extent (2–10 contiguous voxels) thresholds at several cut-offs showed no differences for all combinations of EXT and MAG measures compared to the a priori chosen thresholds of p=0.001 and 5-voxel extent.
Figure 2.
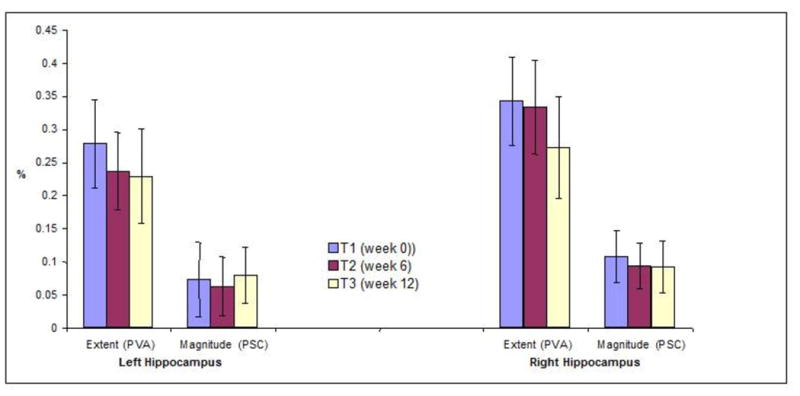
Mean +/− SEM MAG (percent signal change, PSC) and EXT (percentage voxels active, PVA) of N>R contrast BOLD fMRI signal in the left and right Hippocampal ROIs across the three, T1 (baseline, week 0), T2 (week 6), and T3 (week 12) scans. Hippocampal ROIs demonstrated similar EXT and MAG of activation at each fMRI session.
Intraclass Correlations, Power and Sample Size Analysis
Table 3 displays hippocampal ICCs, with and without adjustment for potential “Baseline CDR-sb by time” interactions, which were found to be significant in repeated measures ANCOVA for the right hippocampus, and estimated sample sizes required to detect 25%, 50%, and 75% mean changes from baseline on EXT and MAG fMRI measures based on 80% power with a 2-sided-α=0.05. To provide greatest generalizability, individual-ICCs (i.e. single-ICCs) were calculated using a random subjects term. Mean-ICCs (averaged across three scans) are also reported (see eMethods).
Table 3.
Intraclass Correlation Coefficients (ICCs) and Predicted Sample Size Estimates for Left and Right Hippocampal ROIs.
| ROI Measurea (NvR) | Individual ICCb For baseline to week 12 scans (mean ICC)c |
Predicted Sample Sizee Required to detect a potential 12-week change from baseline with 80% power (2-sided α 0.05) |
|||
|---|---|---|---|---|---|
| Raw ICC | Adjusted ICCd | 25% Change | 50% Change | 75% Change | |
| L Hipp. EXT | 0.68 (0.81) | 0.74 (0.85) | 51 | 15 | 8 |
| L Hipp. MAG | 0.67 (0.80) | 0.67 (0.80) | 489 | 124 | 56 |
| R Hipp. EXT | 0.33 (0.50) | 0.59 (0.75) | 46 | 14 | 8 |
| R Hipp. MAG | 0.67 (0.80) | 0.87 (0.93) | 50 | 14 | 8 |
Abbreviations: NvR, Novel versus Repeated face-name contrast; NvF, Novel face-name versus Fixation Cross contrast; EXT, Extent; PVA; L, Left; R, Right.
ROI Measure (1st column) lists ROI and activation measure (EXT and MAG) Hippocampal ROIs.
Individual ICCs (2nd column) show raw individual-ICCs (2nd column, 1st sub-column) for T1 (baseline = week 0) to T3, week 0–12, fMRIs and adjusted individual ICCs (2nd column, 2nd sub-column).
Mean ICCs for the “average” (mean) score across the time-points are shown in parenthesis.
Adjusted ICCs account for CDR-sb by time interactions.
Predicted sample size estimates required to detect 25%, 50% and 75% 12-week changes from baseline fMRI measure with 80% power assume a 2-sided α of 0.05 (i.e. bidirectional change from baseline) and utilize adjusted ICCs values.
For the right hippocampus, higher baseline CDR-sb scores were associated with larger rates of decline in hippocampal activity (p<0.01, corrected for multiple comparisons). Adjusted ICCs, which pre-removed variance due to CDR-sb by time interactions, increased ICC estimates for right hippocampus only. For RH-EXT, a raw individual-ICC of 0.33 yielded an adjusted individual-ICC of 0.59, while a raw mean-ICC of 0.5 yielded an adjusted mean-ICC of 0.75. For the RH-MAG, a raw individual-ICC of 0.67 yielded an adjusted individual-ICC of 0.87, while a raw mean-ICC of 0.8 yielded an adjusted mean-ICC of 0.93. For comparison, ICCs for the precuneus and posterior cingulate, important hubs in the default intrinsic connectivity network, were lower (0.33–0.6 range) and unaffected by adjustments (see eTable1 on-line).
For 80% power and a group-level change of 50% from baseline in EXT to be detected in the left hippocampus, 15 subjects would be required. For similar power and 50% change in MAG, 124 subjects would be needed. For similar 50% changes to be detected in the right hippocampus for either EXT or MAG, 14 subjects would be required. At every power level (70%, 80%, 90%), left hippocampal MAG was predicted to require sample sizes of approximately one-order of magnitude greater than the other measures (L/R-side EXT, R-side MAG) (see eTable 2 on-line).
DISCUSSION
This study demonstrates the feasibility of implementing task-related fMRI within the typical format of an AD RCT. Test-retest reliability of encoding-related fMRI was assessed using placebo-arm subjects who underwent fMRIs 12 weeks apart. Changes in fMRI activity were assessed globally via whole-brain map-level t-tests, and regionally via ICCs for MAG and EXT of N>R activity in a priori structurally defined hippocampal ROIs. Test-retest reliability was mostly in the moderate-to-substantial range; whole-brain contrast maps were stable, and hippocampal ICCs, adjusted for baseline disease severity by time-related decline (which only affected R-MAG), ranged from 0.6–0.9. If a priori focus is directed at the right hippocampus or changes in EXT (i.e. %voxels active), power estimates predict that for this paradigm relatively modest sample sizes may detect group-level 12-week fMRI changes in the 25–50% range.
We have demonstrated the feasibility of implementing multiple fMRI sessions in a longitudinal AD RCT format. Subjects tolerated an intensive imaging protocol with high-yield of good quality data (95/96 scans yielded acceptable data). Our results support the feasibility of successfully implementing task-related fMRI paradigms in mild AD across multiple scans and weeks.
The second objective of the study, to assess fMRI whole-brain map-level and hippocampal test-retest reliability, was assessed in subjects randomized to the placebo-arm. This allowed power calculations to predict sample sizes needed to accurately detect significant changes in hippocampal activity. These estimates may inform design and interpretation of future exploratory and proof-of-concept trials that utilize fMRI as a potential AD biomarker.
The study’s strengths include a rigorous RCT design, inclusion of well-characterized subjects on stable long-term cholinergic therapy, high compliance and follow-up, utilization of a robust and well-characterized associative-memory block-design encoding paradigm, and employment of standard fMRI software, tools, and processing streams that increase generalizability. Also, reliability was assessed for convergence utilizing several approaches, sensitivity analysis showed robustness of both EXT and MAG values to perturbations in statistical and extent of contiguous-voxels thresholds, and power projections were obtained to guide sample sizes for future early-phase fMRI RCTs – particularly those at single sites involving subjects with mild AD.
The patterns of regional fMRI activity are consistent with previous studies, and support the validity of focusing on changes in a priori defined hippocampal and related ROIs where drug-related effects on episodic memory encoding are observed, particularly in this encoding paradigm 1, 6, 27. These studies suggest specificity for hippocampal activity, as well as inversely-related activity between the hippocampus and precuneus, for subsequent memory success/failure and face-name encoding-related activity1, 5. Reassuringly, hippocampal ROIs showed the highest ICCs compared to several other pre-selected regions in a distributed memory network.
A robust fMRI biomarker of encoding and retrieval processes would ideally include a measure(s) of shifting patterns of activity (“signatures”) in core network hubs that include, depending on cognitive load and task-specificity, hippocampal and related-MTL areas, precuneus, posterior cingulate and related-medial and lateral parietal regions, and medial inferior and dorsolateral frontal cortices. While this study primarily focuses on longitudinal fMRI feasibility and reliability in the hippocampus, a central node in memory acquisition and integration, future studies will leverage cognitive networks by integrating activity patterns in hubs, including medial and lateral parietal, and medial and inferior frontal regions, assess reliability and power analysis for fMRI network signals, and explore potential drug-related effects.
Overall, we opted for a conservative bias and greater focus on generalizability. We used individual (single) ICCs, not group (mean) ICCs (arithmetic average for a group of scans) that would have provided higher values (Table 3). Calculated ICCs also assumed random scans (i.e. model2-ICCs), as opposed to fixed scans (i.e. model3-ICCs), thereby increasing generalizablity of results. Hippocampal ICCs, with or without adjustment for baseline CDR-sb, are generally higher than those recently reported in normal elderly controls and subjects with MCI in verbal episodic memory encoding and retrieval fMRI tasks six-weeks apart 35. Also, power predictions for estimated sample sizes to detect changes in fMRI measures 12-weeks apart assume modest (25–75%) and bi-directional changes (2-sided-α’s) in hippocampal activity. In similar paradigms, ROI effect sizes were larger or unidirectional, including in the hippocampus of young subjects administered scopolamine (% change vs placebo -53% for EXT and -57% for MAG) and lorazepam (% change vs placebo -52% for EXT and -57% for MAG)27, and in fusiform regions of AD subjects administered rivastigmine (% change vs no-rivastigmine +95% for MAG in left and +600% in right fusiform regions) 8. Employing exploratory analyses, unidirectional a priori hypotheses (e.g. fMRI activity will increase with drug/intervention) or exclusion of left hippocampal MAG as a primary signal measure may allow modest sample sizes to detect changes in the 50%-range. For this paradigm, population (i.e. mild AD) and time intervals of several days to weeks, the right hippocampal signal, especially the MAG measure (i.e. % change in right hippocampal BOLD signal)36, is likely to be most sensitive to physiological, pathological, and pharmacological stressors, has substantial measurement reliability (over these short intervals unless corrected for trait instability), and may be potentially useful as an exploratory biomarker of trait, state, rate or signal-of-effect. Later in the disease state this may not be the case as the neural correlates affecting the BOLD signal changes may not Pairing an fMRI scan with a clinical visit at week-12 provides a parsimonious design consistent with “proof of concept” AD trials, and for experimental drugs with potential subacute symptomatic effects, this provides a sufficient interval to detect signals of clinical efficacy beyond 4–8 week windows when placebo effects may confound37, 38. Finally, the tools and methods employed for functional data analyses were simple, standard and widely available (e.g. SPM, MNI template space, MarsBaR).
It is important to recognize that the interaction of baseline CDR-sb with decline in right hippocampal fMRI signal over time is not due to fMRI measurement inaccuracy or unreliability - it is an estimable component of putative real variation that can be accounted for independently and removed from an “adjusted” ICC (through regression and residualizing methods), which is what was done here, because it might otherwise confound as measurement unreliability and bias ICCs downward. In doing so, we opted for the more conservative approach of removing this confounding source of variance from the denominator of the ICC formula but without adding it to the numerator (see eMethods). That more impaired subjects, those with higher baseline CDR-sb’s, exhibited greater decline in right hippocampal activity 12-weeks later is consistent with studies that show decreased fMRI hippocampal signal in AD relative to in cognitively intact older controls and subjects with MCI3–5, 23. It is also consistent with the hypothesis that once AD patients meet criteria for mild dementia, task-related hippocampal activity may rapidly decline with advancing illness3–5. Similarly, AD subjects with smaller hippocampal volumes subsequently show a greater rate of decline in hippocampal volumes over one year39. Baseline levels of cognition and function, and their interactions with time in study, are also important determinants of clinical trajectory of decline40–42. Finally, improvements over raw ICCs were specific to the right hippocampus; raw and adjusted ICCs were not substantially different in the left hippocampus and comparison ROIs (Table 3 and eTable1). This is not surprising since the face-name paradigm provides greater novelty and cognitive demands in the visual domain, and previous studies have shown task-, age- and disease-state-related sensitivity for this paradigm in the right hippocampus1, 3–7, 27.
These data and interpretations also have limitations and caveats. While this study provides good internal validity and successful implementation at a single experienced site, results could vary considerably across multiple sites, scanners, platforms and AD populations. These results require validation in single-site studies and to assess if findings for whole brain and hippocampal signal reliability will accurately reflect scaling in multi-site studies. Our subjects were in the mild clinical stages of AD (CDR 1, mean MMSE 24), highly educated and on stable long-term donepezil therapy. While generalizable to a majority of candidates with AD eligible for currently enrolling experimental-drug RCTs, extrapolation to subjects who are drug naïve, use other anti-dementia medicines, or have low-education bears caution. Also, based on our previous experience, it is likely that the majority of subjects with moderate-stage (CDR 2) AD would have difficulty completing this fMRI paradigm and performing above chance levels. High internal validity and subject homogeneity in our study may have resulted in under-estimation of ICC’s due to low between-subject variance. While we do not measure or adjust for individual/native hippocampal volumes or possible changes, given the low annual rates of hippocampal atrophy in AD, it is unlikely that atrophy over a 12-week period would significantly affect the accuracy of ROI boundaries and fMRI signals39, 43, 44. Our results suggest EXT and right hippocampal measures (EXT/MAG) may be more robust and efficient for power projections in visual-verbal paired-associate paradigms. The L-MAG measure had only moderate ICCs values (0.67), resulting in the need for many more subjects to detect of 25–50% effects. Except for left hippocampus, MAG ICCs were ~0.1–0.3 higher than EXT ICCs (Table 2 and eTable 1). However, power analysis did not show an advantage of utilizing MAG measures, especially on the left side. This underscores that ICCs and sample size estimates provide somewhat complementary information for pragmatic design and interpretation of biomarkers in AD RCTs.
Importantly, our short-term study does not address the utility of fMRI in detecting disease-modifying effects in longer-term studies in AD populations. It is possible that a subacute fMRI effect will be predictive of longitudinal change, but as with PET and structural MRI45, 46, the ultimate validation of fMRI as a potential biomarker of efficacy will require incorporation into an AD therapeutic trial demonstrating positive clinical benefit. A general caution pertains to the nature of the BOLD-fMRI signal as a surrogate for neural activity. Changes in the BOLD-signal may reflect other neurophysiological processes, including micro-neurovascular coupling, and not necessarily changes in dendritic synaptic local field potentials. Future studies will assess test-retest reliability by defining ROIs in native space, leveraging network dynamics, and using modeling to quantify functional connectivity.
In conclusion, our study demonstrated moderate-to-substantial test-retest reliability for a face-name, paired-associate encoding, block-design fMRI paradigm performed by subjects with mild AD at a single-site. These highly focused findings suggest that should significant BOLD-fMRI changes in hippocampal signals occur acutely or subacutely within 12 weeks due to a potential intervention or disease progression, then the signal, noise and measurement variability characteristics of longitudinal fMRI measures utilizing similar encoding paradigms may allow their detection with reasonable accuracyPower analyses suggest that detection of changes from baseline hippocampal activity in the 50%-range may require dozens and not hundreds of subjects, especially if a priori or exploratory focus is on right hippocampal or extent measures. Meanwhile, small group-level changes in the 25% range may be detectable with sample sizes currently used in small Phase-II AD trials. These results support the feasibility of utilizing fMRI as a potential biomarker in early phase “proof of concept” RCTs to detect if a drug is acutely or subacutely “reaching” or affecting the brain or having a specific targeted or biological effect (as measured by BOLD-fMRI) on a brain region or network. This study provides evidence that task-related fMRI is feasible to implement longitudinally in mild AD at a single-site, and may have sufficient test-retest reliability to be incorporated in early-phase clinical trials. In combination with other experimental measures, task-fMRI may potentially help detect a “signal of effect” and guide early development programs for novel AD therapeutics.
Supplementary Material
Acknowledgments
The study was supported by NIA 1K23 AG027171 (Atri), NIA RO1 AG027435 (Sperling), The Harvard-Massachusetts Institute of Technology Health Sciences & Technology Pfizer-Merck Clinical Investigator Training Program (Atri), the NIH loan repayment program (Atri), Investigator-Initiated Research Grants from Forest Pharmaceuticals and The Harvard Center for Neurodegeneration & Repair, the Clinical, Neuroimaging, and Statistics Cores of the Massachusetts Alzheimer’s Disease Research Center (NIA 5 P50AG05134 Growdon and Hyman), and the Geriatric Research Education & Clinical Center (GRECC) at the Edith Nourse Rogers Memorial (ENRM) Veterans Administration (VA) Bedford Medical Center. We would like to acknowledge Kim Celone, Kristina DePeau, Dr. Eli Diamond, Saul Miller, Dr. Maija Pihlamajaki, and Dr. Meghan Searl for assistance with data collection and preliminary data processing, and Lynn Shaughnessy for assistance with manuscript preparation. We would also like to acknowledge Dr. John Growdon (MGH Memory Disorders Unit & MA Alzheimer’s Disease Research Center) for providing significant assistance with subject recruitment, space, resources, and guidance, and Dr. Bruce Rosen (MGH-Harvard-MIT Martinos Center for Biomedical Imaging) for providing guidance, space and resources for this research. Finally, and most importantly, we express our deep gratitude for the commitment of the patients, family members and caregivers without whose generous contribution and dedication this research would not be possible.
Footnotes
Drs. Atri and Sperling contributed to the design and execution of the study and the interpretation of the data. Drs. Atri and Locascio were primarily responsible for the statistical analyses and statistical interpretation of the data. All other authors contributed to the collection and interpretation of the data. All authors contributed to the writing of the manuscript. Dr. Atri, as principle author, takes full responsibility for the data, the analyses and interpretation, and the conduct of the research; has full access to all the data, and has the right to publish any and all data, separate and apart from all sponsors that have contributed to the conduct of this research study. IRB approval was granted for this study. All subjects and their study partners underwent the informed consent process and provided written consent.
Disclosure: Dr. Atri has served as a consultant, on the advisory board or received lecture honoraria from Eisai, Forest, Lundbeck, Merck, Merz and Novartis. Dr. Sperling has served as a consultant, on the scientific advisory board or received lecture honoraria from Eisai, Elan, Eli Lilly, Forest, Merck, Pfizer and Wyeth. A portion (<30%) of this research was supported by an Investigator-Initiated Research Grant from Forest Pharmaceuticals. Principal support for this research was provided by the NIH/NIA (K23, R01, P50 grant mechanisms). The principal authors (Atri & Sperling) retain full control of the data and publication rights. The remaining authors have no disclosures.
Contributor Information
Dr. Jacqueline L. O’Brien, Email: jlobrien@nmr.mgh.harvard.edu.
Dr. Aishwarya Sreenivasan, Email: aish@nmr.mgh.harvard.edu.
Dr. Sarah Rastegar, Email: sarah.rastegar@gmail.com.
Dr. Sibyl Salisbury, Email: ssalisbury@mghihp.edu.
Dr. Amy N. DeLuca, Email: amyndeluca@gmail.com.
Dr. Kelly M. O’Keefe, Email: kokeefe1@partners.org.
Dr. Peter S. LaViolette, Email: lavips@nmr.mgh.harvard.edu.
Dr. Dorene M. Rentz, Email: drentz@partners.org.
Dr. Joseph J. Locascio, Email: jlocascio@partners.org.
Dr. Reisa A. Sperling, Email: rsperling@rics.bwh.harvard.edu.
References
- 1.Celone KA, Calhoun VD, Dickerson BC, et al. Alterations in memory networks in mild cognitive impairment and Alzheimer’s disease: an independent component analysis. J Neurosci. 2006 Oct 4;26(40):10222–10231. doi: 10.1523/JNEUROSCI.2250-06.2006. [DOI] [PMC free article] [PubMed] [Google Scholar]
- 2.Diamond EL, Miller S, Dickerson BC, et al. Relationship of fMRI activation to clinical trial memory measures in Alzheimer disease. Neurology. 2007 Sep 25;69(13):1331–1341. doi: 10.1212/01.wnl.0000277292.37292.69. [DOI] [PubMed] [Google Scholar]
- 3.Dickerson BC, Salat DH, Bates JF, et al. Medial temporal lobe function and structure in mild cognitive impairment. Ann Neurol. 2004 Jul;56(1):27–35. doi: 10.1002/ana.20163. [DOI] [PMC free article] [PubMed] [Google Scholar]
- 4.Dickerson BC, Salat DH, Greve DN, et al. Increased hippocampal activation in mild cognitive impairment compared to normal aging and AD. Neurology. 2005 Aug 9;65(3):404–411. doi: 10.1212/01.wnl.0000171450.97464.49. [DOI] [PMC free article] [PubMed] [Google Scholar]
- 5.Miller SL, Fenstermacher E, Bates J, Blacker D, Sperling RA, Dickerson BC. Hippocampal activation in adults with mild cognitive impairment predicts subsequent cognitive decline. J Neurol Neurosurg Psychiatry. 2008 Jun;79(6):630–635. doi: 10.1136/jnnp.2007.124149. [DOI] [PMC free article] [PubMed] [Google Scholar]
- 6.Sperling RA, Bates JF, Chua EF, et al. fMRI studies of associative encoding in young and elderly controls and mild Alzheimer’s disease. J Neurol Neurosurg Psychiatry. 2003 Jan;74(1):44–50. doi: 10.1136/jnnp.74.1.44. [DOI] [PMC free article] [PubMed] [Google Scholar]
- 7.Sperling RA, Bates JF, Cocchiarella AJ, Schacter DL, Rosen BR, Albert MS. Encoding novel face-name associations: a functional MRI study. Hum Brain Mapp. 2001 Nov;14(3):129–139. doi: 10.1002/hbm.1047. [DOI] [PMC free article] [PubMed] [Google Scholar]
- 8.Rombouts SA, Barkhof F, Van Meel CS, Scheltens P. Alterations in brain activation during cholinergic enhancement with rivastigmine in Alzheimer’s disease. J Neurol Neurosurg Psychiatry. 2002 Dec;73(6):665–671. doi: 10.1136/jnnp.73.6.665. [DOI] [PMC free article] [PubMed] [Google Scholar]
- 9.Rombouts SA, Goekoop R, Stam CJ, Barkhof F, Scheltens P. Delayed rather than decreased BOLD response as a marker for early Alzheimer’s disease. Neuroimage. 2005 Jul 15;26(4):1078–1085. doi: 10.1016/j.neuroimage.2005.03.022. [DOI] [PubMed] [Google Scholar]
- 10.Golby A, Silverberg G, Race E, et al. Memory encoding in Alzheimer’s disease: an fMRI study of explicit and implicit memory. Brain. 2005 Apr;128(Pt 4):773–787. doi: 10.1093/brain/awh400. [DOI] [PubMed] [Google Scholar]
- 11.Johnson SC, Schmitz TW, Moritz CH, et al. Activation of brain regions vulnerable to Alzheimer’s disease: The effect of mild cognitive impairment. Neurobiol Aging. 2005 Oct 11; doi: 10.1016/j.neurobiolaging.2005.09.017. [DOI] [PMC free article] [PubMed] [Google Scholar]
- 12.Lustig C, Buckner RL. Preserved neural correlates of priming in old age and dementia. Neuron. 2004 Jun 10;42(5):865–875. doi: 10.1016/j.neuron.2004.04.002. [DOI] [PubMed] [Google Scholar]
- 13.Goekoop R, Scheltens P, Barkhof F, Rombouts SA. Cholinergic challenge in Alzheimer patients and mild cognitive impairment differentially affects hippocampal activation--a pharmacological fMRI study. Brain. 2006 Jan;129(Pt 1):141–157. doi: 10.1093/brain/awh671. [DOI] [PubMed] [Google Scholar]
- 14.Greicius MD, Srivastava G, Reiss AL, Menon V. Default-mode network activity distinguishes Alzheimer’s disease from healthy aging: evidence from functional MRI. Proc Natl Acad Sci U S A. 2004 Mar 30;101(13):4637–4642. doi: 10.1073/pnas.0308627101. [DOI] [PMC free article] [PubMed] [Google Scholar]
- 15.Lustig C, Snyder AZ, Bhakta M, et al. Functional deactivations: change with age and dementia of the Alzheimer type. Proc Natl Acad Sci U S A. 2003 Nov 25;100(24):14504–14509. doi: 10.1073/pnas.2235925100. [DOI] [PMC free article] [PubMed] [Google Scholar]
- 16.Petrella JR, Prince SE, Krishnan S, Husn H, Kelley L, Doraiswamy PM. Effects of donepezil on cortical activation in mild cognitive impairment: a pilot double-blind placebo-controlled trial using functional MR imaging. AJNR Am J Neuroradiol. 2009 Feb;30(2):411–416. doi: 10.3174/ajnr.A1359. [DOI] [PMC free article] [PubMed] [Google Scholar]
- 17.Goekoop R, Rombouts SA, Jonker C, et al. Challenging the cholinergic system in mild cognitive impairment: a pharmacological fMRI study. Neuroimage. 2004 Dec;23(4):1450–1459. doi: 10.1016/j.neuroimage.2004.08.006. [DOI] [PubMed] [Google Scholar]
- 18.Grady CL, McIntosh AR, Beig S, Keightley ML, Burian H, Black SE. Evidence from functional neuroimaging of a compensatory prefrontal network in Alzheimer’s disease. J Neurosci. 2003 Feb 1;23(3):986–993. doi: 10.1523/JNEUROSCI.23-03-00986.2003. [DOI] [PMC free article] [PubMed] [Google Scholar]
- 19.Small SA, Perera GM, DeLaPaz R, Mayeux R, Stern Y. Differential regional dysfunction of the hippocampal formation among elderly with memory decline and Alzheimer’s disease. Ann Neurol. 1999 Apr;45(4):466–472. doi: 10.1002/1531-8249(199904)45:4<466::aid-ana8>3.0.co;2-q. [DOI] [PubMed] [Google Scholar]
- 20.Machulda MM, Ward HA, Borowski B, et al. Comparison of memory fMRI response among normal, MCI, and Alzheimer’s patients. Neurology. 2003 Aug 26;61(4):500–506. doi: 10.1212/01.wnl.0000079052.01016.78. [DOI] [PMC free article] [PubMed] [Google Scholar]
- 21.Remy F, Mirrashed F, Campbell B, Richter W. Verbal episodic memory impairment in Alzheimer’s disease: a combined structural and functional MRI study. Neuroimage. 2005 Mar;25(1):253–266. doi: 10.1016/j.neuroimage.2004.10.045. [DOI] [PubMed] [Google Scholar]
- 22.Rombouts SA, Barkhof F, Veltman DJ, et al. Functional MR imaging in Alzheimer’s disease during memory encoding. AJNR Am J Neuroradiol. 2000 Nov-Dec;21(10):1869–1875. [PMC free article] [PubMed] [Google Scholar]
- 23.Gron G, Bittner D, Schmitz B, Wunderlich AP, Riepe MW. Subjective memory complaints: objective neural markers in patients with Alzheimer’s disease and major depressive disorder. Ann Neurol. 2002 Apr;51(4):491–498. doi: 10.1002/ana.10157. [DOI] [PubMed] [Google Scholar]
- 24.Bentley P, Driver J, Dolan RJ. Cholinesterase inhibition modulates visual and attentional brain responses in Alzheimer’s disease and health. Brain. 2008 Feb;131(Pt 2):409–424. doi: 10.1093/brain/awm299. [DOI] [PMC free article] [PubMed] [Google Scholar]
- 25.Shanks MF, McGeown WJ, Forbes-McKay KE, Waiter GD, Ries M, Venneri A. Regional brain activity after prolonged cholinergic enhancement in early Alzheimer’s disease. Magn Reson Imaging. 2007 Jul;25(6):848–859. doi: 10.1016/j.mri.2007.02.005. [DOI] [PubMed] [Google Scholar]
- 26.Saykin AJ, Wishart HA, Rabin LA, et al. Cholinergic enhancement of frontal lobe activity in mild cognitive impairment. Brain. 2004 Jul;127(Pt 7):1574–1583. doi: 10.1093/brain/awh177. [DOI] [PubMed] [Google Scholar]
- 27.Sperling R, Greve D, Dale A, et al. Functional MRI detection of pharmacologically induced memory impairment. Proc Natl Acad Sci U S A. 2002 Jan 8;99(1):455–460. doi: 10.1073/pnas.012467899. [DOI] [PMC free article] [PubMed] [Google Scholar]
- 28.Poldrack RA. Region of interest analysis for fMRI. Soc Cogn Affect Neurosci. 2007 Mar;2(1):67–70. doi: 10.1093/scan/nsm006. [DOI] [PMC free article] [PubMed] [Google Scholar]
- 29.Shrout PE, Fleiss JL. Intraclass correlations: uses in assessing rater reliability. Psychol Bull. 1979 Mar;86(2):420–428. doi: 10.1037//0033-2909.86.2.420. [DOI] [PubMed] [Google Scholar]
- 30.Cohen J. Statistical Power Analysis for the Behavioral Sciences. 2. Hillsdale, NJ: Lawrence Erlbaum; 1988. [Google Scholar]
- 31.Shrout PE. Measurement reliability and agreement in psychiatry. Stat Methods Med Res. 1998 Sep;7(3):301–317. doi: 10.1177/096228029800700306. [DOI] [PubMed] [Google Scholar]
- 32.Landis JR, Koch GG. The measurement of observer agreement for categorical data. Biometrics. 1977 Mar;33(1):159–174. [PubMed] [Google Scholar]
- 33.Nunnally JC. Psychometric Theory Second edition. 2. NY: McGraw-Hil Book Co; 1978. [Google Scholar]
- 34.Fleiss JL. Statistical Methods For Rates and Proportions ((chapter 13: The measurement of interrater agreement) 2. NY: John Wiley & Sons, Inc; 1981. [Google Scholar]
- 35.Clement F, Belleville S. Test-retest reliability of fMRI verbal episodic memory paradigms in healthy older adults and in persons with mild cognitive impairment. Hum Brain Mapp. 2009 Dec;30(12):4033–4047. doi: 10.1002/hbm.20827. [DOI] [PMC free article] [PubMed] [Google Scholar]
- 36.Putcha D, O’Keefe K, LaViolette P, et al. Reliability of fMRI Associative Encoding Memory Paradigm in Non-Demented Elderly Adults. Human Brain Mapping. doi: 10.1002/hbm.21166. in press. [DOI] [PMC free article] [PubMed] [Google Scholar]
- 37.Tariot PN, Farlow MR, Grossberg GT, Graham SM, McDonald S, Gergel I. Memantine treatment in patients with moderate to severe Alzheimer disease already receiving donepezil: a randomized controlled trial. JAMA. 2004 Jan 21;291(3):317–324. doi: 10.1001/jama.291.3.317. [DOI] [PubMed] [Google Scholar]
- 38.Wilcock GK, Lilienfeld S, Gaens E. Efficacy and safety of galantamine in patients with mild to moderate Alzheimer’s disease: multicentre randomised controlled trial. Galantamine International-1 Study Group. Bmj. 2000 Dec 9;321(7274):1445–1449. doi: 10.1136/bmj.321.7274.1445. [DOI] [PMC free article] [PubMed] [Google Scholar]
- 39.Jack CR, Jr, Slomkowski M, Gracon S, et al. MRI as a biomarker of disease progression in a therapeutic trial of milameline for AD. Neurology. 2003 Jan 28;60(2):253–260. doi: 10.1212/01.wnl.0000042480.86872.03. [DOI] [PMC free article] [PubMed] [Google Scholar]
- 40.Stern RG, Mohs RC, Davidson M, et al. A longitudinal study of Alzheimer’s disease: measurement, rate, and predictors of cognitive deterioration. Am J Psychiatry. 1994 Mar;151(3):390–396. doi: 10.1176/ajp.151.3.390. [DOI] [PubMed] [Google Scholar]
- 41.Atri A, Shaughnessy LW, Locascio JJ, Growdon JH. Long-term course and effectiveness of combination therapy in Alzheimer disease. Alzheimer Dis Assoc Disord. 2008 Jul-Sep;22(3):209–221. doi: 10.1097/WAD.0b013e31816653bc. [DOI] [PMC free article] [PubMed] [Google Scholar]
- 42.Doody RS, Pavlik V, Massman P, Rountree S, Darby E, Chan W. Predicting progression of Alzheimer’s disease. Alzheimers Res Ther. Feb 23;2(1):2. doi: 10.1186/alzrt25. [DOI] [PMC free article] [PubMed] [Google Scholar]
- 43.Jack CR, Jr, Petersen RC, Xu Y, et al. Rates of hippocampal atrophy correlate with change in clinical status in aging and AD. Neurology. 2000 Aug 22;55(4):484–489. doi: 10.1212/wnl.55.4.484. [DOI] [PMC free article] [PubMed] [Google Scholar]
- 44.Henneman WJ, Sluimer JD, Barnes J, et al. Hippocampal atrophy rates in Alzheimer disease: added value over whole brain volume measures. Neurology. 2009 Mar 17;72(11):999–1007. doi: 10.1212/01.wnl.0000344568.09360.31. [DOI] [PMC free article] [PubMed] [Google Scholar]
- 45.Jack CR, Jr, Bernstein MA, Borowski BJ, et al. Update on the magnetic resonance imaging core of the Alzheimer’s disease neuroimaging initiative. Alzheimers Dement. May;6(3):212–220. doi: 10.1016/j.jalz.2010.03.004. [DOI] [PMC free article] [PubMed] [Google Scholar]
- 46.Hua X, Lee S, Hibar DP, et al. Mapping Alzheimer’s disease progression in 1309 MRI scans: power estimates for different inter-scan intervals. Neuroimage. May 15;51(1):63–75. doi: 10.1016/j.neuroimage.2010.01.104. [DOI] [PMC free article] [PubMed] [Google Scholar]
Associated Data
This section collects any data citations, data availability statements, or supplementary materials included in this article.