Abstract
Two microparticle systems containing disodium cromoglycate (DSCG) alone or with polyvinyl alcohol (DSCG/PVA) were produced via spray drying and compared in terms of their physicochemical characteristics, aerosol performance and drug uptake across a pulmonary epithelial cell line (Calu-3), cultured under air interface conditions. The particle size distribution of DSCG and DSCG/PVA were similar, of spherical geometry, amorphous and suitable for inhalation purposes. Aerosolisation studies using a modified twin-stage impinger showed the DSCG/PVA to have greater aerosol performance than that of DSCG alone. Aerosol particles of DSCG and DSCG/PVA were deposited onto the surface of the Calu-3 air interface epithelium monolayer and the drug uptake from apical to basal directions measured over time. Drug uptake was measured across a range of doses to allow comparison of equivalent drug and powder mass deposition. Analysis of the data indicated that the percentage cumulative drug uptake was independent of the mass of powder deposited, but dependent on the formulation. Specifically, with the formulation containing DSCG, the diffusion rate was observed to change with respect to time (indicative of a concentration-dependent diffusion process), whilst DSCG/PVA showed a time-independent drug uptake (suggesting a zero-order depot release).
Key words: Calu-3, controlled release, disodium cromoglycate, dry powder inhaler, DSCG
INTRODUCTION
The controlled release of drug molecules at the respiratory epithelia is potentially advantageous for a local and systemic drug delivery. Currently, no commercial controlled-release inhalation therapy for respiratory disease management exists, although a once-a-day sustained-release ciprofloxacin formulation is currently undergoing clinical trial (1). The aforementioned formulation utilises liposomal encapsulation to ensure sustained drug release (2); however, many other strategies can be used to control drug release (3,4). These include drug encapsulation in synthetic polymeric microspheres, pro-drug formulation and incorporation in solid lipid or biodegradable excipients (3,4). Despite this, there is a lack of in vitro methodologies for studying the drug release profiles after particle aerosolisation and deposition onto the pulmonary epithelium, hence limiting comparisons between formulations (5).
In a recent study by Salama et al., the potential use of polyvinyl alcohol (PVA), a simple biodegradable polymer, for potential sustained release of the drug disodium cromoglycate (DSCG) from co-spray-dried microparticles was investigated (5,6). It was observed that polymeric microparticles which had similar sizes but produced significantly different release profiles when studied using a Franz diffusion cell could be produced (5). Interestingly, it was also demonstrated that pharmacopeia standard testing protocols, using conventional dissolution apparatuses (i.e. II and IV) (7) could not differentiate between the samples studied. Furthermore, spray-dried polymeric microparticles containing 90% (w/w) of PVA were shown to display sustained DSCG blood plasma levels in an ovine in vivo model after inhalation compared with control microparticles containing the drug only (8). Similar studies using inhalable PVA-containing solutions have shown sustained blood plasma levels of 5(6)-Carboxyfluorescein in a murine model when compared with drug alone (9), consistent with our findings.
Whilst in vivo studies can elucidate pharmacokinetic and pharmacodynamic data, they are time-consuming, expensive and require the use of animal models. Where possible, alternative in vitro techniques present a powerful means of predicting in vivo drug behaviour; however, the models used must mimic biological membranes. Specifically, these models should display similar barrier characteristics (physical and enzymatic) and similar surface landscape and membrane secretions (i.e. mucus or phospholipid) with that of the pulmonary epithelium in vivo.
For bronchiolar delivery, the Calu-3 carcinoma-derived cell line has been developed and validated as an appropriate model for the study of drug adsorption and uptake across the lung epithelium (10–16). Calu-3 cells possess a wide range of influx and efflux proteins (17), which have been shown to actively transport small-molecule solutes across the pulmonary epithelium (16,18). Furthermore, the cell line can be cultured in two configurations—as a liquid-covered model or as an air interface model—where the latter closely mimics airway epithelia with respect to cell differentiation, polarisation, the presence of microvilli and mucus secretion (13). In addition, the latter model can be incorporated into a modified in vitro impaction apparatus so that the deposition of representative aerosolised particle formulations can be evaluated (11,19,20). To evaluate drug transport kinetics in this study, dry powder formulations of respirable size were deposited onto the Calu-3 cellular model according to the assembly described by Grainger et al. (19).
Functioning as a mast cell stabiliser, DSCG has to permeate through the epithelial monolayer into the subepithelial mucosa in order to act on its target compartment. Therefore, as part of an ongoing study, we investigate the deposition of DSCG microparticles alone and as a controlled-release formulation containing PVA on an air interface Calu-3 model after aerosolisation from a conventional dry powder inhaler (DPI). Whilst the relative doses used in this study may not represent therapeutic doses of DSCG, this drug was chosen as a model since it displays a safe toxicity profile, can be readily detected in plasma and has poor oral bioavailability. In addition, the relative drug release and uptake profiles of each formulation with respect to the deposited particle mass and actual drug mass for the two formulations were investigated.
MATERIALS AND METHODS
Materials
DSCG was supplied by Sanofi-Aventis (Cheshire, England). PVA, with a molecular weight of ~22,000 and 98% degree of hydrolysis, was supplied by BDH Ltd. (Biolab, Victoria, Australia). Water used throughout the experiments was purified by reverse osmosis (Milli-Q, Sydney, Australia). All solvents were of analytical grade and were supplied by Sigma (Sydney, NSW, Australia). The Calu-3 cell line (HTB-55) was purchased from the American Type Cell Culture Collection (ATCC, Rockville, MD, USA). Dulbecco’s modified Eagle’s medium (without phenol red and l-glutamine, including sodium bicarbonate and 15 mM HEPES), non-essential amino acid solution, Trypan blue solution (0.4%, w/v), CelLytic™ M Cell Lysis (50 mM Tris–HCl, pH 8, 150 mM NaCl, 1% NP-40, 0.5% sodium deoxycholate, 0.1% SDS), fluorescein Na and mammalian protease inhibitor cocktail were obtained from Sigma-Aldrich (Sydney, Australia). Foetal bovine serum, trypsin–EDTA solution (2.5 g/L trypsin, 0.5 g/L EDTA), phosphate-buffered saline (PBS), l-glutamine solution (200 mM) and Hank’s balanced salt solution (HBSS) were from Invitrogen (Australia). Transwell cell culture supports (0.33-cm2 polyester, 0.4-μm pore size) were purchased from Corning Costar (Lowell, MA, USA); all other sterile culture plastic ware were obtained from Sarstedt (Adelaide, Australia).
Preparation of DSCG Microparticles
Polyvinyl alcohol was used as a model release agent since previous studies have shown this viscous vehicle to result in sustained release in vivo (8,9). Microparticles containing DSCG alone or with 90% (w/w) PVA were prepared following the methodology described previously (5,6,8). Briefly, solutions of DSCG or DSCG and PVA were spray-dried using a Büchi B-290 spray dryer (Büchi Mini Spray Dryer B-191, Flawil, Switzerland) using a twin-fluid coaxial atomizer under the following conditions: inlet temperature, 140°C; measured outlet temperature, 73–75°C; solution feed rate, 4 mL min−1; aspirator rate, 100%; and atomizing airflow, 700 L h−1. After spray drying, samples were stored in containers at 45% RH for a minimum of 48 h prior to use. The final spray-dried particles contained either 100% DSCG or 10% (w/w) DSCG with PVA. Dry powder yields were between 60% and 70%. The percentage w/w of DSCG in PVA was confirmed by a content uniformity assay of known masses of powder. Prior to use, both samples were stored in tightly sealed containers at 45% RH and 20°C. Unless otherwise stated, these two formulations are referred to as DSCG and DSCG/PVA, hereafter.
Physicochemical Characterisation of the DSCG and DSCG/PVA Microparticles
Prior to cell deposition studies, the two microparticulate systems were assessed for morphology, size and structure using laser diffraction, scanning electron microscopy, differential scanning calorimetry and X-ray diffraction. The aerosol properties of the two particle systems were studied using a twin-stage liquid impinger (as used in the cell deposition studies).
Particle size measurements of DSCG and DSCG/PVA were conducted using a Malvern Mastersizer 2000 with Scirocco dry dispersion unit (Malvern Instruments Ltd., UK). A feed pressure of 4 bar and a feed rate of 50% were used, and samples were measured when obscuration values fell between 0.5% and 5%. All samples were analysed in triplicate over 10-s intervals. Refractive indices of 1.55 and 1.68 were used for PVA and DSCG, respectively. Both samples were tested in triplicate. The morphology of DSCG and DSCG/PVA microparticles were studied using a Zeiss Ultra plus field emission scanning electron microscope operating at 5 keV (Zeiss GmbH, Germany). Prior to imaging, samples were mounted on carbon sticky tabs and gold-coated to ~10-nm thickness (Edwards E306A sputter coater, UK). The thermal response of the DSCG and DSCG/PVA microparticles were analysed using an 823e DSC (METTLER TOLEDO International Inc.) at a heating rate of 10°C min−1 between 20°C and 300°C. Samples (approx. 5–8 mg) were crimp-sealed in aluminium sample pans and the lids pierced (constant pressure). Measurements were conducted under an inert N2 gas stream (25 cm3 min−1) and the instrument calibrated with a standard indium sample prior to use. The crystallinity of DSCG, DSC/PVA and PVA was studied using a Siemens D5000 diffractometer (Siemens, Karlsruhe, Germany) using a scan range of 5–35° 2θ, step size of 0.05° 2θ, temperature of 25°C and radiation, 40 keV and 30 mA.
The aerosol performance of DSCG and DSCG/PVA was evaluated using the twin-stage impinger (TSI) as described in the British Pharmacopeia (21). The TSI contains a glass throat, upper stage 1 and lower stage 2, that when operated at 60 L min−1 separates the aerosol cloud into particles with an aerodynamic diameter ≤6.4 μm, approximating to a size predominantly for bronchiolar deposition reported as being between 2.5 and 6 μm (22). Whilst particle cutoff diameter and regional lung deposition are not precise, in an anatomical sense, these pharmacopeia approaches still give some indication of regional lung deposition. Prior to testing, 7 mL of water was added to stage 1 of the TSI and stage 2 was modified as described previously to accommodate a Transwell assembly (19). The TSI was adjusted to a flow rate of 60 L min−1 using a rotary vein pump and solenoid timer (Copley Scientific, Nottingham, UK) in combination with a calibrated flow meter (TSI, 4000 series, Buckinghamshire, UK) to which an Aerolizer® DPI device (Novartis, Surrey, UK) was attached to the inlet of the flow meter to account for the pressure drop across the device.
For aerosol characterisation studies, 5 mg of powder was loaded into size 3 hydroxypropyl methylcellulose capsules (Capsugel®, NSW, Australia) which were subsequently placed in a Aerolizer® DPI. The capsule was pierced and the DPI formulation was aerolised at 60 L min−1 for a 4 s. After each experiment, the device (including capsule), TSI stages and empty Transwell were washed with water into suitable volumetric flasks. For samples containing PVA, the sample was subsequently heated to 90°C to ensure that remaining PVA was solubilised and all drug released.
The concentration of drug from the aerosolisation and cell studies was quantified using reversed-phase high-performance liquid chromatography (HPLC) using a Shimadzu ULFC system (Shimadzu, Tokyo, Japan). A 250 × 4.60-mm Luna 5 μm NH2 (100-Å pore size) packed column (Phenomenex, Australia) was used with a mobile phase consisting of 350 mL (4.5 g KH2PO4 in 350 mL H2O) and 650 mL acetronitrile adjusted to pH 3.2 with H3PO4. The flow rate was 1.5 mL min−1 and DSCG was detected at a UV wavelength of 240 nm. Standards were prepared in HBSS and linearity was measured between 0.1 and 20 μg mL−1 with a retention time of approximately 6 min.
Air Interface Calu-3 pulmonary epithelium model
The culture conditions for the Calu-3 cell air interface model were as previously described (16). Briefly, cells were initially grown and subcultured in 75-cm2 flasks in Dulbecco’s modified Eagle’s medium (F-12 containing 10% (v/v) foetal calf serum, 1% (v/v) non-essential amino acid solution and 1% (v/v) l-glutamine solution) in a humidified 95% air 5% CO2 atmosphere at 37°C. Cells were seeded in 24-well Transwell polyester inserts (Corning Costar) at a density of 5 × 10⁵ cells cm−2 with 100 μL apical and 500 μL basolateral medium.
The apical medium was removed after 24 h and the basolateral medium replaced every alternate day with fresh medium to establish an air interface model over 12–14 days. After 12 days, the transepithelial electrical resistance (TEER) of the monolayer was evaluated using a Voltohmmeter (EVOM with STX-2 chopstick electrodes, World Precision Instruments, FL, USA). To perform this, pre-warmed medium was added to the apical and basolateral chambers of Transwell to equilibrate the monolayer for 30 min prior to measurements and corrected against a blank insert. The same procedure was conducted at the end of each drug deposition/uptake experiment to confirm monolayer integrity. The TEER prior to the study was 445.70 ± 35.98 Ω cm2, and no significant difference was observed at the end of the deposition test period for both formulations at an equivalent drug mass (approx. 20 mg; 419.10 ± 39.58 and 429.84 ± 14.73 Ω cm2 for DSCG and DSCG/PVA, respectively).
Cell viability measurements prior to and following deposition were also conducted to ensure the viability of the pulmonary epithelium. Briefly, cells were harvested and viability assessed using Trypan blue dye exclusion (23). The% cell viability was calculated as the number of viable cells after drug deposition relative to control cells following a sham deposition (i.e. aerosolisation testing with air only). No significant difference in cell viability was observed for all experiments (data not shown).
Drug Aerosol Deposition and Uptake Studies
The aerosolisation and deposition of drug onto the air interface model was conducted in a similar manner to the TSI studies described previously (19). Briefly, the method followed that of Grainger et al., where the TSI was modified to incorporate the Transwell insert at the stage 2 jet assembly (no liquid was added to stage 2). At 60 L min−1, particles deposited on the Transwell had an aerodynamic diameter ≤6.4 μm, equivalent to particles that would be deposited in the bronchiolar region of the lung.
The amount of formulation added to the capsule prior to the study was randomised between 1 and 5 mg to allow the study of both deposited drug mass and formulation mass (i.e. including the PVA component). After actuation, the TSI was disassembled and the Transwell removed. Particles adhering to the outer surface of the Transwell were washed away and the Transwell wall dried before transferring to a 24-well plate containing 600 μL of fresh pre-warmed HBSS (at 37°C).
At set time points, the Transwell was moved to a well containing fresh HBSS to study the diffusion/transport of the drug particles over time. After 4 h, the surface of the monolayer was washed with HBSS and collected for the analysis of residual apical drug (this volume was heated to 90°C to ensure solubilisation of remaining PVA and dissolution of DSCG). The cells were harvested, washed three times with ice-cold PBS and lysed using cell lysis buffer containing 1% protease inhibitor cocktail so that drug remaining in the cells could be quantified. The cells were sheared using a 21-gauge needle and left on ice for 1 h following centrifugation at 10,000×g for 10 min. The supernatant was collected for HPLC analysis. The initial amount deposited on the cell surface was calculated from the sum of the amount of drug which had passed across the cell monolayer, the mass remaining on the monolayer at the end of the experiment and the drug inside the cells.
Statistical analysis
Data were analysed for statistical significance using the SPSS Statistics 17.0 software package (SPSS Inc., Chicago, IL, USA). One-way ANOVA (with Tukey’s post hoc analysis) was utilised to test for significance. Differences were considered significant when p < 0.05.
RESULTS
Physicochemical Characterisation of the DSCG and DSCG/PVA Microparticles
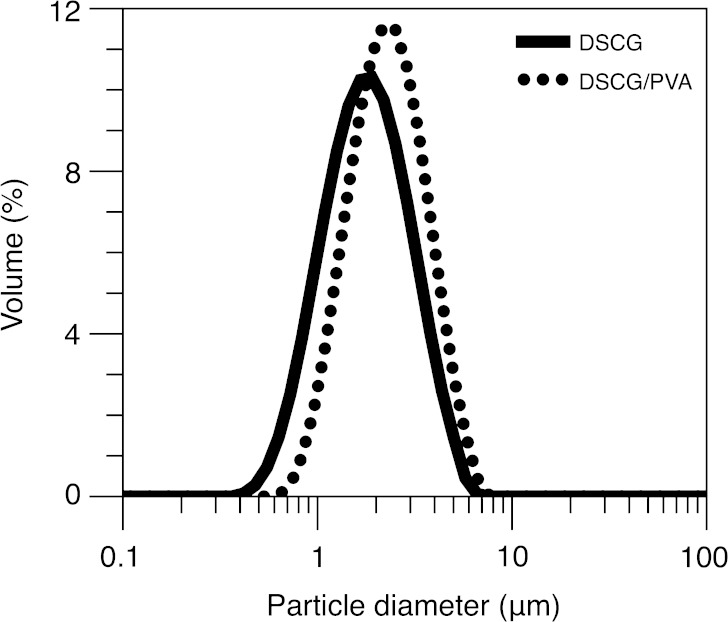
Particle size distributions for the DSCG and DSCG/PVA microparticles are shown in Fig. 1. Analysis of the data shows that both powders have similar volumetric particle size distributions, with 90% of the DSCG and DSCG/PVA particles having diameters ≤3.2 and 3.8 μm, respectively. In addition, the median diameters (d0.5) of DSCG and DSCG/PVA were 1.66 and 2.13 μm, respectively.
Fig. 1.
Particle size distributions of the DSCG and DSCG/PVA microparticles
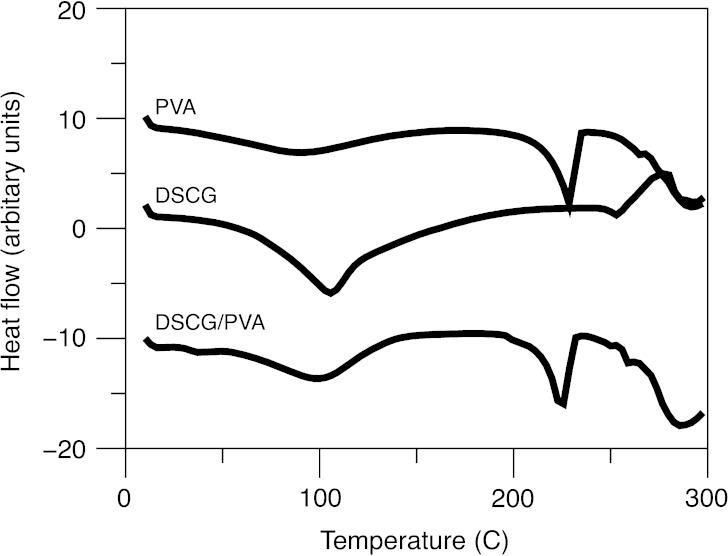
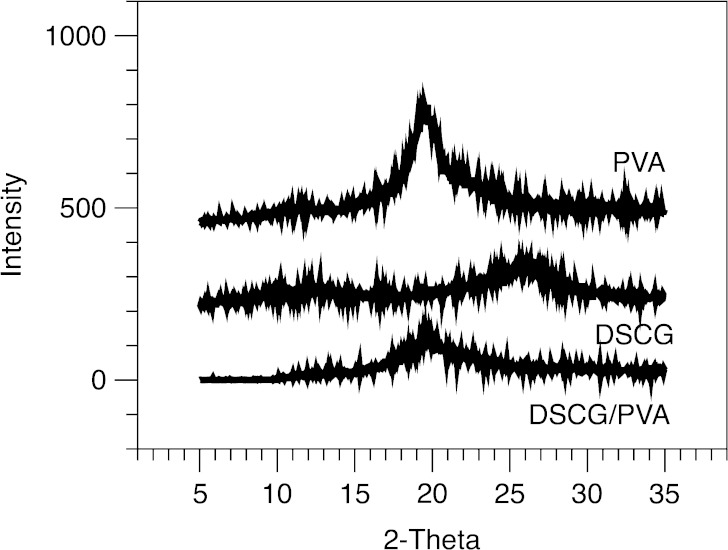
Representative scanning electron microscopy images of the DSCG and DSCG/PVA microparticles are shown in Fig. 2a, b, respectively. In general, observations are in good agreement with previous studies by Salama et al. (6). Both particulate systems are spherical in shape, with the DSCG/PVA having a smooth morphology in comparison to the partially corrugated DSCG alone. The thermal response of DSCG and DSCG/PVA microparticles, as well as PVA alone, is shown in Fig. 3. DSCG exhibited a single broad endothermic peak between 50°C and 100°C characteristic of water loss followed by an exothermic peak onset at around 250°C related to thermal decomposition (24). PVA alone showed a similar broad endothermic response related to water loss; however, in addition, a sharp endothermic peak was observed around 225°C that could be attributed to melting (25). The thermal response of DSCG/PVA samples exhibited components of both DSCG and PVA alone. X-ray powder diffraction patterns for DSCG, DSCG/PVA and PVA alone are shown in Fig. 4 (XRPD), where all three samples showed relatively diffuse peaks indicative of amorphous material. The lack of long-range order in both particle systems as well as the similarity in particle diameter and shape allow comparison of the aerosol performance and epithelial uptake after deposition on the air interface Calu-3 cell line. It is envisaged that since the two components in the DSCG/PVA formulation are spray-dried from a single solution, the particulate system will be relatively homogenous in nature (with the majority of each particle containing PVA). Further studies should be conducted to study the regional location of each formulation component; however, current techniques, such as Raman microscopy, do not have sufficient resolution.
Fig. 2.
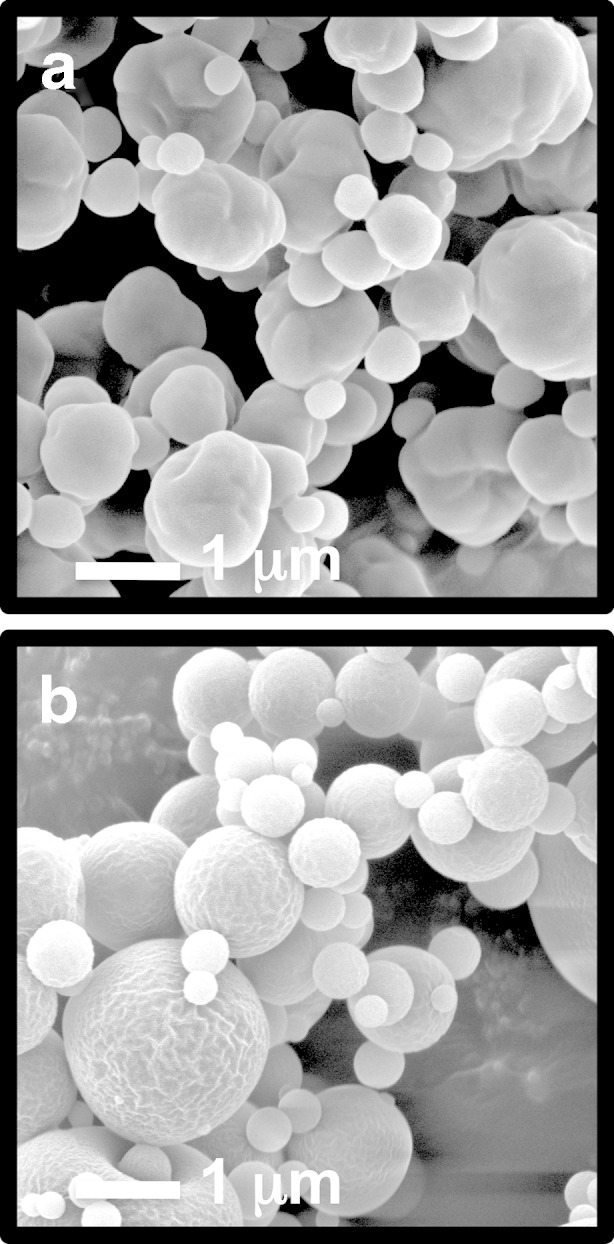
Scanning electron microscopy images of DSCG (a) and DSCG/PVA (b) microparticles
Fig. 3.
Differential scanning calorimeter scans of heat flow in PVA, DSCG and DSCG/PVA microparticles
Fig. 4.
X-ray diffraction patterns for the PVA, DSCG and DSCG/PVA microparticles
The aerosolisation performance of the DSCG and DSCG/PVA microparticles was studied using the modified TSI (in the absence of cells cultured on the Transwell insert). Drug recovered from the device, all stages of the TSI and Transwell insert indicated 8.7 ± 0.7% of the DSCG and 18.1 ± 3.3% of the DSCG/PVA had an aerodynamic diameter ≤6.4 μm (based on a 5-mg loaded capsule dose). Such observations suggest that the DSCG/PVA system was less cohesive and thus had improved de-agglomeration during the aerosolisation process. Previous studies by Salama et al., (6) reported similar ranking (where 16.71 ± 0.73% of DSCG and 30.76 ± 1.5% of DSCG/PVA had an aerodynamic diameter ≤5 μm, when using a Marple Miller impactor). In this previous study, the aerosolisation performance of both systems were higher; however, this may be due to variations in particle size between the studies as well as a higher loaded powder mass in the DPI capsule (i.e. 30 mg). In the current study, much smaller quantities of powder are required (an order of magnitude less than in previous studies to avoid overloading the cell line), and thus it is proposed that higher capsule and device wall losses are observed. Indeed, the capsule and device losses for 5 mg of powder loaded into the Aerolizer were 28.3 ± 1.3% and 31.7 ± 5.3% for DSCG and DSCG/PVA, respectively.
Analysis of the stage deposition data, capsule and device recovery indicated that 100 ± 10% of the loaded dose was recovered across all stages (indicating good mass balance). The drug recovered on the Transwell assembly was a percentage of the total fine particle dose. For the 3-mg formulations, 15.71 ± 1.43% (DCSG) and 11.02 ± 0.80% (DSCG/PVA) of the total recovered from stage 2 were found on the Transwell.
It is important to note that during the cell studies, loaded doses ranging from 1 to 5 mg were used. Whilst similar deposition percentages would be expected to that of the TSI measurements conducted above, variations may occur. Subsequently, the total amount of drug deposited on the cell line was calculated at the end of each experiment to determine the mass of drug and total powder mass that were deposited on the cells in each Transwell.
Drug Aerosol Deposition and Uptake on an Air Interface Epithelial Cell Line
When considering drug dissolution/diffusion and uptake at the lung epithelia from microparticles containing different ratios of excipients, it is important to consider the total mass of powder deposited and the mass of drug deposited independently since both may influence the release of drug at the lung epithelia. In order to study this, a range of DPI capsule loaded doses were studied which resulted in an approximately equivalent drug deposition and equivalent powder mass deposition on the Calu-3 cell line after aerosolisation. Total mass of drug deposited on the epithelial cell line monolayer ranged from 3.1 to 79.1 μg for the loaded doses of 1 mg DSCG/PVA and 3 mg DSCG, respectively. Total drug mass deposited on the cell line was based on the cumulative mass recovered from the basal compartment plus the remaining drug recovered from the apical compartment of the Transwell at the conclusion of the experiment (4 h). No intracellular drug was detected using cell lysates.
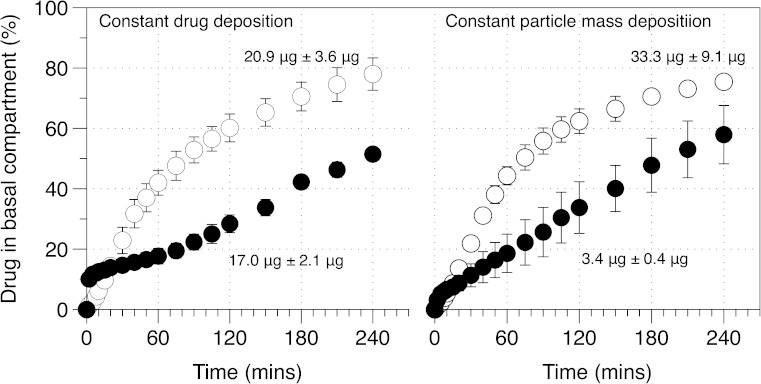
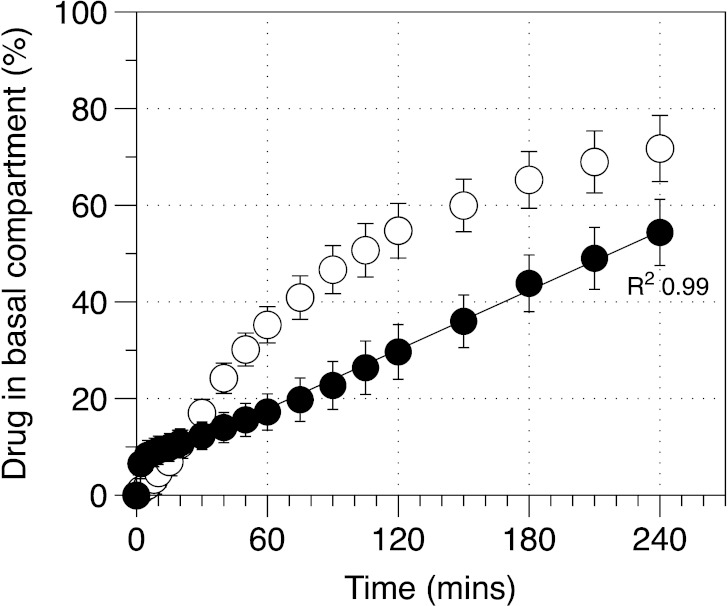
Figure 5 shows drug uptake into the basal compartment after deposition of equivalent drug or powder mass on the surface of the pulmonary epithelial monolayer. Analysis of the percentage DSCG drug uptake for formulations containing 20.9 ± 3.6 μg (from the DSCG formulation) or 17.0 ± 2.1 μg (from the DSCG/PVA formulation) indicated different uptake profiles. Specifically, the DSCG alone presented a profile that appeared to be dependent on concentration since the amount transported, per unit time, decreased as the experiment proceeded. In comparison, the DSCG/PVA formulation presented an initial ‘burst’ release followed by a profile that was linear with time. Statistical analysis of the data set indicated the cumulative drug amount in the basal chamber to be significantly different between formulations at all time points after 30 min. Analysis of the uptake for formulations with constant mass indicated similar findings, where the uptake of DSCG alone appeared to be dependent on apical drug concentration whilst DSCG uptake from the DSCG/PVA appeared to be linear with respect to time. Direct comparison of constant drug and mass deposition data indicated similar profiles with no difference in drug released following the 4-h analysis period. Such observations indicate that drug uptake is dependent on the formulation matrix rather than the mass of powder or amount of drug deposited.
Fig. 5.
Drug diffusion/uptake (apical to basal) across the air interface epithelia model as a function of constant drug mass or constant formulation mass deposited on cell surface. Open circles, DSCG; closed circles, DSCG/PVA (n = 3, mean±SD)
To further study the mechanism of drug uptake across the epithelial cell line, the data across all deposited doses, for each formulation, were pooled and are represented in Fig. 6. Analysis of the data from Fig. 6 suggested that the mechanism of drug dissolution/diffusion and uptake across the epithelia was dependent on the formulation type. To further study this, the mean cumulative percentage mass transport of both DSCG and DSCG/PVA was analysed using conventional models for drug dissolution and diffusion processes. The specific methods chosen were zero-order release, first-order release, Hixon–Crowell dissolution and Higuchi diffusion models (5). To negate the initial burst effect observed in the DSCG/PVA system, regression analysis of each of these models excluded the first 10-min data segment.
Fig. 6.
Linear regression of drug diffusion/uptake (apical to basal) expressed as per cent of total drug deposited through the air interface epithelia model. Data pooled from multiple measurements across a series of drug doses ranging from 17 to 80 μg for DSCG (open circles, n = 9, mean±SD) and 3–20 μg for DSCG/PVA (closed circles, n = 9, mean±SD). Curved and straight regression lines represent analysis of Higuchi and zero-order model fits, respectively
From the models described previously, regression analysis of the two formulations indicated the DSCG data to best fit the Higuchi diffusion model:
 |
1 |
where Ct is the cumulative concentration at time t and kH is the Higuchi rate constant.
In comparison, the DSCG/PVA data fit the zero-order equation:
 |
2 |
Regression analysis of the square route of time vs. cumulative basal drug concentration suggested a good correlation for the DSCG alone, where an R2 value of 0.991 was observed (R2 values for the other models using DSCG alone were ≤0.951). Subsequently, it may be concluded that the uptake of DSCG follows the Higuchi model and is subsequently driven by a diffusion process. In comparison, analysis of the DSCG/PVA formulation indicated the best fit to be a plot of cumulative percentage uptake vs. time (R2 = 0.998), suggesting a zero-order process. It may be concluded that the most likely mechanism for uptake in the DSCG/PVA system is attributed to a reservoir drug matrix where the drug concentration presented in solution at the epithelia is constant and independent of time.
DISCUSSION
Conventional in vitro approaches are generally designed to study the dissolution and absorption of drug from a liquid sink. In comparison, the lung has a high surface area (approx. 100 m2) with regional variation in cell structure and surface secretion. Depending on the regional deposition of drug in the airways, a drug particle may encounter bronchiolar pseudo-stratified epithelia with a mucus blanket and cilia escalator or alveoli with a thin phospholipid lining with thickness in the order of nanometres (26). For conventional asthma medicines, the former scenario is most appropriate for study as bronchial constriction primarily occurs in this upper region of the lung, making the Calu-3 epithelial model suitable for the study of drug deposition and uptake.
Drug amounts delivered to the lung are generally lower than the amounts given orally (micrograms as opposed to milligram drug masses). Respiratory drug deposition at the lung epithelia is thus likely to be discrete in nature, where an individual drug particle is deposited at a discrete location above a cell or cell cluster. Interestingly, the cell diameter and mucus coating is of equivalent diameter to that of the drug particle (1–10 μm), making comparison with conventional non-cell-based in vitro methodologies, such as the USP Apparatus II and Apparatus IV, which contain larger volumes, difficult.
The volume of liquid at the respiratory epithelia is very small (of equivalent thickness to the diameter of the deposited particles). Thus, for soluble drugs/formulations, the flux across the respiratory epithelia (flow per unit area) will be dependent on the total mass delivered since the solubility in the mucus layer will have localised saturated drug concentrations in regions where the drug is deposited. Assuming particles are deposited evenly across the cell line, an increase in deposited dose will result in an increase in flux. The result of such observations is that the percentage uptake (based on deposited dose) will remain constant. Such observations are observed in the experimental data reported here where drug uptake appears to be dependent on the cell and formulation properties.
For the DSCG particle system, the drug is likely to dissolve very rapidly in the epithelial mucus and diffuse through the cell line. DSCG is a nematic liquid crystal and subsequently has no solubility limit (27,28). Since the local concentration in the mucus compartment will constantly decrease, the rate will be dependent on apical concentration directly above the cell. Thus, a diffusion phenomenon was observed with respect to apical–basal uptake.
In the DSCG/PVA system, the drug is incorporated into a higher molecular weight polymer matrix that has poorer solubility than the drug. Upon impaction on the epithelial surface, it is expected that the PVA component ‘gels’ result in a controlled release of DSCG from the polymer matrix. In this case, the rate of drug release from the matrix into the mucus layer is slower than the rate of cellular uptake, resulting in an apparent zero-order process. Such hypothesis for both drug systems fit well with observations using the Calu-3 cell line; however, it is important to note that this will be drug-specific and does not take into account chemical interactions between the formulation components and mucus, and/or the presence of active transport mechanisms that may be present within the cell line. Interestingly, recent work by Ong et al. (29) using the Calu-3 cell line and spray-dried ciprofloxacin formulations with/without PVA showed a more rapid uptake from the PVA system when compared with the drug alone.
Whilst this cell model appears to be able to differentiate between formulation behaviour, it remains to be seen whether observations observed using in vitro models correlate with observations in vivo. As discussed previously, inhaled particles containing DSCG incorporated into a PVA polymer matrix showed extended blood plasma levels in an ovine model when compared with drug alone (8).
The data presented here indicated that DSCG/PVA particles had an extended-release profile when compared with DSCG alone; however, the rate of apical–basal transport was far greater than that observed in the in vivo model. Direct comparison is difficult, however, since the amount of drug deposited during the ovine study was significantly higher than in the cell line. Of note is that blood plasma levels for the DSCG/PVA system in the ovine model remained relatively constant after the initial burst release. Such observations are in good agreement with the cell studies that showed constant drug uptake with respect to time in the DSCG/PVA system.
CONCLUSIONS
This study demonstrates the uptake of DSCG and DSCG/PVA formulation across the Calu-3 cell line cultured via an air–liquid model. Whilst a cell line cannot directly mimic the complex nature of the lung, it may provide an insight into the mechanistic nature of drug dissolution/diffusion and useful means of directly comparing inhalation formulations that differ structurally or incorporate release-modifying excipients. The thin layer of mucus that is present within this cell line clearly plays an important role in drug uptake; therefore, future studies should consider studying the mucus properties of this cell line in more detail.
In addition, it is important to consider the nature of the particles after deposition (i.e. agglomeration, crystallisation and gel formation). Future studies should consider methods of visualising particle deposition, structure and change with respect to time. However, to date, such techniques require cell fixing methods or the inclusion of fluorescent markers that will influence the experimental outcomes. Furthermore, other aspects, such as the presence of active influx and/or efflux transporters, as well as metabolising enzymes, should be investigated since they may play a rate-limiting role when epithelial surface liquid volumes are critical to drug absorption.
References
- 1.Bilton D, Bruinenberg P, Otulana B, Morishige R, Blanchard J, DeSoyza A, et al. Inhaled liposomal ciprofloxacin hydrochloride significantly reduces sputum Pseudomonas aeruginosa density in CF and non-CF bronchiectasis. Am J Respir Crit Care Med. 2009;179:A3214. [Google Scholar]
- 2.Taylor KMG, Taylor G, Kellaway IW, Stevens J. The influence of liposomal encapsulation on sodium cromoglycate pharmacokinetics in man. Pharm Res. 1989;6(7):633–636. doi: 10.1023/A:1015917918130. [DOI] [PubMed] [Google Scholar]
- 3.Salama R. Recent advances in controlled release pulmonary therapy. Curr Drug Deliv. 2009;6(4):404–414. doi: 10.2174/156720109789000546. [DOI] [PubMed] [Google Scholar]
- 4.Zeng XM, Martin GP, Marriott C. The controlled delivery of drugs to the lung. Int J Pharm. 1995;124(2):149–164. doi: 10.1016/0378-5173(95)00104-Q. [DOI] [Google Scholar]
- 5.Salama RO, Traini D, Chan H-K, Young PM. Preparation and characterisation of controlled release co-spray dried drug–polymer microparticles for inhalation 2: evaluation of in vitro release profiling methodologies for controlled release respiratory aerosols. Eur J Pharm Biopharm. 2008;70(1):145–152. doi: 10.1016/j.ejpb.2008.04.009. [DOI] [PubMed] [Google Scholar]
- 6.Salama R, Hoe S, Chan H-K, Traini D, Young PM. Preparation and characterisation of controlled release co-spray dried drug-polymer microparticles for inhalation 1: influence of polymer concentration on physical and in vitro characteristics. Eur J Pharm Biopharm. 2008;69(2):486–495. doi: 10.1016/j.ejpb.2007.12.019. [DOI] [PubMed] [Google Scholar]
- 7.Online databese Stationery Office. British Pharmacopoeia Volumes I & II, Part II, Official Standards, Solubility. London. 2011. http://www.pharmacopoeia.co.uk. Accessed 12 June 2011.
- 8.Salama R, Ladd L, Chan H-K, Traini D, Young P. Development of an in vivo ovine dry powder inhalation model for the evaluation of conventional and controlled release microparticles. AAPS J. 2009;11(3):465–468. doi: 10.1208/s12248-009-9125-0. [DOI] [PMC free article] [PubMed] [Google Scholar]
- 9.Yamamoto A, Yamada K, Muramatsu H, Nishinaka A, Okumura S, Okada N, et al. Control of pulmonary absorption of water-soluble compounds by various viscous vehicles. Int J Pharm. 2004;282(1–2):141–149. doi: 10.1016/j.ijpharm.2004.06.008. [DOI] [PubMed] [Google Scholar]
- 10.Foster KA, Avery ML, Yazdanian M, Audus KL. Characterization of the Calu-3 cell line as a tool to screen pulmonary drug delivery. Int J Pharm. 2000;208(1–2):1–11. doi: 10.1016/S0378-5173(00)00452-X. [DOI] [PubMed] [Google Scholar]
- 11.Bur M, Rothen-Rutishauser B, Huwer H, Lehr C-M. A novel cell compatible impingement system to study in vitro drug absorption from dry powder aerosol formulations. Eur J Pharm Biopharm. 2009;72(2):350–357. doi: 10.1016/j.ejpb.2008.07.019. [DOI] [PubMed] [Google Scholar]
- 12.Sporty JL, Horalkova L, Ehrhardt C. In vitro cell culture models for the assessment of pulmonary drug disposition. Expert Opin Drug Metab Toxicol. 2008;4(4):333–345. doi: 10.1517/17425255.4.4.333. [DOI] [PubMed] [Google Scholar]
- 13.Grainger C, Greenwell L, Lockley D, Martin G, Forbes B. Culture of Calu-3 cells at the air interface provides a representative model of the airway epithelial barrier. Pharm Res. 2006;23(7):1482–1490. doi: 10.1007/s11095-006-0255-0. [DOI] [PubMed] [Google Scholar]
- 14.Fernandes CA, Vanbever R. Preclinical models for pulmonary drug delivery. Expert Opin Drug Deliv. 2009;6:1231–1245. doi: 10.1517/17425240903241788. [DOI] [PubMed] [Google Scholar]
- 15.Mathias NR, Yamashita F, Lee VHL. Respiratory epithelial cell culture models for evaluation of ion and drug transport. Adv Drug Deliv Rev. 1996;22(1–2):215–249. doi: 10.1016/S0169-409X(96)00420-6. [DOI] [Google Scholar]
- 16.Haghi M, Young PM, Traini D, Jaiswal R, Gong J, Bebawy M. Time- and passage-dependent characteristics of a Calu-3 respiratory epithelial cell model. Drug Dev Ind Pharm. 2010;36(10):1207–1214. doi: 10.3109/03639041003695113. [DOI] [PubMed] [Google Scholar]
- 17.Endter S, Francombe D, Ehrhardt C, Gumbleton M. RT-PCR Analysis of ABC, SLC and SLCO drug transporters in human lung epithelial cell models. J Pharm Pharmacol. 2009;61(5):583–591. doi: 10.1211/jpp.61.05.0006. [DOI] [PubMed] [Google Scholar]
- 18.Forbes B, Ehrhardt C, Forbes B, Ehrhardt C. Human respiratory epithelial cell culture for drug delivery applications. Eur J Pharm Biopharm. 2005;60(2):193–205. doi: 10.1016/j.ejpb.2005.02.010. [DOI] [PubMed] [Google Scholar]
- 19.Grainger CI, Greenwell LL, Martin GP, Forbes B. The permeability of large molecular weight solutes following particle delivery to air-interfaced cells that model the respiratory mucosa. Eur J Pharm Biopharm. 2009;71(2):318–324. doi: 10.1016/j.ejpb.2008.09.006. [DOI] [PubMed] [Google Scholar]
- 20.Hein S, Bur M, Schaefer UF, Lehr C-M. A new pharmaceutical aerosol deposition device on cell cultures (PADDOCC) to evaluate pulmonary drug absorption for metered dose dry powder formulations. Eur J Pharm Biopharm. 2011;77(1):132–138. doi: 10.1016/j.ejpb.2010.10.003. [DOI] [PubMed] [Google Scholar]
- 21.Online databese Stationery Office. British Pharmacopoeia, Appendix XII C London. 2011. http://www.pharmacopoeia.co.uk. Accessed 01 June 2011.
- 22.Pritchard JN. The influence of lung deposition on clinical response. J Aerosol Med. 2001;14(1):S19–S26. doi: 10.1089/08942680150506303. [DOI] [PubMed] [Google Scholar]
- 23.Tolani S. A method for viable cell count. Method Cell Sci. 1975;1(1):37–38. [Google Scholar]
- 24.Xu Z, Mansour HM, Mulder T, McLean R, Langridge J, Hickey AJ. Dry powder aerosols generated by standardized entrainment tubes from drug blends with lactose monohydrate: 1. Albuterol sulfate and disodium cromoglycate. J Pharm Sci. 2010;99(8):3398–3414. doi: 10.1002/jps.22107. [DOI] [PubMed] [Google Scholar]
- 25.Jeong Kim S, Jun Park S, Young Kim I, Hee Lee Y, Kim SI. Thermal characteristics of poly(vinyl alcohol) and poly(vinylpyrrolidone) IPNs. J Appl Polym Sci. 2002;86(8):1844–1847. doi: 10.1002/app.11096. [DOI] [Google Scholar]
- 26.Patton JS, Byron PR. Inhaling medicines: delivering drugs to the body through the lungs. Nat Rev Drug Discov. 2007;6(1):67–74. doi: 10.1038/nrd2153. [DOI] [PubMed] [Google Scholar]
- 27.Hartshorne NH, Woodard GD. Mesomorphism in the system disodium chromoglycate–water. In: Molecular crystals and liquid crystals. Great Britain: Gordon and Breach Science Publishers; 1973. p. 343–68.
- 28.Chamipon JV, Meeten GH. Conformation of sodium cromolyn in aqueous solution using light scattering and magnetic birefringence. J Pharm Sci. 1973;62(10):1589–1595. doi: 10.1002/jps.2600621003. [DOI] [PubMed] [Google Scholar]
- 29.Ong H, Traini D, Bebawy M, Young P. Epithelial profiling of antibiotic controlled release respiratory formulations. Pharm Res. 2011;28:2327–2338. doi: 10.1007/s11095-011-0462-1. [DOI] [PubMed] [Google Scholar]


