

Abstract
The electroosmotic flow (EOF) rate in fused silica microchannels is experimentally found to decrease when trace quantities of salts containing the divalent cations Ca2+ and Mg2+ are added to a constant ionic strength background electrolytic solution (BGE) flowing in a channel having negatively charged walls. Moreover, the observed effect is quantitatively different for the two ions Ca2+ and Mg2+. Since electrostatic interactions are identical for ions of the same valence modeled as point charges, a description of the electric double layer (EDL) based on the Poisson-Boltzmann equation alone cannot account for these experimental observations. New experimental observations on electroosmotic flow in presence of Ca2+ and Mg2+ are reported in this work. A site binding model that accounts for the chemical interactions of the BGE ions with the silica surface is developed. The model predictions are in good agreement with the experimental observations on divalent cations as well as data from the literature on how properties such as pH and ionic strength affect electroosmotic flow rates for a BGE with monovalent cations.
Keywords: electroosmotic flow, electrical double layer, divalent ions, site binding model
1 Introduction
An electrolyte containing multivalent ions in contact with a silica (SiO2)- containing substrate such as quartz, glass or fused silica is a situation commonly encountered in separation science (Kirby & Hasselbrink, 2004), biomedical (Zheng et al., 2003), microfluidic (Sadr et al., 2004) and geological (Revil et al., 1999) applications. Previous research on the effect of divalent cations on a silica interface have indicated that even trace quantities of divalent cations can reduce the ζ–potential (Coreno & Sánchez, 2001; Pierre et al., 1990). In this work the effects of the divalent alkaline earth metal cations Ca2+ and Mg2+ on electroosmotic flow (EOF) are studied through a model of their electrostatic as well as chemical interactions (‘site binding’) with the silica surface. Mammen et al. (1997) appears to be the only study that uses a similar approach to model the effect of Ca2+ and Mg2+ on EOF.
Mammen et al. (1997) used a simple model of a silica surface groups (silanols) that either exist in a deprotonated state or undergo further chemical association with cations from the background electrolytic solution (BGE) solution to conclude that Ca2+ and Mg2+ associate with the silica surface to different degrees. The lower ζ–potentials observed for Ca2+ in comparison to Mg2+ was thought to be consistent with ‘chemical intuition’ based on the increase in polarizability (that leads to stronger Van der Waals interactions) and the decrease in hydrated ion radius in moving down Group II of the periodic table.
In this work, we utilize a more detailed and general picture of the silica-BGE interface than Mammen et al. (1997) that enables the model in this work to quantitatively account for the effect of other factors such as pH and ionic strength of the BGE on the ζ–potential and electroosmotic flow. Unlike Mammen et al. (1997), the model in this work accounts for both the substantial number of undissociated silanol groups on the silica surface and the adsorption of monovalent ions (Scales et al., 1992; Revil et al., 1999; Levine & Smith, 1971). The use of empirical ‘co-operativity coefficients’ between the surface-bound species (Mammen et al., 1997) is avoided. The site binding model in the current work is combined with the Poisson-Boltzmann equation -based electrostatic picture of the diffuse part of the EDL, while in Mammen et al. (1997) it is proposed as a substitute for the Poisson-Boltzmann equation. Finally, a different technique (velocimetry) is adopted for electroosmotic flow measurements than the neutral marker time measurement in capillary electrophoresis used by Mammen et al. (1997).
An approach for calculating the distribution of ions in the EDL using the Poisson-Boltzmann equation for the electric potential is valid only in the diffuse part of the EDL (Hunter, 1981). The chemical interactions of interest in this work occur, instead in the Stern layer, which is immediately adjacent to the silica surface. The Stern layer is characterized by a lower dielectric constant than in the bulk; the electrolyte ions and their surrounding interfacial water molecules are hydrodynamically immobile and interact with the silica surface through electrostatic as well as non-electrostatic forces (Lyklema, 1991). The Stern layer adsorption of the divalent cations Ca2+ and Mg2+ and the differences between each divalent cation are studied in this work and their role in reducing the electroosmotic mobility is characterized experimentally and theoretically. A site binding model is developed by postulating a set of surface adsorption equilibria for the divalent ion and other BGE ions that can explain the reduction in electroosmotic mobility observed in the experiments.
In Section 2, we introduce the governing equations required to interpret EOF measurements. In Section 3, we develop a theoretical model of the effect of divalent cations on the ζ–potential and the experimental methods are described in Section 4. Theoretical results are presented in Section 5 and compared with the experimental data in Section 6. The conclusions are presented in Section 7.
2 Governing Equations of Electroosmotic Flow in Microchannels
To generate electroosmotic flow, an external electric field E0 is applied to an aqueous electrolyte solution contained inside a straight microchannel of fused silica, glass or quartz with a length (∼ cm) several orders of magnitude larger than the cross-sectional dimensions (∼ μm). If φ is defined as the electric potential due to the EDL on the silica surface in absence of the electric field and u is the axial flow speed, it follows from Maxwell's equations (Probstein, 1989) and the fully-developed form of the steady-state Navier-Stokes equations that:
| (1a) |
| (1b) |
where ρe is the net volumetric charge density in the EDL. Here ∈e and μ are the electrical permittivity and the viscosity, of the electrolyte, respectively. The ζ–potential ζ is defined as the electric potential on the ‘shear plane’ dividing the immobile part (i.e. ‘Stern layer’) and the mobile part of the EDL. Equations (1a) and (1b) can be combined using this definition of the ζ–potential to obtain an expression for u as
| (2) |
Since φ ≃ 0 in the bulk of the electrolyte in the microchannel, the axial velocity is very nearly uniform in the bulk and decreases inside the EDL to a value of zero at the shear plane.
The characteristic thickness of the EDL as measured by the Debye length (Conlisk et al., 2002) at the lowest ionic strength I = 4.05 mM used in the experiments reported in this work is 4.8 nm whereas the smallest channel dimension is 41 μm, nearly four orders of magnitude greater the Debye length. Therefore, Equation (2) can be averaged across the microchannel width, ignoring the contribution to the flow rate of the region inside the EDL. This gives the average velocity as
| (3) |
Evanescent wave-based or nano-particle-image-velocimetry (nPIV) is used in this work to measure ū and calculate the electroosmotic mobility defined operationally as μeo = ū/E0. Use of this relation in Equation (4) gives
| (4) |
Equation (4) can be used to relate measured electroosmotic mobility value to the ζ–potential. The effect of Stern layer adsorption on the ζ–potential is modeled next.
3 Governing Equations of Stern Layer Adsorption
The electrolytic species of interest in this work that contribute to the surface charge of a silica surface are hydrogen ions, a monovalent cation M+, such as the sodium ion, a divalent cation N2+, such as the calcium or magnesium ions, and an anion from the BGE, X−. SH represents a surface-bound silanol group (a more concise notation instead of its ‘chemical formula’ SiOH) and S− the corresponding silanolate anion ((SiO−)) obtained on deprotonation of a silanol.
‘Site binding models’ (Kallay et al., 2006; Scales et al., 1992; Papirer, 2000; Levine & Smith, 1971) typically postulate the following reactions for the charge development on the silica-electrolyte interface in neutral to alkaline aqueous mediums:
| (5a) |
| (5b) |
The reaction represented by Equation (5b) can be viewed as an ion-exchange process leading to adsorption of M to form a neutral ionic silanolate species SM on the surface; this reaction is considered essential to realistically study the effect of so-called ‘indifferent’ cations such as sodium (Kirby & Hasselbrink, 2004; Scales et al., 1992)
No consensus exists in the literature on the general features of the stoichiometry, mechanism and even the identity and location of the surface groups formed in case of a divalent cation N2+ adsorbing to a mineral oxide surfaces in general and silica in particular (Papirer, 2000; Criscenti & Sverjensky, 1999; Kallay et al., 2006; Tadros & Lyklema, 1969). However, the following site binding reaction has been suggested (Criscenti & Sverjensky, 1999)
| (6) |
For many mineral oxide surfaces, the anion X− originates from a salt in the BGE; for silica OH− originating from interfacial water molecules has been considered a more appropriate choice for X− (Criscenti & Sverjensky, 1999; Dove & Craven, 2005; Kallay et al., 2006; Sverjensky, 2006). Two important features of this reaction are (a) the neutral species SNX does not affect the surface charge density to be neutralized by the diffuse layer. Further, in the case of silica, an alkaline medium (pH > 7) or an excess of X−≡OH− favors the formation of SNOH. For the last reason, this reaction has been considered to play an important role at moderate to high pH values (Pierre et al., 1990; Dove & Craven, 2005; Sverjensky, 2006).
As an alternative model for Stern Layer adsorption, a simple ion exchange process similar to Equation (5b) has also been considered appropriate for divalent cations (Düker et al., 1995; Dove & Craven, 2005)
| (7) |
Unlike Equation (5b) and (6), adsorption via Equation (7) causes the divalent ion to introduce a positive charge in the non-diffuse part of the EDL. This type of adsorption can even result in the reversal in the polarity of the surface charge (Pierre et al., 1990).
The law of mass action at equilibrium (Healy & White, 1978; Kallay et al., 2006) can be used to calculate the equilibrium constants for these reactions in the following manner
| (8a) |
| (8b) |
| (8c) |
| (8d) |
where y is a shorthand for the electrostatic factor exp (−ζF/RT). This electrostatic factor arises because electrochemical equilibrium, and not chemical equilibrium, has to be considered at a charged interface (Hunter, 1981); for a thermodynamic derivation of Equation (8), see Healy & White (1978). Square brackets and curly brackets denote surface concentration in mol/m2 and the activity (unitless) of a species, respectively We note here that the use of ζ–potentials in y is an approximation; see the appendix for more details on the significance of ζ, y and Ki in Equation (8).
The total number density of surface silanols (Ns) is a constant
| (9) |
where NA = 6.02 × 10²³ is Avogadro's number. The values commonly ascribed to Ns range between 4 – 10 × 1018/m2, or in other words, 4 – 10 silanol groups per nm2 of the silica surface (Iler, 1979; Papirer, 2000; Kirby & Hasselbrink, 2004).
The charge density neutralized by the diffuse layer is
| (10) |
Combining Equations (8), (9) and (10) gives
| (11) |
where {H+} = 10−pH. In Section 5, when dealing with experimental data from the literature obtained in a BGE containing only monovalent ions (Wiese et al., 1971), the surface charge density can be calculated from the theory of diffuse double layers when all ions in the solution are monovalent (Hunter, 1981)
| (12) |
where λ is the Debye length defined by Equation (12) is inserted in Equation (11) to derive a nonlinear equation for the ζ potential (or y) that can be solved numerically for ζ (or y) when all other parameters are specified. For theoretical predictions that deal with multivalent ions in Section 5 and the experimental comparison in Section 6, a Debye-Hückel linearization of Equation (12) is used:
| (13) |
Equation (13) is accurate only for low ζ–potentials (Conlisk et al., 2002); the surface charge densities calculated by Equation (12) and Equation (13) differ by 9.2% for the highest ζ–potential value recorded in the experiments reported in this work (ζ = −41 mV). This ζ–potential value corresponds to a sodium tetraborate solution of I = 10.8 mM with no divalent cations so that Equation (12) is applicable. Equation (12) and Equation (13) are combined to study the effect of divalent ion concentration on ζ.
4 Experimental Methods
Nano-particle image velocimetry (nPIV) was used to measure the electroosmotic flow velocity within about 400 nm of the wall in fused-silica microchannels with a depth of 41 μm and a width of 312 μm or 469 μm (nominal dimensions) and an overall length of about 35 mm (Figure 1, right). The electrolyte solutions were driven from the anode towards the cathode by DC electric fields E ranging from 0.3 kV/m to 2.1 kV/m. In all cases, the region imaged (Figure 1, left) is well downstream of any bends to ensure fully-developed flow.
Figure 1.
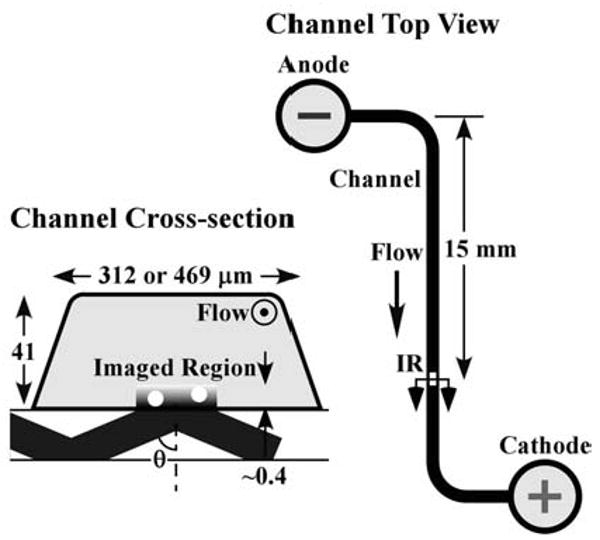
The imaged region for npIV measurements (left) and the channel geometry.
The fluids were seeded with fluorescent polystyrene spheres (Invitrogen FluoSpheres f-8888; absorption and emission maxima at 505 nm and 515 nm, respectively) of radius 50 nm (with a standard deviation of 6%) at a volume fraction of about 15 ppm. The fluorescent tracer particles were illuminated by evanescent waves generated using prism coupling of a 488 nm beam from an argon-ion laser (Coherent Innova 90) at maximum output power of 150 mW or less.
The penetration depth of the evanescent wave zp, or the 1/e length-scale for the decay of the evanescent-wave intensity, was about 100 nm based on an angle of incidence of about 71.5°. The red-shifted fluorescence from the tracers is imaged by an inverted epifluorescent microscope (Leica DMIRE2) with a 63× magnification, numerical aperture 0.7 objective (Leica PL Fluotar L) through a dichroic beamsplitter cube (Leica I3) and recorded by a CCD camera with on-chip multiplication gain (Photometrics Cascade 650) at a frame rate of 128 Hz with individual exposure times of 1 ms. Pairs of 100 × 653 pixels images (corresponding to a field of view of about 24 μm by 154 μm along the flow direction) with a temporal spacing Δt = 7.8 ms were processed using a FFT-based interrogation algorithm and a Gaussian surface-fitting peak-finding algorithm; relatively large interrogation windows of 180 × 60 pixels were used to minimize errors due to Brownian diffusion-induced particle mismatch within the image pair.
The velocities obtained here should correspond to bulk as well as the area averaged EOF velocity ū, since nPIV measures velocities within about 4zp of the wall, or 400 nm, and the Debye length for a I = 4.08 mM electrolyte solution is about 4.8 nm; for I = 10.8 mM the Debye length is smaller. The nPIV velocities obtained using these processing were averaged over 4000 image pairs and plotted as a function of the driving electric field E. Linear regression of these data gave the electroosmotic mobility μeo; the corresponding ζ–potential is obtained using Equation (4).
The working fluids used in this study are summarized in Table 1. Aqueous solutions of sodium tetraborate (Na2B4O7) (decahydrate salt, ACS reagent grade, Acros Organics) with small amounts of calcium chloride (CaCl2) (dihydrate salt, ACS reagent grade, EMD Chemicals Inc.) or magnesium chloride (MgCl2) (hexahydrate salt, ACS reagent grade, Fisher Scientific) and aqueous solutions of sodium chloride (NaCl) (ReagentPlus grade with 99.5% purity, Sigma Aldrich) with small amounts of CaCl2 or MgCl2. Stock solutions were prepared with Nanopure water (> 18.0 Ω − cm resistivity, Ricca Chemical Company). The pH values for the Na2B4O7 and NaCl solutions were measured to be 9.1 ± 0.1 and 5.7 ± 0.1 respectively. The NaCl solution is naturally buffered by atmospheric carbon dioxide (Butler, 1964).
Table 1.
Composition of divalent ion containing background electrolyte solutions used in the experiments. N2+ is Ca2+ or Mg2+ according as the BGE contains CaCl2 or MgCl2.
| Primary salt | Salt with divalent cation | (%) | I(mM) | |
|---|---|---|---|---|
| I | Na2B4O7 | - | 0 | 4.05 |
| II | Na2B4O7 | CaCl2 | 1 | 4.05 |
| III | Na2B4O7 | CaCl2 | 5 | 4.05 |
| IV | Na2B4O7 | CaCl2 | 8 | 4.05 |
| V | NaCl | - | 0 | 10.8 |
| VI | NaCl | CaCl2 | 1 | 10.8 |
| VII | NaCl | MgCl2 | 0 | 10.8 |
| VIII | NaCl | Mgcl2 | 1 | 10.8 |
| IX | NaCl | MgCl2 | 2 | 10.8 |
| X | NaCl | MgCl2 | 3 | 10.8 |
5 Results
In this section and for the remainder of this work, Ns will be prescribed a value of 4.8 silanol groups per nm2 (Raiteri et al., 1996). The prefix p (as in pH) before any quantity is used to indicate the operator −log10, e.g. pK1 = −log10K1; the smaller the K1, the larger the corresponding pK1. The two equilibrium constants of divalent cation adsorption (KN1 via Equation (6) and KN2 via Equation (7)) will be denoted generically by KN where the distinction is unimportant.
Figure 2 compares the site binding model predictions with the experimental data of Wiese et al. (1971) for ζ as a function of pH and salt concentration for aqueous solutions of the monovalent electrolyte potassium nitrate (KNO3). This validation of the model illustrates the effects of parameters such as pH and salt concentration on the ζ–potential in monovalent electrolyte solutions and demonstrates that the model in the current work is more versatile than that of Mammen et al. (1997) as the latter cannot be used to study the effect of pH. The figure shows that a more alkaline solution (higher pH) gives a higher ζ–potential magnitudes, at least for a monovalent BGE. The slight uptrend in the zeta potential for the theoretical curves for 0.1 KNO3 arises from an increase in ionic strength of the BGE that results when the pH of the solution is increased through addition of the base KOH, as in the experiments of Wiese et al. (1971). The ionic strength increase, which is particularly significant at low values of salt concentration and high pH values, provides better electrostatic screening to the surface charge resulting in a lower magnitude of ζ–potential. It is unclear why the same trend is not perceptible in the experimental data.
Figure 2.

Effect of pH and concentration on the ζ–potential in an aqueous solution of KNO3: comparison of the site binding model with experimental data from (Wiese et al., 1971). The site binding inputs were pK1 = 6.4, 6.25, 6.1 and pKM = 2.2, 3.1, 3.5 for 0.1,1,10 mM KNO3, respectively. Here M stands for K+.
Equations (6) and (7) signify two distinct modes of divalent cation adsorption and Equation (11) is valid when the two adsorption modes coexist. To understand the applicability of Equations (6) and (7) with respect to the experimental measurements in the work, each of these two adsorption modes will be studied in isolation by setting the equilibrium constant of the other to zero. In Figures 3 and 4, the independent variable is the concentration of the divalent cation which can be either Ca2+ or Mg2+ depending on whether the salt CaCl2 or MgCl2 is present in the BGE whose primary constituent is a monovalent salt such as NaCl. The pH of the BGE can be increased and decreased by adding bases (such as NaOH) and acids (such as HCl), respectively, in presence of suitable buffers to produce acidic and alkaline solutions, respectively.
Figure 3.

Theoretical prediction of the effect of the pH of the BGE on the ζ–potential vs. divalent cation concentration when adsorption follows (a) Equation (6) (KN2 = 0, pKN1 = 3.5) and (b) Equation (7) (KN1 = 0, pKN2 = −5.5). The same values of I = 4.05 mM, pK1 = 7.5 and pKM = 3 are used for either modes of adsorption.
Figure 4.

Theoretical prediction of the average EOF velocity vs. divalent cation concentration curve of Ca2+ and Mg2+ when adsorption occurs according to Equation (6) (left pane) and Equation (7) (right pane). The same values of I = 4.05mM, pK1 = 7.5 and pKM = 3 are used for either modes of adsorption.
In Figure 3 the effect of the pH of the solution on the adsorption of divalent cations is studied; the two panes correspond to the two different modes of adsorption processes described by Equation (6) and Equation (7). Note that there is no firm agreement in the literature (Pierre et al., 1990; Dove & Craven, 2005) on the dominant adsorption mechanism; Dove & Craven (2005) considers Equation (6) to be dominant at near neutral pH and Equation (7) to be dominant at alkaline pH values; Sverjensky (2006) uses Equation (7) at all pH.
The left pane of Figure 3 shows that the decrease in the ζ–potential due to adsorption of the divalent cations is greater in more alkaline solutions (at higher pH) if Equation (6) is the dominant mode of adsorption. Figure 3(a) also shows that the ζ–potential eventually saturates and changes in the polarity of ζ–potential is impossible via Equation (6). The right pane of Figure 3 is based on Equation (7) as the only mode of adsorption. In this case, the adsorption process is much less sensitive to pH.
In either pane of Figure 4, the average velocity of the EOF is plotted against the concentration of divalent cation. As suggested by Mammen et al. (1997) as well our experimental observation (described in the next section), the higher sensitivity of the ζ–potential to Ca2+ can be attributed to its higher degree of association with the silica. Therefore, a higher value of the equilibrium constant KN (lower pK1) is used for Ca2+ than for Mg2+ regardless of the dominant mode of adsorption.
In the left pane of Figure 4 corresponding to the adsorption mode in Equation (6), the average flow velocity suffers a sharp drop followed by saturation; the drop as well as the flow rate at saturation is larger for Ca2+. When adsorption takes place according to Equation (7) (right pane) the initial drop in average flow velocity is slower but the drop steepens with increasing divalent cation concentration. In fact, a reversal of flow direction is predicted. In either pane of Figure 4, the average velocity of EOF in a BGE containing Ca2+ is lower than that in a BGE containing Mg2+.
6 Experimental Comparison
The experimental ζ–potential values and the theoretical predictions from the site binding model are compared in Figure 5. Good agreement is obtained between model predictions and the experimental data using the site binding model parameter values indicated on the figure and the experimentally measured pH values 9.1 and 5.7 for the Na2B4O7 and NaCl solutions respectively.
Figure 5.

Effect of calcium and magnesium ions on the ζ–potential of sodium tetraborate: comparison of experimental and modeled values. The site binding model inputs are shown on the figure.
The data for the Na2B4O7 − CaCl2 system is consistent with adsorption according to Equation (6) whereas the data for NaCl − MgCl2 is consistent with adsorption according to Equation (7). The curves in Figure 5 with two data points (Na2B4O7 − MgCl2 and NaCl − CaCl2) can of course be fitted by either model of adsorption; the choices shown in Figure 5 are consistent with adsorption according to Equation (6) at a high pH value (Na2B4O7) and Equation (7) at a low pH value (NaCl) as supported by the literature (Pierre et al., 1990; Dove & Craven, 2005) and Figure 3. This also facilitates a direct comparison between the effects of Ca2+ and Mg2+ by assigning a fixed adsorption mode to a given BGE.
For a given adsorption mechanism, Ca2+ required lower pKN or higher KN than Mg2+. In the language of (Mammen et al., 1997), this corresponds to a lower ‘dissociation constant’ of the site bound product species (e.g. SiOHCa and SiOCa+) resulting from Equations (6) and (7).
A trial and error based curve-fitting procedure was adopted to obtain the equilibrium constants and the solid curves shown on Figure 5. Figure 6 makes a graphical assessment of the sensitivity of the calculated ζ–potentials to the equilibrium constant values chosen for divalent cation adsorption. Each pK value corresponding to divalent cation adsorption is changed by ±5% from their values in Figure 5 (i.e. the new values Knew for divalent cation adsorption are related to the corresponding old values Kold by ) to obtain the dashed curves, all other inputs to the model remaining fixed. The sensitivity of the ζ–potential in NaCl system (KN1 = 0) to KN2 increases with the divalent cation concentration; this effect is less significant for the Na2B4O7 system because no new charged groups are created in response to the increase in divalent cation concentration when KN2 = 0 and also because the surface charge saturates at high divalent cation concentration values (c.f. Equation (10) and Equation (11)). The highest percentage shift in ζ–potential at a concentration value populated by an experimental data point occurs at 0.04 mM Ca2+, i.e. for the second data point from left of the Na2B4O7 − CaCl2 system. A 27% decrease and 29% increase in the magnitude of the ζ–potential results from a 60% increase and decrease of , respectively. In terms of absolute changes, the originally predicted ζ–potential of −12.4mV (corresponding to an experimental ζ–potential is −10.4 mV) shifts to −9 mV and −16 mV, respectively, when the value increases and decreases to 104.305 and 103.895 from the value 104.1 shown in Figure 5, respectively. Although quantitatively significant deviations have appeared, the shape of the curves have the same qualitative features as the experimental data.
Figure 6.

The theoretically predicted zeta potential (dashed curves) when the pK value for divalent cation adsorption used in each of the solid curves of Figure 5 is changed by ±5% from the values shown in Figure 5, all other inputs to the model remaining unaltered from Figure 5. The solid curves and corresponding set of equilibrium constants are same as in Figure 5.
The sensitivity of ζ–potential values to other parameters can also be verified either graphically or by studying Equation (11) in combination with Equation (13). A change in K1 affects the zeta potential at zero divalent cation concentration and in general, produces deviations that are several times (but not an order of magnitude) larger at low divalent cation concentration values than seen in Figure 6. Therefore a precise knowledge of K1 is necessary for correct prediction of intercepts in a plot of ζ–potential with divalent cation concentration and similar plots with ionic strength and pH in monovalent BGE (Kirby & Hasselbrink, 2004; Revil et al., 1999). The effect of KM (monovalent cation adsorption) was found to be milder in terms of the dependence of ζ–potentials on the concentration of divalent cations than both KN and K1; this can be verified from Equation (11) and Table 1 by noting that KM affects the surface charge density through a term which is nearly independent of divalent cation concentration.
7 Conclusions
A new site binding model was developed and found to be in good agreement with experimental measurements on electroosmotic flow in this work. A phenomenological approach based on equilibrium constants of site binding reactions at the silica surface is adopted and both electrostatic and chemical interactions of the ions with the surface are incorporated. The different adsorption behavior of the two divalent cations Ca2+ and Mg2+ can be explained by the stronger association of Ca2+ to the silica surface.
It is found that the results from the CaCl2−Na2B4O7 system are best explained through Equation (6) while the results from the MgCl2 − NaCl system are well-explained by Equation (7). Unlike other models in the literature, the site binding model developed in this work can additionally be used to study the role of BGE properties and pH, both in the presence as well as the absence of divalent cations.
The intuitive reasons presented in Mammen et al. (1997) for the higher degree of association of calcium ions to the silica surface is consistent with the experimental ζ–potentials recorded at constant ionic strength NaCl solutions for Ca2+ and Mg2+ in this work, viz. the higher polarizability of Ca2+ leading to stronger Van der Waals interactions than Mg2+ as well as its smaller hydrated radius leading to closer distance of approach. Although the model here differs from that of Mammen et al. (1997), the higher degree of association of calcium still reflects as higher equilibrium constants KN required for Ca2+ in NaCl or Na2B4O7, vs. that for Mg2+ in NaCl.
The model developed in this work is essentially phenomenological because it requires empirically obtained equilibrium constants as inputs and more work is required to determine the exact physical properties of divalent cations that are responsible for the behavior observed in the experiments. Nevertheless, the experimental data for NaCl solution at I = 10.8 mM clearly suggest that the adsorption of Mg2+ is lower than that of Ca2+.
While a much less common situation, the same effects considered here will be present when divalent anions are added to a solution flowing between positively charged walls.
Acknowledgments
ATC and SD acknowledge the partial support of this work by the National Science Foundation Nanoscale Science and Engineering Center for the Affordable Nanoengineering of Polymeric Biomedical Devices, EEC-0425626, and National Institute of Biomedical Imaging and Bioengineering, through the Cleveland Clinic Foundation. The content of this paper is solely the responsibility of the authors and does not necessarily represent the official views of the National Institute of Biomedical Imaging and Bioengineering or the National Science Foundation. HFL and MY acknowledge the partial support of the Air Force Office of Scientific Research (contract FA9550-04-C-0130). HFL and MY also thank Dr. R. Sadr at Texas A&M-Qatar and J. P. Alarie and Prof. J. M. Ramsey at the University of North Carolina for the fused silica microchannels used here.
Appendix
The implications of the use of ζ–potential in defining the factor y = exp (−ζF/RT) used in Equation (8) are discussed below. The change in electric potential in moving from the shear plane (which is widely recognized to be coincident with the boundary of the diffuse layer (Levine & Smith, 1971)) to the plane of adsorption of the ion is assumed to be a constant and is lumped into the ‘equilibrium constant’ Ki (Healy & White, 1978; Revil et al., 1999). Alternatives to this method are empirical treatments of the Stern layer as a capacitor (the ‘Basic Stern Model’ of Venema et al. (1996)) or a series of capacitors (the ‘triple layer model’ of Levine & Smith (1971)) but experimentally substantiated and theoretically well-founded values for these capacitances are yet to be determined (Sverjensky, 2001; Kirby & Hasselbrink, 2004; Levine & Smith, 1971). The use of ζ–potential as adopted in this work, avoids introducing these capacitances; thus minimizing the number of inputs to the model (Kirby & Hasselbrink, 2004) compared to other models of the silica interface in the literature (Venema et al., 1996). On the other hand, since the actual change in electric potential between the plane of adsorption and the shear plane is not a constant but depends on factors such as the distance of the plane of adsorption from the surface, size and state of hydration of ions, and the surface charge itself (Sverjensky, 2001; Dove & Craven, 2005; Levine & Smith, 1971), a small but unavoidable sensitivity of the ‘equilibrium constants’ to the BGE conditions has to be accommodated to explain experimental observations. Obviously, this would not be the case for true thermodynamic constants (Healy & White, 1978).
Footnotes
Partially supported by AFOSR, NIBIB and NSF
Publisher's Disclaimer: This is a PDF file of an unedited manuscript that has been accepted for publication. As a service to our customers we are providing this early version of the manuscript. The manuscript will undergo copyediting, typesetting, and review of the resulting proof before it is published in its final citable form. Please note that during the production process errors may be discovered which could affect the content, and all legal disclaimers that apply to the journal pertain.
References
- Butler JN. Ionic equilibrium. Addison-Wesley Pub. Co Reading, Mass; 1964. [Google Scholar]
- Conlisk AT, McFerran Jennifer, Zheng Zhi, Hansford Derek. s. Analytical Chemistry. 2002;74:2139–2150. doi: 10.1021/ac011198o. [DOI] [PubMed] [Google Scholar]
- Coreno J, Sánchez AMABF. Apatite nucleation on silica surface: A potential approach. Mater Res. 2001;57:119–125. doi: 10.1002/1097-4636(200110)57:1<119::aid-jbm1150>3.0.co;2-p. [DOI] [PubMed] [Google Scholar]
- Criscenti LJ, Sverjensky DA. The role of electrolyte anions in divalent metal (M2+) adsorption on oxide and hydroxide surfaces in salt solutions. American Journal of Science. 1999;299(10):828–899. [Google Scholar]
- Dove PM, Craven CM. Surface charge density on silica in alkali and alkaline earth chloride electrolyte solutions. Geochimica et Cosmochimica Acta. 2005;69(21):4963–4970. [Google Scholar]
- Düker A, Ledin A, Karlsson S, Allard B. Adsorption of zinc on colloidal (hydr) oxides of Si, Al and Fe in the presence of a fulvic acid. Applied Geochemistry. 1995;10(2):197–205. [Google Scholar]
- Healy TW, White LR. Ionizable surface group models of aqueous interfaces. Adv Colloid Interface Sci. 1978;9:303–345. [Google Scholar]
- Hunter RJ. Zeta potential in Colloid Science: Principles and Applications. Academic Press; 1981. [Google Scholar]
- Iler RK. The chemistry of silica. Wiley; 1979. [Google Scholar]
- Kallay N, Kovacevic D, Zalac S. Thermodynamics of solid/liquid interface. In: Lutzenkirchen, editor. Surface Complexation Modelling. chap. 3. Oxford, U.K.: Academic Press; 2006. p. 138. [Google Scholar]
- Kirby BJ, Hasselbrink EF. Zeta potential of microfluidic substrates: 1. Theory, experimental techniques, and effects on separations. Electrophoresis. 2004;25(2):187–202. doi: 10.1002/elps.200305754. [DOI] [PubMed] [Google Scholar]
- Levine S, Smith AL. Theory of the differential capacity of the oxide/aqueous electrolyte interface. Discussions of the Faraday Society. 1971;52:290–301. [Google Scholar]
- Lyklema J. Fundamentals of Interface and Colloid Science. Vol. 1. Academic Press; 1991. [Google Scholar]
- Mammen M, Carbeck JD, Simanek EE, Whitesides GM. Treating Electrostatic Shielding at the Surface of Silica as Discrete Siloxide-Cation Interactions. Journal of the American Chemical Society. 1997;119(15):3469–3476. [Google Scholar]
- Papirer E, editor. Adsorption on Silica Surfaces. Marcel Dekker; 2000. [Google Scholar]
- Pierre A, Lamarche JM, Mercier R, Foissy A, Persello J. Calcium as potential determining ions in aqueous calcite suspensions. Journal of Dispersion Science and Technology. 1990;11(6):611–635. [Google Scholar]
- Probstein RF. Physicochemical hydrodynamics. Butterworths; 1989. [Google Scholar]
- Raiteri R, Martinoia S, Grattarola M. pH-dependent charge density at the insulator-electrolyte interface probed by a scanning force microscope. Biosensors and Bioelectronics. 1996;11(10):1009–1017. [Google Scholar]
- Revil A, Pezard PA, Glover PWJ. Streaming potential in porous media 1. Theory of the zeta potential. Journal of Geophysical Research. 1999;104(B9):20021–20032. [Google Scholar]
- Sadr R, Yoda M, Zheng Z, Conlisk AT. An experimental study of electro-osmotic flow in rectangular microchannels. Journal of Fluid Mechanics. 2004;506:357–367. [Google Scholar]
- Scales PJ, Grieser F, Healy TW, White LR, Chan DYC. Electrokinetics of the silica-solution interface: a flat plate streaming potential study. Langmuir. 1992;8(3):965–974. [Google Scholar]
- Sverjensky DA. Interpretation and prediction of triple-layer model capacitances and the structure of the oxide-electrolyte-water interface. Geochimica et Cosmochimica Acta. 2001;65(21):3643–3655. [Google Scholar]
- Sverjensky DA. Prediction of the speciation of alkaline earths adsorbed on mineral surfaces in salt solutions. Geochimica et Cosmochimica Acta. 2006;70(10):2427–2453. [Google Scholar]
- Tadros TF, Lyklema J. The electrical double-layer on silica in the presence of bivalent counter-ions. Journal of Electroanalytical Chemistry and Interfacial Electrochemistry. 1969;22:1–17. [Google Scholar]
- Venema P, Hiemstra T, van Riemsduk WH. Comparison of different site binding models for cation sorption: Description of pH dependency, salt dependency, and cation–proton exchange. Journal of Colloid And Interface Science. 1996;181(1):45–59. [Google Scholar]
- Wiese GR, James RO, Healy TW. Discreteness of charge and solvation effects in cation adsorption at the oxide/water interface. Discussions of the Faraday Society. 1971;52:302–311. [Google Scholar]
- Zheng Z, Hansford D, Conlisk AT. Effect of multivalent ions on transport in nano-channels. Electrophoresis. 2003;24:3006–3017. doi: 10.1002/elps.200305561. [DOI] [PubMed] [Google Scholar]