

Summary
Colon cancers frequently harbor KRAS mutations, yet only a subset of KRAS-mutant colon cancer cell lines are dependent upon KRAS signaling for survival. In a screen for kinases that promote survival of KRAS-dependent colon cancer cells, we found that the TAK1 kinase (MAP3K7) is required for tumor cell viability. The induction of apoptosis by RNAi-mediated depletion or pharmacologic inhibition of TAK1 is linked to its suppression of hyperactivated Wnt signaling, evident in both endogenous and genetically reconstituted cells. In APC-mutant/KRAS-dependent cells, KRAS stimulates BMP-7 secretion and BMP signaling, leading to TAK1 activation and enhancement of Wnt-dependent transcription. An in vitro-derived “TAK1-dependency signature” is enriched in primary human colon cancers with mutations in both APC and KRAS, suggesting potential clinical utility in stratifying patient populations. Together, these findings identify TAK1 inhibition as a potential therapeutic strategy for a treatment-refractory subset of colon cancers exhibiting aberrant KRAS and Wnt pathway activation.
Introduction
Targeted cancer therapies have exploited specific mutations that drive survival signals in subsets of tumors, leading to successful genotype-directed clinical applications of small molecule inhibitors (reviewed in (Haber et al., 2011). However, KRAS activating mutations, which are common in multiple human cancers, remain a critical therapeutic challenge. KRAS mutations are generally associated with treatment-refractory tumors (Downward, 2003). For instance, KRAS mutant lung cancers are generally refractory to EGFR-targeted small molecule inhibitors and in colon cancer, KRAS mutations predict failure of response to antibodies targeting overexpressed wild-type EGFR (Normanno et al., 2009). Thus, patients with KRAS-mutant colon cancers are excluded from targeted EGFR therapies and are faced with limited therapeutic options.
To date, pharmacologic targeting of activated KRAS has not been successful. Mutationally-activated KRAS proteins are not susceptible to agents that target GTPase function and drug therapies that disrupt KRAS post-translational modifications have not been clinically efficacious (Whyte et al., 1997). More recently, several genome-wide shRNA screens revealed synthetic lethal interactions in which knockdown of a candidate gene appeared to suppress proliferation of KRAS mutant cancer cell lines (Barbie et al., 2009; Luo et al., 2009a; Scholl et al., 2009; Singh et al., 2009). To date, these findings have not led to the development of effective inhibitors to treat KRAS-mutant cancers, possibly due in part to the contextual complexity of KRAS mutations and the difficulty in generalizing synthetic lethal interactions across a broad range of tumor-specific backgrounds.
In analyzing large panels of KRAS-mutant tumor-derived cell lines, we noted that approximately half of these cell lines underwent apoptosis following shRNA-mediated knockdown of KRAS (so-called KRAS-dependent), whereas the other half maintained viability (KRAS-independent) (Singh et al., 2009). These differences were independent of the particular KRAS mutation, although KRAS-dependent cells generally exhibited higher KRAS protein expression levels. Cellular context appeared to play a significant role in the dependency of KRAS mutant cells on continued KRAS signaling for their survival. In both lung and pancreatic cancer cells harboring KRAS mutations, the presence of epithelial markers was highly correlated with KRAS dependency, whereas epithelial to mesenchymal transformation (EMT) was associated with KRAS independence, despite the presence of a KRAS mutation. Reversion of mesenchymal cells to an epithelial phenotype was associated with restored dependence on KRAS, suggesting that mesenchymal-associated signals may provide alternative survival pathways when KRAS activity is disrupted (Singh et al., 2009). Interestingly, the association of KRAS dependency with expression of epithelial markers was not evident in KRAS-mutant colon cancers prompting our interest in identifying lineage-specific determinants of KRAS-dependency in colon cancers.
The cellular context of KRAS mutations in colon cancer is complex. APC loss-of-function mutations that arise in early adenomas lead to inappropriate activation of canonical Wnt signaling, and β-catenin-mediated transcriptional changes (Behrens et al., 1996). KRAS mutations are most common during the progression from adenoma to carcinoma, occurring in approximately 50% of cases, and subsequently followed by frequent deletions of SMAD4, targeting the transforming growth factor beta(TGF-β) signaling pathway. (Vogelstein et al., 1988). The contribution of KRAS mutations to colon carcinogenesis is thus uniquely linked to altered Wnt and TGF-β signaling.
Here, we compared KRAS-dependent and -independent colon cancer cells using a combination of gene expression and shRNA knockdown studies, which led to the identification of MAP3K7, encoding the TGF-β activated kinase (TAK1), as a driver of cell survival in KRAS-dependent, APC-deficient cells. Together with the recently reported enhancement of Wnt signaling by KRAS (Janssen et al., 2006; Phelps et al., 2009), these observations point to an unappreciated yet critical signaling node in a subset of colon cancers. We demonstrate that, in KRAS-dependent, but not in KRAS-independent cells, KRAS activates Bone Morphogenetic Protein-7 (BMP-7) signaling, leading to TAK1 activation, β-catenin nuclear localization, and transcriptional upregulation of Wnt target genes. This is also accompanied by KRAS- and TAK1-regulated activation of the NF-κB pathway. Reconstitution studies confirm that activation of this KRAS-dependent signaling network underlies exquisite sensitivity to TAK1 inhibition. Together, these observations point to a potential therapeutic strategy, based on targeting a vulnerable node in an identifiable subset of APC/KRAS mutant colon cancers.
Results
Identification of KRAS-dependent colon cancer cell lines
We used a lentiviral-based shRNA assay to quantitate KRAS dependency (Singh et al., 2009) in 21 KRAS-mutant colon cancer cell lines, measuring cell viability at 6 days post-infection (Figure 1A). KRAS-mutant colon cancer cells showed variable KRAS-dependencies (Figures 1A and 1B), allowing us to derive a quantitative Ras Dependency Index (RDI) to compare multiple cell lines with varying viral transduction efficiencies (see Experimental Procedures). An RDI >2.0 represented a threshold to classify cells as KRAS-dependent. Among the 21 KRAS-mutant cell lines, 10 were classified as KRAS-dependent and 11 as KRAS-independent (Figure 1B). KRAS dependency was not associated with particular KRAS activating mutations (Table S2). Examples of two KRAS-dependent cell lines (SW620 and SK-CO-1) were selected for comparison with two KRAS-independent lines (LS-174T and SW1463) (Figure 1A).
Figure 1. Classification of KRAS mutant colon cancer cells into KRAS-independent and KRAS-dependent groups.
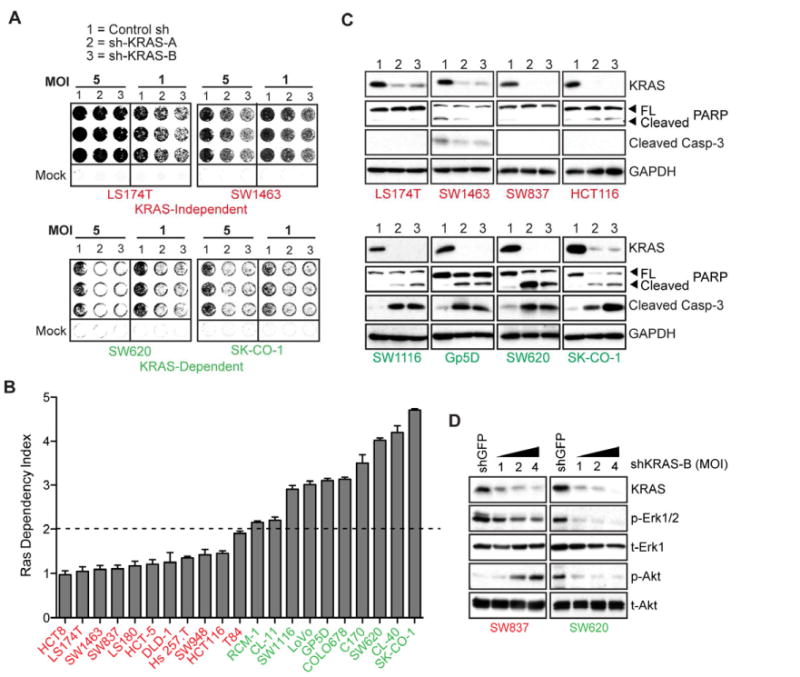
(A) Representative 6-day 96-well viability assays in 4 KRAS mutant colon cancer cell lines transduced with either control or 2 independent KRAS-directed lentiviral shRNAs (A and B), at 2 viral MOIs. Cell lines in red text are KRAS-independent, and those in green text are KRAS-dependent. Quantitation and transformation of relative cell density values yields the Ras Dependency Index depicted in Fig. 1B.
(B) Ras Dependency Index plot for a panel of 21 KRAS mutant colon cancer cell lines. Dashed line represents the “Dependency Threshold” of 2.0. Data are presented as the mean of three independent experiments +/- SEM.
(C) KRAS protein depletion 4 days post-infection with KRAS-directed shRNAs and effects on apoptosis, as assessed by caspase-3 and PARP cleavage, in a representative panel of KRAS-dependent versus-KRAS independent cell lines. Lanes 1, 2 and 3 are as in panel A. Data is representative of two independent experiments.
(D) Activating phosphorylations of the Erk (p-Erk1/2) and Akt (p-Akt) kinases, following KRAS depletion in SW837 KRAS-independent versus SW620 2 KRAS-dependent cells, 4 days post-infection with 3 different viral titres (MOIs of 1, 2 and 4) of shKRAS-B. Total protein levels (t-Erk1 and and t-Akt) are shown as gel loading controls. Note: different exposure times were used for the individual panels. Data is representative of two independent experiments.
KRAS depletion in KRAS-dependent colon cancer cells triggered apoptosis, measured by caspase-3 and polyADP ribose polymerase (PARP) cleavage at 6-days following shRNA knockdown (Figure 1C). Cells classified as KRAS-independent despite the presence of mutant KRAS showed no such apoptotic response to KRAS depletion. Reduced Erk and Akt phosphorylation preceded apoptosis in KRAS-dependent cells, whereas KRAS-independent cells displayed weak KRAS coupling to Erk phosphorylation. Moreover, in KRAS independent cells, KRAS depletion resulted in paradoxically increased Akt phosphorylation, in agreement with recent reports (Ebi et al., 2011) (Figure 1D). Thus, KRAS-dependent and -independent colon cancer cells demonstrate distinct patterns of signaling downstream of mutant KRAS, with only KRAS-dependent cells showing suppression of key survival signals following KRAS knockdown.
TAK1 is a KRAS dependency-associated kinase
To identify potentially “druggable” pro-survival effectors in KRAS-dependent colon cancer cells, we first compared gene expression profiles in four KRAS-dependent and four KRAS-independent cell lines (Figure 2A; see Experimental Procedures). A core “KRAS Dependency Gene Set” was identified, comprising 687 genes overexpressed in KRAS-independent cells (IND genes) and 832 genes overexpressed in KRAS-dependent cells (DEP genes). Hierarchical clustering of this KRAS Dependency Gene Set across 40 colon cancer cell lines with either wild-type or mutant KRAS demonstrated 3 clusters: IND, DEP and intermediate (Figure S1A). Gene ontology analysis of the DEP gene set, using the DAVID algorithm (Dennis et al., 2003) identified major functional classes, of which kinases were the most abundant (Figure S1B). We selected these for further analysis, given the possibility of identifying novel tractable therapeutic targets. The 47 DEP protein, lipid and nucleotide kinase genes showed significant overexpression in KRAS-dependent colon cancer cells, confirmed for a subset at the protein level (Figures 2B and C). The DEP gene set prominently featured genes relevant to mitotic checkpoint control and DNA replication/repair pathways (KEGG pathway database) (Figure S1C). Of note, Wnt signaling components were significantly enriched in KRAS-dependent cells, compared to KRAS-independent cells, despite both classes having a comparable frequency of APC mutations (Figure S1C).
Figure 2. Analysis of kinases from a “KRAS dependency signature” in colon cancer cell lines.
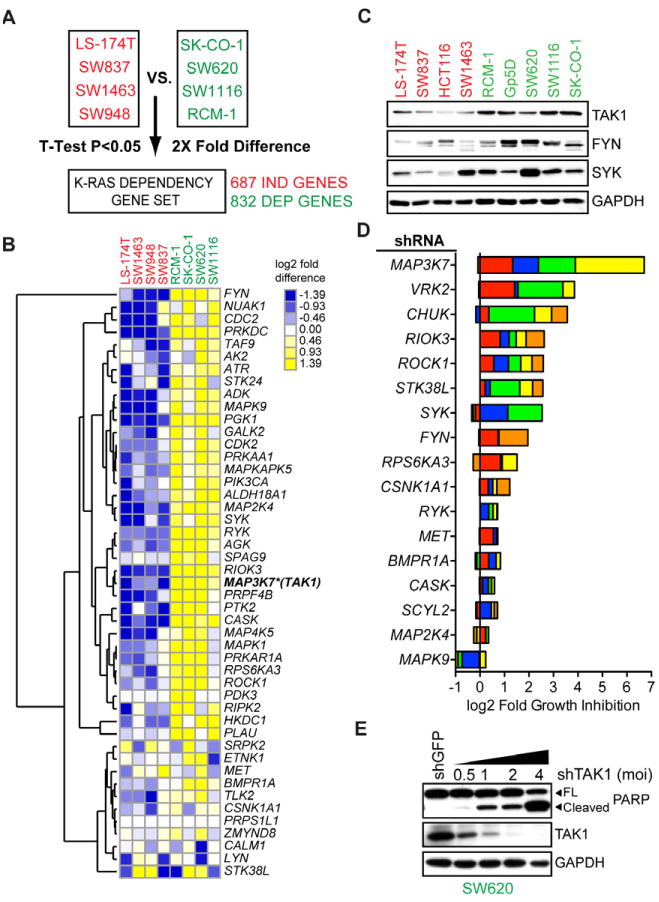
(A) Schematic representation of the methodology used to derive a colon cancer KRAS dependency gene expression data set. Gene expression microarray data for 4 indicated KRAS-independent versus KRAS-dependent cell lines were analyzed for significantly underexpressed (IND) or overexpressed (DEP) genes by student T-test analysis (two-tailed, homoscedastic) followed by selection of probe sets whose average expression was 2-fold higher or lower, yielding 687 IND genes and 832 DEP genes.
(B) Hierarchical clustering of gene expression for 47 DEP “druggable” protein, lipid or other ATP-dependent kinase genes or kinase regulatory genes. Heat map shows log2 median-centered intensity values and similarly expressed genes are clustered using Euclidean distance as a similarity metric. MAP3K7 (encoding TAK1) is highlighted with an asterisk.
(C) Protein expression levels of indicated kinases in a panel of KRAS-independent and KRAS-dependent cell lines. GAPDH serves as a loading control.
(D) Depletion of DEP kinase genes in SW620 versus SW837 cells. Each colored bar represents an individual shRNA sequence per gene, with the same color-coding as in Figure S1F. Fold growth inhibition per shRNA per kinase was computed by dividing the relative cell density of SW837 by that of SW620 cells and using a weighted average to account for viral titre. The plot shows cumulative log2 fold growth inhibition for each shRNA per kinase; i.e., a value of 1 on the plot indicates a 2-fold greater growth inhibitory effect for a given shRNA in SW620 compared to SW837 cells. The log2 fold growth inhibition for each individual shRNA was then cumulated for each kinase gene. Data are represented as the mean value corresponding to each shRNA from three independent experiments.
(E) Knockdown of TAK1 with increasing viral titres of shTAK1-D encoding lentiviruses (MOI) and associated apoptotic effects assessed by PARP cleavage. GAPDH serves as a loading control. Data are representative of two independent experiments.
See also Figure S1 and Table S1.
We further selected candidate protein kinase-encoding genes from the list of 47, based on ranking by DEP scores as well as literature searches for genes with putative cancer-associated function. To establish the functional relevance of these DEP kinases, we compared the consequences of knockdown in two cell lines with comparable lentiviral infection profiles (KRAS-independent SW837 cells and KRAS-dependent SW620 cells; Figures S1D-F). We targeted each of 17 kinases, using 5 shRNAs at 3 different viral MOIs, measuring relative cell densities at 6 days post-infection (Figure S1E and S1F). Among all kinases tested, TAK1 (MAP3K7) depletion had the most potent and selective effect on viability of SW620 versus SW837 cells, measured as the cumulative effect of all shRNA constructs tested (Figure 2D). Two other genes, VRK2 encoding vaccinia related kinase isoform 2 and CHUK encoding I-κB kinase alpha, also demonstrated selective albeit less potent effects on SW620 cell viability (Figures S1E, S1F and 2D). TAK1 depletion in KRAS-dependent SW620 cells was remarkable in producing a strong, viral titer-dependent apoptotic response, as assessed by PARP cleavage (Figure 2E). Since we have not functionally validated other kinase-encoding genes from the original list of 47, it remains formally possible that additional untested kinases may play stronger pro-survival roles than those tested.
Validation of TAK1 as a therapeutic target in KRAS-dependent colon cancer
To further validate TAK1 as a candidate therapeutic target in this context, we used a potent and selective TAK1 kinase inhibitor, 5Z-7-oxozeaenol (Rawlins et al., 1999). We tested sensitivity to 5Z-7-oxozeaenol in a panel of 47 colon cancer cell lines with various genotypes (Figures 3A and S2A). KRAS and BRAF genotypes were either procured from the Sanger Institute's Catalog of Somatic Mutations (COSMIC) or determined by targeted resequencing (Table S2). Among KRAS-mutant cells, those classified as KRAS-dependent by virtue of sensitivity to KRAS shRNA knockdown were also highly sensitive to TAK1 inhibition, whereas KRAS-independent cells were generally resistant (P<0.0001). Notably, of 10 BRAF-mutant cell lines tested, 5 were also sensitive to 5Z-7-oxozeaenol (Figure 3A). The majority of cells with wild-type KRAS and BRAF were 5Z-7-oxozeaenol-resistant, although some with mutations that potentially impact the Ras pathway (e.g. NF1 mutation in HT55 cells and ALK mutation in CoCM-1 cells – COSMIC, Sanger Institute) were moderately sensitive to 5Z-7-oxozeaenol. Consistent with their colon cancer derivation, almost all cell lines tested harbored APC mutations; of note, three cell lines with wild-type APC but harboring downstream CTNNB1 (β-catenin) activating mutations (either S33Y or S45 missense mutations) were resistant to TAK1 inhibition (Table S2).
Figure 3. Validation of MAP3K7/TAK1 as a pro-survival mediator in KRAS-dependent colon cancers.
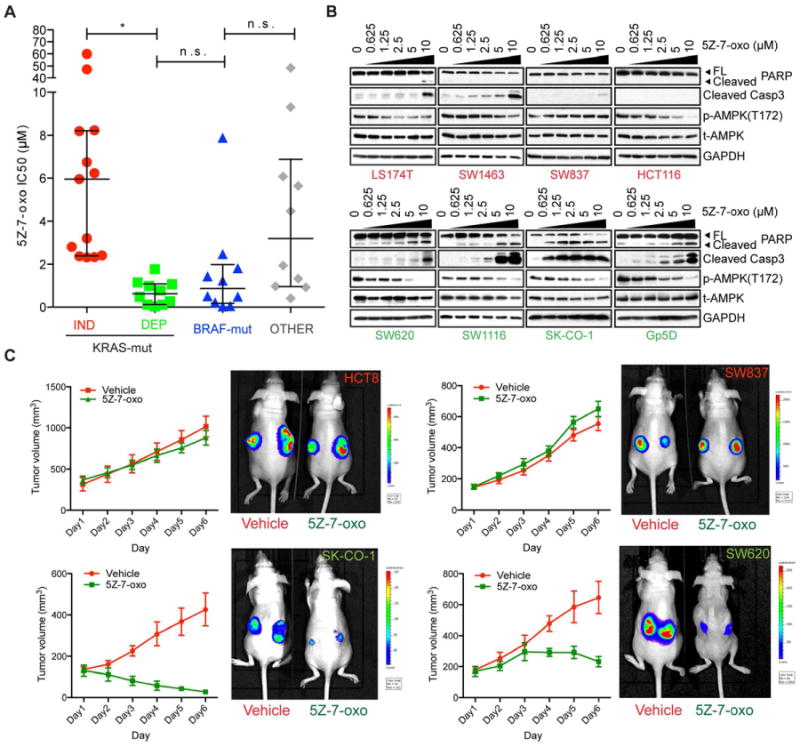
(A) IC50 values (μM) for effects on cellular proliferation and viability with the TAK1 kinase inhibitor 5Z-7-oxozeaenol in a panel of colon cancer cell lines that have been genotyped as KRAS mutant (KRAS-independent – red circles or KRAS-dependent – green squares), BRAF mutant (blue triangles) or wild-type for both KRAS and BRAF (OTHER – grey diamonds). Effects on growth were measured 3 days post-treatment. Data are represented as the mean of 3 independent experiments and error bars indicate the median ± interquartile range. *denotes p<0.00001; n.s. – not significant.
(B) Effects of TAK1 inhibition on apoptosis and signaling in a representative panel of KRAS-independent and KRAS-dependent cell lines, 24h after treatment. PARP and caspase-3 cleavage are shown as indicators of apoptosis, and AMPK threonine 172 (T172) phosphorylation is shown as a downstream indicator of TAK1 signaling activity. GAPDH serves as a gel loading control.
(C) TAK1 inhibition in mice with xenografted human tumors derived from the HCT8/SW837 (KRAS-independent) and SK-CO-1/SW620 (KRAS-dependent) cell lines. Cells expressing firefly luciferase were injected subcutaneously into the flanks of nude mice. Tumors are shown as imaged by IVIS detection of luminescence counts (in photons/sec) following 14 days of tumor growth followed by 6 days of treatment with either 15mg/kg 5z-7-oxozeaenol or vehicle (5% DMSO in arachis oil), IP delivery q.d. Quantitation of tumor volume (mm3) is also shown. Tumor volume data are represented as the mean of 4 tumors in 2 mice for each group +/- SEM.
See also Figure S2 and Table S2.
To determine if sensitivity to TAK1 inhibition is specific to colon cancer-derived cell lines, we assessed sensitivity to 5Z-7-oxozeaenol in 5 KRAS mutant pancreatic ductal adenocarcinoma (PDAC) and 4 non-small cell lung cancer (NSCLC) cells, all of which are APC wild-type (Figure S2B). Whether previously classified as KRAS-dependent or -independent (Singh et al., 2009), PDAC and NSCLC cells were largely refractory to 5Z-7-oxozeaenol treatment. Finally, two non-transformed epithelial cell lines were also 5Z-7-oxozeaenol-refractory – MCF10A (IC50 = 5.5μM) and MDCK (IC50 = 22μM) (Figure S2A).
Pharmacologic TAK1 inhibition triggered apoptosis in KRAS-dependent colon cancer cells, as measured by PARP and caspase-3 cleavage (Figure 3B). In these cells, 5Z-7-oxozeaenol treatment caused reduced threonine 172 phosphorylation of the AMP-activated kinase (p-AMPK), an established TAK1 regulated kinase (Xie et al., 2006). In contrast, KRAS-independent cells displayed little or no 5Z-7-oxozeaenol-mediated caspase-3 or PARP cleavage, except at very high doses, and AMPK phosphorylation was unaffected. Thus, low concentrations of 5Z-7-oxozeaenol, in the range of 0.625 to 1.25 μM, promote apoptosis selectively in KRAS-dependent colon cancer cells.
To validate the efficacy of 5Z-7-oxozeaenol in vivo, we generated subcutaneous xenografted tumors in NOD/SCID mice using four representative KRAS mutant cell lines: HCT8 and SW837 (KRAS-independent), and SK-CO-1 and SW620 (KRAS-dependent) (Figure 3C). Palpable tumors were evident two weeks post-implantation, at which time mice were treated with either daily intraperitoneal 15mg/kg of 5Z-7-oxozeaenol or vehicle alone (Rawlins et al., 1999). Tumor imaging demonstrated remarkable regression of both KRAS-dependent tumors after as few as 6 days of treatment. In contrast, tumors derived from the KRAS-independent cell lines showed no significant response to TAK1 inhibition. No overt toxicity was evident in 5Z-7-oxozeaenol-treated mice at the selected dosing regimen.
A gene expression signature associated with sensitivity to TAK1 inhibition
To identify molecular mechanisms underlying sensitivity to TAK1 inhibition, we isolated subsets of genes within the KRAS DEP gene set most highly correlated with 5Z-7-oxozeaenol sensitivity. We employed K-means clustering (Gasch and Eisen, 2002) for unsupervised pattern recognition in the KRAS dependency gene set in a test set of 21 colon cancer cell lines whose sensitivity to TAK1 inhibition had been determined (Figure S3A). By setting the parameters to k=3 clusters, we identified 10 nodes (0 through 9) representing synexpression groups of co-regulated genes. We then correlated average expression scores for the genes in each node with IC50 values for 5Z-7-oxozeaenol by linear regression modeling, and computed the coefficients of determination (r2) and p-values for each node/IC50 correlation (Figure S3B). This analysis revealed two nodes of genes (Figure S3B and C) whose expression is most strongly correlated with sensitivity to TAK1 inhibition. We combined the genes from these nodes to generate a 32 gene “TAK1 dependency signature”.
Clustering of the 32 genes across 21 colon cancer cell lines demonstrated a high degree of concordance between expression of the TAK1 dependency gene set, sensitivity to TAK1 inhibition and the degree of KRAS dependency (Figure 4A). Average expression of the TAK1 dependency signature is very significantly correlated with previously derived RDI values for the KRAS mutant cell lines shown in Figure 4A (P<0.0001, Figure S3E). Three general classes of cell lines appear from this analysis: KRAS-dependent, TAK1 inhibitor-sensitive cell lines with highest expression of the TAK1 dependency signature; KRAS-independent, TAK1 inhibitor-refractory cells with weak expression of the signature; and a cluster of cell lines with intermediate levels of expression, demonstrating enrichment for BRAF mutations (4 out of 6 cell lines).
Figure 4. Associations between the KRAS dependency gene set, TAK1 dependence and KRAS-driven canonical Wnt signaling in colon cancer patients.
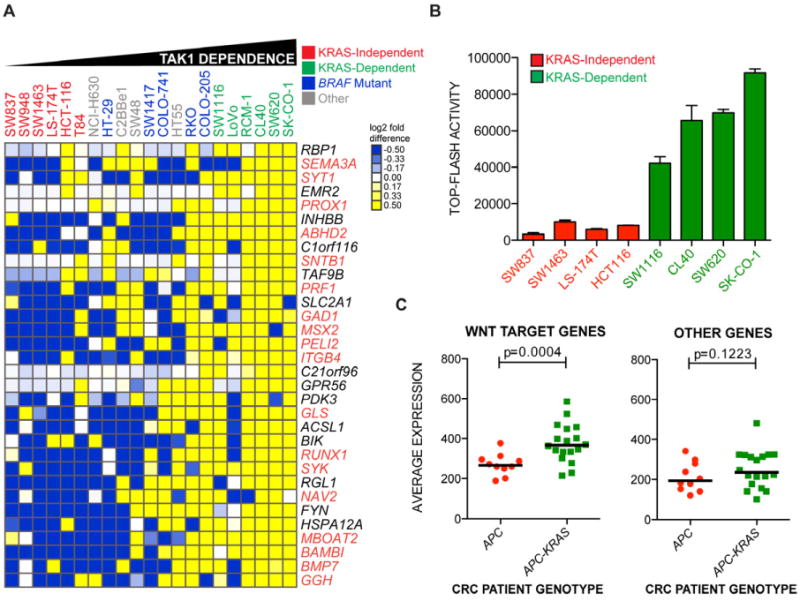
(A) Heat map representation of gene expression most correlated with TAK1 dependence from the KRAS dependency gene set across a panel of colon cancer cell lines of various genotypes. Cell lines are ordered by IC50 values for 5Z-7-oxozeaenol, leftmost being the highest and rightmost being the lowest. Clustering of genes was performed with Euclidean distance as a similarity metric. Values are presented as log2 median-centered intensities. Genes highlighted in orange text are putative or bona fide TCF4 target genes.
(B) Basal normalized TCF4 luciferase reporter activity (TOP-FLASH) in nominal units for a panel of KRAS-independent and KRAS-dependent colon cancer cell lines. Data are represented as the means of 3 independent experiments +/- SEM.
(C) Average expression of non-TCF4 or TCF4 target genes depicted in Figure 4A in colon cancer patients genotyped as either APC mutant/KRAS-wild-type (red circles) or APC mutant plus KRAS mutant (green squares). P-values represent a comparison of mean expression scores of genes for each class.
See also Figure S3.
Since we found Wnt pathway enrichment in KRAS-dependent cells (Figure S1C), we overlapped the TAK1 dependency signature with a dataset of binding sites for the Wnt-regulated transcription factor TCF4, derived from ChIP-on-Chip analyses (Hatzis et al., 2008). Of the 32 TAK1 dependency genes, 18 contained proximal TCF4 binding sites. A number of these genes, such as BAMBI, PROX1 and NAV2 (HELAD1) have been previously linked to colon tumorigenesis in the context of deregulated Wnt signaling (Lin et al., 2008; Petrova et al., 2008; Sekiya et al., 2004). Indeed, we found that KRAS-dependent cell lines had higher basal Wnt signaling activity than KRAS-independent cell lines as measured by TOP-FLASH TCF4-responsive luciferase assays (Figure 4B).
Remarkably, when applied to a primary colon cancer dataset (Reid et al., 2009), the TAK1 dependency signature distinguished tumors with mutations in both APC and KRAS from those with only APC mutations (Figure S3C). In particular, the subset of TAK1 dependency genes identified as being Wnt targets was expressed at higher levels in APC/KRAS mutant primary colon cancers compared to APC mutant/KRAS wild-type tumors (Figure 4C). While these observations imply increased Wnt signaling in KRAS-mutant cancers, we note that some established Wnt target genes (e.g. MYC and TCF7 (Figure S3D)) were not enriched in the APC/KRAS mutant tumors. Taken altogether, gene expression analyses suggest that the combination of APC and KRAS mutations in colon cancers is associated with Wnt pathway hyperactivation and correlated with susceptibility to TAK1 inhibition.
KRAS and TAK1 regulate β-catenin transcriptional activity and nuclear localization
To explore the role of KRAS and TAK1 in modulating Wnt signaling, we first assessed the effect of KRAS depletion on β-catenin/TCF transcription in a panel of KRAS mutant cell lines using the TOP-FLASH reporter (Figures 5A and S4A). The KRAS-dependent cells SW1116 and SK-CO-1 exhibited decreased TOP-FLASH reporter activity following KRAS depletion, which was correlated with the level of KRAS knockdown (Figure 5A). In contrast, KRAS depletion had no effect in one KRAS-independent line (SW1463) and increased TOP-FLASH activity in another (LS174T). In KRAS-dependent cells, 24h 5Z-7-oxozeaenol treatment strongly suppressed TOP-FLASH activity in a dose-dependent manner (IC50 0.8μM to 2.5μM) (Figure 5B). In contrast, TAK1 inhibition had a much weaker effect on TOP-FLASH activity in KRAS-independent cells (IC50 > 10μM). Of note, SW837 cells exhibited a biphasic response to 5Z-7-oxozeaenol, with increased TOP-FLASH activity at low doses and reduced activity at the high dose of 5μM. To define the effect of TAK1 signaling on a physiological Wnt target gene, we measured protein expression levels of the endogenous Axin 2 gene (Lustig et al., 2002), following treatment with 5Z-7-oxozeaenol. TAK1 inhibition resulted in a dose-dependent reduction in Axin 2 expression in KRAS-dependent cells, but not in KRAS-independent cells (Figure 5C). Thus, both KRAS and TAK1 suppression selectively suppress β-catenin-mediated transcription and Wnt target gene expression in KRAS-dependent cells.
Figure 5. KRAS and TAK1 regulate canonical Wnt signaling in KRAS-dependent cancer cells.
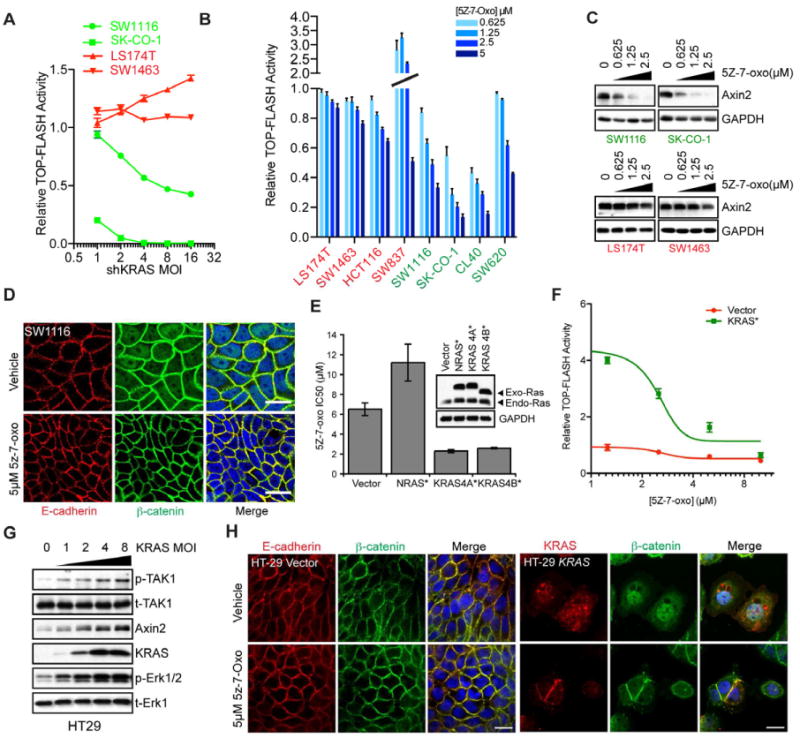
(A) TOP-FLASH luciferase reporter activity as a function of lentiviral shRNA-mediated KRAS depletion at increasing MOIs in LS174T/SW1463 (KRAS-independent) versus SW620/SK-CO-1 (KRAS-dependent) cells. Cell lines were transduced to stably express luciferase under the control of TCF4 response elements. Reporter activity is plotted relative to shGFP (vector) expressing cells. Data are represented as the mean of triplicate experiments +/- SEM.
(B) TOP-FLASH activity in KRAS-independent and KRAS-dependent cell lines following TAK1 inhibition with increasing concentrations of 5Z-7-oxo (μM). Data are represented as means of triplicate experiments ± SEM.
(C) Protein expression levels of the endogenous Wnt target gene Axin 2 following treatment of cells with the indicated concentrations of 5Z-7-oxo. GAPDH serves as a loading control.
(D) Laser confocal micrographs of SW1116 KRAS-dependent cells treated with either DMSO vehicle or 5μM 5Z-7-oxo for 24h. E-cadherin localization is shown in the red channel, β-catenin in green and DAPI-stained nuclei are in blue. Scale bar = 20μM.
(E) Forced overexpression of epitope-tagged oncogenic G12V mutated RAS protein isoforms in HT29 cells and sensitivity to TAK1 pharmacological inhibition with 5Z-7-oxozeaenol. Expression levels of exogenous and endogenous Ras proteins are shown by immunoblotting with a pan-ras monoclonal antibody. NRAS/KRAS4B are HA-tagged and KRAS4A is V5-tagged.
(F) Overexpression of mutant KRAS(12V) followed by TAK1 inhibition in HT29 cells and effects on TOP-FLASH reporter activity. Data are presented as the means of three independent experiments +/- SEM.
(G) Overexpression of KRAS(12V) in HT29 cells and effects on TAK1 and Erk phosphorylation (p-TAK1/p-Erk) as well as Axin 2 levels. Total TAK1 and Erk1 serve as loading controls.
(H) Confocal micrographs showing E-cadherin or KRAS (red) and β-catenin (green) localization in vector control or oncogenic HA tagged KRAS-4B(12V) expressing HT29 cells. KRAS expression is visualized using an HA polyclonal antibody. Scale bar = 25μm.
See also Figure S4.
Since activation of Wnt signaling is associated with nuclear translocation of β-catenin, we analyzed its subcellular localization following TAK1 suppression by immunofluorescence microscopy. Parental and vehicle-treated KRAS-dependent SW1116 and SK-CO-1 cells show nuclear β-catenin localization, in addition to its co-localization with E-cadherin at adherens junctions. TAK1 inhibition in these cells resulted in loss of nuclear β-catenin within 24h. No such effect was seen in KRAS-independent LS174T and SW1463 cells. (Figures 5D and S4B). Thus, inhibition of TAK1 signaling causes reduced β-catenin nuclear localization in KRAS-dependent but not in KRAS-independent cells.
Reconstitution of TAK1 dependency through KRAS and Wnt activation
To determine whether TAK1-independent cells could be driven toward TAK1 dependency by enhanced KRAS/Wnt signaling, we undertook a series of reconstitution experiments. HT29 and C2BBe1 colon cancer cells, with mutant APC and wild-type KRAS, exhibit very little basal TCF/LEF reporter activity and demonstrate low or undetectable nuclear β-catenin signal (Figures 5H and S4D). These cell lines are insensitive to 5Z-7-oxozeaenol. To determine whether activation of KRAS is sufficient to increase Wnt signaling and hence lead to sensitivity to TAK1 inhibition, we ectopically introduced mutant KRAS(G12V) in HT29 cells through phosphoglycerate kinase (PGK) promoter-driven expression. Expression of either the 4A or 4B splice isoforms of mutant KRAS in these cells resulted in a 3-fold reduction in the IC50 for 5Z-7-oxozeaenol (Figures S4C and 5E). In contrast, ectopic expression of mutant NRAS at equivalent expression levels caused slightly increased resistance to 5Z-7-oxozeaenol.
The increased TAK1 dependency resulting from ectopic mutant KRAS in HT29 cells was correlated with 5-fold upregulated β-catenin transcriptional activity, which was blocked in a dose-dependent manner by TAK1 inhibition (Figures 5F). Similar results were obtained in a second KRAS wild-type, TAK1-independent cell line (C2BBe1) (Figures S4D). Ectopic expression of mutant KRAS resulted in increased TAK1 autophosphorylation, Erk phosphorylation, elevated Axin 2 levels and nuclear β-catenin localization (Figures 5G and 5H). TAK1 inhibition reversed the KRAS-induced β-catenin nuclear localization. Finally, pretreatment of cells with 5Z-7-oxozeaenol, prior to their transduction with mutant KRAS, abrogated the KRAS-mediated increase in Wnt signaling (Figure S4E). Taken together, ectopic expression of mutant KRAS is sufficient to activate TAK1 in APC-deficient cells, leading to increased Wnt signaling and sensitization to TAK1 inhibition.
To further test the role of Wnt signaling in this context, we investigated two KRAS mutant pancreatic cancer (PDAC) cell lines, PANC-1 and YAPC, which are APC wild-type. PANC-1 cells are KRAS-independent, whereas YAPC cells are KRAS-dependent, a distinction that has been linked to increased KRAS signaling in YAPC cells (Singh et al., 2009). Activation of canonical Wnt signaling by inhibition of GSK-3 using the selective inhibitor BIO caused strong, dose-dependent TOP-FLASH reporter induction in KRAS-dependent YAPC cells, compared to weak induction in the KRAS-independent PANC-1 cells (Figure S4F). Simultaneous treatment of YAPC cells with 5Z-7-oxozeaenol abrogates the BIO-mediated TOP-FLASH induction. In contrast, PANC-1 cells undergo stronger induction of TOP-FLASH activity with combined GSK-3 and TAK1 inhibition (Figure S4G, lower upper panel). While the viability of KRAS-dependent YAPC cells was greatly suppressed by combined GSK-3 and TAK1 inhibition, no such effect was seen with PANC-1 cells (Figure S5H). Finally, we introduced a constitutively-activated mutant of β-catenin (CTNNB1-CA) containing S33Y and S45A missense mutations, into KRAS-dependent SW620 cells. This mutant caused partial losses in both KRAS and TAK1 dependencies (Figures S6A-C). Taken altogether, these reconstitution studies indicate that KRAS and Wnt pathway hyperactivation together contribute to TAK1 dependency.
KRAS activates TAK1 through enhanced BMP signaling
TAK1 encodes an effector of the BMP receptor, which is activated in response to BMP ligand binding. Our TAK1 dependency signature is notably enriched for TGF-β/BMP pathway components, including BMP7, BAMBI and INHBB (Figure 4A). To test for a direct role of the BMP pathway in KRAS-mediated activation of TAK1, we measured the expression of the BMP receptor ligand BMP7 and markers of BMP activation following KRAS depletion. In KRAS-dependent SW620 and SK-CO-1 cells, KRAS depletion caused reduced BMP-7 expression, BMP-mediated phosphorylation of its effector Smad1, and TAK1 autophosphorylation (Figure 6A). Of note, the predominant phospho-TAK1 immunoreactive band in this context is the 40kD isoform, although two isoforms (40kD and 75kD) are observed and depleted by TAK1 shRNA (Figure 2E). Finally, Axin 2 levels were suppressed following KRAS depletion, indicating that KRAS signaling enhances both BMP signaling and Wnt activation (Figure 6A). These effects of KRAS depletion were not seen in KRAS-independent LS-174T and SW837 cells.
Figure 6. Oncogenic KRAS regulates a BMP-7/BMPR1A signaling.
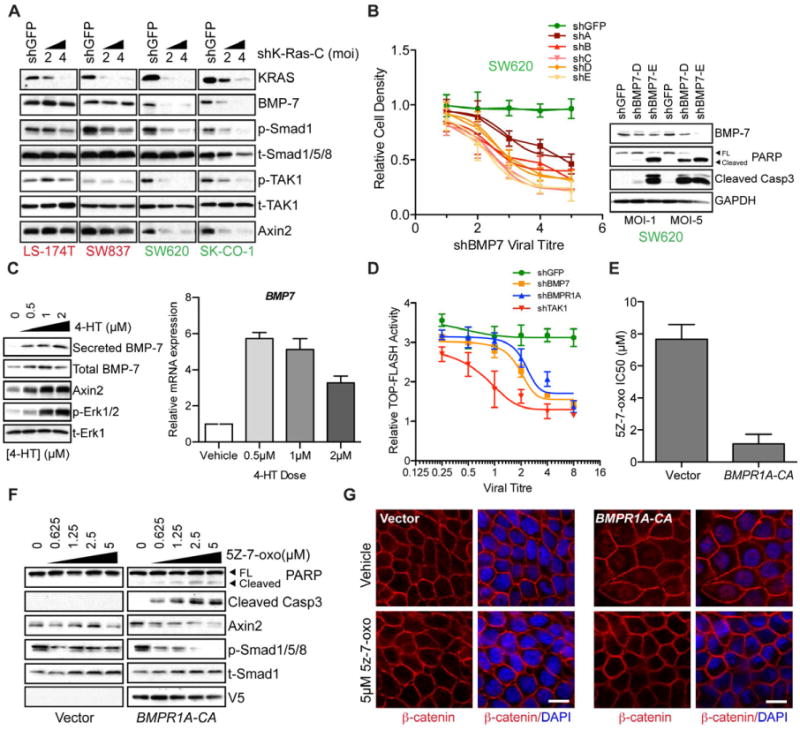
(A) Depletion of KRAS in two KRAS-independent (LS-174T and SW837) and two KRAS-dependent cell lines (SW620 and SK-CO-1) and subsequent effects on expression of BMP-7 as well as downstream effects on Smad1/TAK1 phosphorylation (p-Smad1/p-TAK1). The 20kD secreted form of BMP7 is shown. Phospho-TAK1 represents the TAK1 autophosphorylation site and is a measure of TAK1 activity. Total Smad1/5/8 and total TAK1 (t-Smad1/5/8/t-TAK1) proteins are shown as gel loading controls. Data are representative of two independent experiments.
(B) Effects of BMP7 depletion on proliferation and viability of SW620 KRAS-dependent cells. Plot shows cell density 6 days post-infection with either shGFP control or 5 different BMP7-directed lentiviral shRNAs. Data are represented as the mean of three independent experiments ± SEM. Western blots on the right panel show BMP-7 levels and apoptotic effects as measured by PARP and Caspase3 cleavage following BMP-7 depletion with two independent lentiviral shRNAs (D and E).
(C) Effects on BMP7 protein and transcript levels following induced activation of ER-KRAS(12V) fusion protein with various doses of 4-HT in HT29 cells. Left panel shows levels of total and secreted BMP-7 following ER-KRAS(12V) induction with 4-HT. Levels of Axin 2 and phosphorylated Erk (p-Erk1/2) are also shown following ER-KRAS(12V). Total Erk (t-Erk1) serves as a loading control.
(D) TOP-FLASH reporter activity following 4-HT induced activation of ER-KRAS(12V) and depletion of the indicated genes via lentiviral shRNA delivery at various viral titres. Reporter activity is shown relative to shGFP control.
(E) Introduction of a V5-tagged constitutively activated (CA) mutant of the BMP receptor, BMPR1A (Q233D) or control vector in HT29 cells and effects on 5Z-7-oxozeaenol sensitivity in terms of IC50 values.
(F) Signaling and apoptotic effects of TAK1 inhibition using 5Z-7-oxozeaenol at the indicated concentrations 24h post-treatment in BMPR1A-CA expressing cells. Caspase3 and PARP cleavage are indicators of apoptotic cell death. Axin 2 levels are shown as a readout of Wnt signaling. Phosphorylated smad1/5/8 levels serve as a readout of BMP signaling. GAPDH serves as a gel loading control. BMPR1A-CA expression is visualized using a monoclonal V5 antibody.
(G) Effects of BMPR1A-CA expression on β-catenin localization (red) in HT-29 cells following treatment with 5μM 5Z-7-oxozeaenol or vehicle control for 24h, as assessed by immunofluorescence confocal microscopy. DAPI-stained nuclei are shown in blue. Scale bar = 10μM.
See also Figure S5.
Given the observed KRAS-regulated expression of BMP7 in SW620 cells, we tested the functional role of this ligand using lentiviral shRNA-mediated knockdown (Figure 6B). BMP-7 depletion using a panel of 5 different shRNAs caused pronounced viral titer-dependent apoptosis (Figure 6B). Similarly, knockdown of BMPR1A, encoding the BMP receptor type 1A (Alk-3) and also a component of the KRAS dependency gene set, suppressed proliferation and viability of the KRAS-dependent SW620 cells (Figure 2D). In KRAS-independent SW837 cells we did not observe significant proliferation or viability defects following BMP7 depletion (Figure S5A and S5B). Thus, autocrine BMP-7 ligand expression and receptor activation are required to maintain the viability of KRAS-dependent cells.
To determine whether BMP-7 induction is a direct consequence of KRAS activation, as opposed to an indirect effect of cell transformation, we introduced an inducible mutant KRAS-estrogen receptor chimera (ER-KRAS(12V)) into HT29 cells, which normally express wild-type endogenous KRAS. At 24h following KRAS induction using 4-hydroxytamoxifen (4-HT), BMP7 mRNA levels were increased, along with cellular and secreted BMP-7 protein levels (Figure 6C). Endogenous levels of Axin 2 were also increased following KRAS induction, as was TOP-FLASH reporter activity. The activation of these downstream markers of Wnt signaling by inducible KRAS was effectively suppressed by depletion of BMP7, BMPR1A and TAK1 (Figure 6D), consistent with their function as key mediators of the KRAS-potentiated Wnt pathway activation.
To further define the role of BMP signaling in TAK1 dependency, we ectopically expressed a constitutively-activated (CA) variant (Q233D) of BMPR1A (Zou et al., 1997) in HT29 cells. Expression of BMPR1A-CA conferred increased sensitivity to 5Z-7-oxozeaenol with an IC50 value of 1.1μM compared to 7.7μM for vector control cells (Figure 6E). TAK1 inhibition in BMPR1A-CA-expressing cells resulted in apoptosis as shown by caspase-3 and PARP cleavage (Figure 6F). This was accompanied by dose-dependent decreases in Axin 2 and phosphorylated Smad2 levels. Finally, BMPR1A-CA-induced nuclear accumulation of β-catenin, which was suppressed following TAK1 inhibition (Figure 6G). Thus, in APC-mutant cells with low baseline β-catenin transcriptional activity, artificial BMP activation enhances Wnt signaling through TAK1 activation, conferring TAK1 dependency. Surprisingly, introduction of BMPR1A-CA into KRAS-dependent SW620 cells could not rescue KRAS depletion-induced cell death (Figure 6D), suggesting that BMP receptor activation may be necessary but not sufficient to promote cell survival in KRAS-dependent cancer cells. In summary, mutant KRAS promotes autocrine BMP signaling causing TAK1 activation and leading to enhanced Wnt signaling in APC-deficient colon cancer cells. In KRAS-dependent cells, all of these components are necessary for full anti-apoptotic signaling.
Discussion
By analyzing the KRAS-dependent subset of KRAS-mutant colon cancer cells, we uncovered a pathway by which KRAS enhances Wnt activity through BMP/TAK1 activation. Approximately half of colon cancer cell lines with both KRAS and APC mutations appear to rely on this pathway for viability, rendering them sensitive to TAK1 kinase inhibition. As such, TAK1 inhibition may provide a clinical paradigm for context-dependent targeting of KRAS-dependent colon cancers. Our data suggest that TAK1 functions as a pro-survival mediator in cancer cells displaying hyperactive KRAS-dependent Wnt signaling. This is seen under basal conditions in colon cancers with the relevant genotypes or can be synthetically achieved by activating Wnt signaling via GSK3 kinase inhibition in KRAS-dependent/APC-wild-type pancreatic cancer cells and by enforced expression of mutant KRAS in APC mutant/KRAS wild-type colon cancer cells. The ability to reconstitute such pathway dependency is unusual in “oncogene addiction” models, and facilitates molecular dissection of the critical signaling components that drive drug susceptibility. An underlying basis for this may be explained by the emerging concept of “non-oncogene addiction”, describing the acquired dependence of cells on non-mutated genes that do not themselves drive malignant progression, but whose function is essential for a cell to tolerate other oncogenic stress-induced states (Luo et al., 2009b). While TAK1 dependency may not be restricted to colon cancer, the elevated Wnt signaling activity in KRAS-dependent colon cancer cells highlights the importance of cellular context and the role of lineage-specific pathways in informing an effective therapeutic strategy.
Through a combination of knockdown and reconstitution experiments, we have attempted to dissect the key signaling components linking mutant KRAS to TAK1 and Wnt activation (Figures S6 and 7). A strong relationship between Wnt and KRAS signaling is underscored by the observation that constitutive activation of Wnt signaling causes loss of KRAS dependency in KRAS-dependent colon cancer cells. Our data indicate that KRAS regulates TAK1 and Wnt signaling in APC-deficient cells via upregulation of BMP-7 levels and BMP receptor activation. However, although BMP receptor activation is necessary for KRAS-driven survival signaling, it is not sufficient. Thus, a network of KRAS-regulated signaling components is likely to contribute to tumor cell survival. For instance, KRAS regulates NF-κB in part via TAK1 activation (Figures S6E and 7). The relative contribution of the NF-κB pathway to KRAS-driven survival signaling remains to be determined, although evidence suggests that the pathway is critical for KRAS-driven lung tumorigenesis (Meylan et al., 2009; Starczynowski et al., 2011). Additional parallel pathways are likely to be components of the KRAS-TAK1 survival signaling axis, although our data suggest that Wnt pathway activation is most critical.
Figure 7. A model for context specific KRAS dependency in colon cancers.
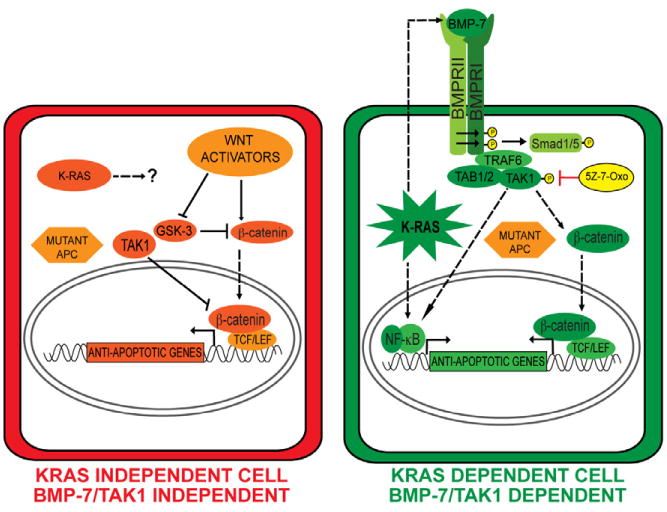
In KRAS-independent colon cancers, APC loss of function results in hyperactivation of canonical Wnt signaling through stabilization of β-catenin in cooperation with upstream Wnt activators. TAK1 can be a negative regulator of canonical Wnt signaling in these cells. In KRAS-dependent cells, oncogenic KRAS upregulates BMP-7 expression/secretion, activating the BMP receptor resulting in TAK1 activation. KRAS and TAK1 in these cells are activators of Wnt signaling by promoting β-catenin nuclear localization, which is stabilized by virtue of APC loss of function mutations. KRAS-mediated anti-apoptotic signaling could also be facilitated by NF-κB activation. Dashed lines represent unknown molecular interactions.
See also Figure S6.
Our studies highlight a context-specific role for KRAS in driving Wnt signaling in the sensitized background of APC deficiency. This is consistent with recent studies reporting KRAS-mediated enhancement of Wnt signaling in a zebrafish developmental model (Phelps et al., 2009). Indeed, we observed that in APC-deficient colon cancers with low β-catenin activity, introduction of mutant KRAS causes a sharp increase in levels of nuclear β-catenin, accompanied by increased TCF/LEF transcriptional activity. This effect partly involves KRAS-mediated up-regulation of BMP signaling and subsequent TAK1 activation, leading to enhanced TCF/LEF activity. Interestingly, the C. elegans TAK1 ortholog Mom-4 promotes nuclear retention of the β-catenin ortholog Wrm-1 asymmetrically at the 2-cell stage within the EMS cell thus defining polarity and axis specification (Nakamura et al., 2005; Shin et al., 1999). Such a context-specific TAK1/β-catenin interaction points to a remarkable degree of evolutionary conservation.
From a clinical perspective, the role of secreted BMP-7 is of particular interest since autocrine or paracrine activation of this pathway could be detectable and targetable in tumors. Importantly, expression of BMP pathway components should help to stratify colon cancer patients into TAK1 inhibitor response groups. To that end, we suggest that the top 10 genes from the in vitro derived TAK1 dependency signature (GGH, BMP7, BAMBI, MBOAT2, HSPA12A, FYN, NAV2, RGL1, SYK and RUNX1) will provide a clinically annotated signature once TAK1 inhibitors are sufficiently developed for clinical trials. This could eventually be applied as a clinical diagnostic test to measure the relative mRNA levels corresponding to the ten-gene TAK1 dependency signature in patient tumors. We note that as many as half of all KRAS mutant colon cancer cell lines are KRAS-dependent and sensitive to TAK1 inhibition, which may account for as many as a quarter of all colon cancers. As such, when guided by accurate molecular profiles, TAK1 inhibitors may provide significant clinical benefit for the most recalcitrant form of colon cancer. Beyond tool compounds such as 5Z-7-oxozeaenol, synthetic TAK1 inhibitors have been tested in preclinical models (Melisi et al., 2011). However, given potential toxicity, administration regimens will need to be modeled using highly TAK1-dependent cancers. Finally, our study illustrates that the presence of a KRAS mutation does not identify a homogenously drug-resistant tumor type, even within a specific histological type. Instead, degrees of KRAS dependency in different cancers are modulated by associated signaling pathways such as the Wnt pathway in colon cancers. This adds complexity to their analysis but is ultimately expected to inform unique therapeutic opportunities.
Experimental Procedures
Derivation of the Ras Dependency Index (RDI)
Weighted averages for relative cell densities for MOIs of 5 and 1 with the KRAS A and B shRNAs were calculated. The inverse of these averages was then calculated. This number was multiplied by the transduction efficiency for each respective cell line (the proportion of cells expressing the control shRNA following puromycin selection compared those not treated with puromycin), yielding the RDI value. An RDI of 2 is calibrated as a 50% reduction in cellular proliferation following KRAS depletion.
Gene Expression Microarray Analyses
Comparative whole-genome expression profiling was performed on Affymetrix U133A Microarrays. The dataset for the colon cancer cell lines used in this is publically available via the BROAD Institute (http://www.broadinstitute.org/cgi-bin/cancer/datasets.cgi) under Sanger Cell Line Project. Expression data were normalized using GCRMA (Bolstad et al., 2003). To derive the KRAS dependency gene set, p-values were computed comparing average normalized probe intensity for each probe set between the cell lines shown in Figure 2A. Fold differences for the average probe intensities were calculated. The p-value was −log transformed and fold difference was log2 transformed. The product of these log-transformed values was designated as the “DEP SCORE” (Table S1) and genes were ranked based on this score. Significantly over- or under-expressed genes (p<0.05; fold difference>2) were identified by this method. To generate heatmaps, complete linkage hierarchical clustering by Euclidean or city-block distance was performed using Cluster (Eisen et al., 1998) and Java Treeview (http://sourceforge.net/projects/jtreeview/). Statistical analyses of correlations with gene expression data were performed with Graphpad Prism. Patient data are available through the NCBI GEO database (accession #: GSE16125).
In vivo Pharmacology with Xenografted Mouse Tumors
Human colorectal cancer tumor cells were trypsinized and resuspended as single cell suspensions and injected into left and right flanks of NOD/SCID mice. Mice were housed in a pathogen-free environment at the Massachusetts General Hospital and were handled in strict accordance with Good Animal Practice as defined by the Office of Laboratory Animal Welfare, and all animal experiments were done with approval from Massachusetts General Hospital Subcommittee on Research Animal Care. Tumor size was monitored daily and once tumor volume had reached approximately 200mm3, treatment with 5Z-7-oxozeaenol was initiated (7 to 14 days post-implantation). Mice were injected daily with 15mg/kg 5Z-7-oxozeaenol via intraperitoneal administration.
Reporter assays
For TOP-FLASH or NF-κB reporter assays, cells were co-transfected with either 0.5μg FOP-FLASH or TOP-FLASH plasmids or pGL3-κB-LUC plus 50ng of pRL-TK (expressing Renilla luciferase). Normalized luciferase activity was obtained by using the Dual-Luciferase Reporter Assay System (Promega Inc). Alternatively, stable cell lines expressing the TOP-FLASH reporter were generated by transducing cells with 7TFP (Fuerer and Nusse, 2010) recombinant lentiviruses followed by drug selection.
Supplementary Material
Research Highlights.
The TAK1 kinase promotes survival of KRAS-dependent colon cancer cells.
TAK1 dependency correlates with KRAS-mediated activation of Wnt signaling.
KRAS activates Wnt signaling via TAK1 in APC-deficient cancer cells.
KRAS upregulates BMP signaling leading to increased TAK1 kinase activity.
Acknowledgments
This work was supported by NIH K99 CA149169 to A.S. as well as NIH R01 CA109447 and a Lustgarten Foundation grant to J.S and NIH R01 CA129933 to D.A.H. We are grateful to Randall Peterson, David Ting and Andre Bernards for critical evaluation and comments on the manuscript. We thank Laura Libby and Brian Brannigan for technical assistance with mouse xenograft experiments and KRAS/BRAF sequencing analyses, respectively. We thank Vijay Yajnik for providing TOP-FLASH reporter plasmids. Finally, we also thank Kevin Haigis, Moon Yee Hang, Miguel Rivera, Jianmin Zhang, Mingzhu Liu and Matt Zubrowski for intellectual and technical advice.
Footnotes
Publisher's Disclaimer: This is a PDF file of an unedited manuscript that has been accepted for publication. As a service to our customers we are providing this early version of the manuscript. The manuscript will undergo copyediting, typesetting, and review of the resulting proof before it is published in its final citable form. Please note that during the production process errors may be discovered which could affect the content, and all legal disclaimers that apply to the journal pertain.
References
- Barbie DA, Tamayo P, Boehm JS, Kim SY, Moody SE, Dunn IF, Schinzel AC, Sandy P, Meylan E, Scholl C, et al. Systematic RNA interference reveals that oncogenic KRAS-driven cancers require TBK1. Nature. 2009;462:108–112. doi: 10.1038/nature08460. [DOI] [PMC free article] [PubMed] [Google Scholar]
- Behrens J, von Kries JP, Kuhl M, Bruhn L, Wedlich D, Grosschedl R, Birchmeier W. Functional interaction of beta-catenin with the transcription factor LEF-1. Nature. 1996;382:638–642. doi: 10.1038/382638a0. [DOI] [PubMed] [Google Scholar]
- Bolstad BM, Irizarry RA, Astrand M, Speed TP. A comparison of normalization methods for high density oligonucleotide array data based on variance and bias. Bioinformatics. 2003;19:185–193. doi: 10.1093/bioinformatics/19.2.185. [DOI] [PubMed] [Google Scholar]
- Campeau E, Ruhl VE, Rodier F, Smith CL, Rahmberg BL, Fuss JO, Campisi J, Yaswen P, Cooper PK, Kaufman PD. A versatile viral system for expression and depletion of proteins in mammalian cells. PLoS One. 2009;4:e6529. doi: 10.1371/journal.pone.0006529. [DOI] [PMC free article] [PubMed] [Google Scholar]
- Dennis G, Jr, Sherman BT, Hosack DA, Yang J, Gao W, Lane HC, Lempicki RA. DAVID: Database for Annotation, Visualization, and Integrated Discovery. Genome Biol. 2003;4:P3. [PubMed] [Google Scholar]
- Downward J. Targeting RAS signalling pathways in cancer therapy. Nat Rev Cancer. 2003;3:11–22. doi: 10.1038/nrc969. [DOI] [PubMed] [Google Scholar]
- Ebi H, Corcoran RB, Singh A, Chen Z, Song Y, Lifshits E, Ryan DP, Meyerhardt JA, Benes C, Settleman J, et al. Receptor tyrosine kinases exert dominant control over PI3K signaling in human KRAS mutant colorectal cancers. J Clin Invest. 2011;121:4311–4321. doi: 10.1172/JCI57909. [DOI] [PMC free article] [PubMed] [Google Scholar]
- Eisen MB, Spellman PT, Brown PO, Botstein D. Cluster analysis and display of genome-wide expression patterns. Proc Natl Acad Sci U S A. 1998;95:14863–14868. doi: 10.1073/pnas.95.25.14863. [DOI] [PMC free article] [PubMed] [Google Scholar]
- Fuerer C, Nusse R. Lentiviral vectors to probe and manipulate the Wnt signaling pathway. PLoS One. 2010;5:e9370. doi: 10.1371/journal.pone.0009370. [DOI] [PMC free article] [PubMed] [Google Scholar]
- Gasch AP, Eisen MB. Exploring the conditional coregulation of yeast gene expression through fuzzy k-means clustering. Genome Biol. 2002;3 doi: 10.1186/gb-2002-3-11-research0059. RESEARCH0059. [DOI] [PMC free article] [PubMed] [Google Scholar]
- Haber DA, Gray NS, Baselga J. The evolving war on cancer. Cell. 2011;145:19–24. doi: 10.1016/j.cell.2011.03.026. [DOI] [PubMed] [Google Scholar]
- Hatzis P, van der Flier LG, van Driel MA, Guryev V, Nielsen F, Denissov S, Nijman IJ, Koster J, Santo EE, Welboren W, et al. Genome-wide pattern of TCF7L2/TCF4 chromatin occupancy in colorectal cancer cells. Mol Cell Biol. 2008;28:2732–2744. doi: 10.1128/MCB.02175-07. [DOI] [PMC free article] [PubMed] [Google Scholar]
- Janssen KP, Alberici P, Fsihi H, Gaspar C, Breukel C, Franken P, Rosty C, Abal M, El Marjou F, Smits R, et al. APC and oncogenic KRAS are synergistic in enhancing Wnt signaling in intestinal tumor formation and progression. Gastroenterology. 2006;131:1096–1109. doi: 10.1053/j.gastro.2006.08.011. [DOI] [PubMed] [Google Scholar]
- Lin Z, Gao C, Ning Y, He X, Wu W, Chen YG. The pseudoreceptor BMP and activin membrane-bound inhibitor positively modulates Wnt/beta-catenin signaling. J Biol Chem. 2008;283:33053–33058. doi: 10.1074/jbc.M804039200. [DOI] [PMC free article] [PubMed] [Google Scholar]
- Luo J, Emanuele MJ, Li D, Creighton CJ, Schlabach MR, Westbrook TF, Wong KK, Elledge SJ. A genome-wide RNAi screen identifies multiple synthetic lethal interactions with the Ras oncogene. Cell. 2009a;137:835–848. doi: 10.1016/j.cell.2009.05.006. [DOI] [PMC free article] [PubMed] [Google Scholar]
- Luo J, Solimini NL, Elledge SJ. Principles of cancer therapy: oncogene and non-oncogene addiction. Cell. 2009b;136:823–837. doi: 10.1016/j.cell.2009.02.024. [DOI] [PMC free article] [PubMed] [Google Scholar]
- Lustig B, Jerchow B, Sachs M, Weiler S, Pietsch T, Karsten U, van de Wetering M, Clevers H, Schlag PM, Birchmeier W, et al. Negative feedback loop of Wnt signaling through upregulation of conductin/axin2 in colorectal and liver tumors. Mol Cell Biol. 2002;22:1184–1193. doi: 10.1128/MCB.22.4.1184-1193.2002. [DOI] [PMC free article] [PubMed] [Google Scholar]
- Melisi D, Xia Q, Paradiso G, Ling J, Moccia T, Carbone C, Budillon A, Abbruzzese JL, Chiao PJ. Modulation of pancreatic cancer chemoresistance by inhibition of TAK1. J Natl Cancer Inst. 2011;103:1190–1204. doi: 10.1093/jnci/djr243. [DOI] [PMC free article] [PubMed] [Google Scholar]
- Meylan E, Dooley AL, Feldser DM, Shen L, Turk E, Ouyang C, Jacks T. Requirement for NF-kappaB signalling in a mouse model of lung adenocarcinoma. Nature. 2009;462:104–107. doi: 10.1038/nature08462. [DOI] [PMC free article] [PubMed] [Google Scholar]
- Moffat J, Grueneberg DA, Yang X, Kim SY, Kloepfer AM, Hinkle G, Piqani B, Eisenhaure TM, Luo B, Grenier JK, et al. A lentiviral RNAi library for human and mouse genes applied to an arrayed viral high-content screen. Cell. 2006;124:1283–1298. doi: 10.1016/j.cell.2006.01.040. [DOI] [PubMed] [Google Scholar]
- Nakamura K, Kim S, Ishidate T, Bei Y, Pang K, Shirayama M, Trzepacz C, Brownell DR, Mello CC. Wnt signaling drives WRM-1/beta-catenin asymmetries in early C. elegans embryos. Genes Dev. 2005;19:1749–1754. doi: 10.1101/gad.1323705. [DOI] [PMC free article] [PubMed] [Google Scholar]
- Naldini L, Blomer U, Gallay P, Ory D, Mulligan R, Gage FH, Verma IM, Trono D. In vivo gene delivery and stable transduction of nondividing cells by a lentiviral vector. Science. 1996;272:263–267. doi: 10.1126/science.272.5259.263. [DOI] [PubMed] [Google Scholar]
- Normanno N, Tejpar S, Morgillo F, De Luca A, Van Cutsem E, Ciardiello F. Implications for KRAS status and EGFR-targeted therapies in metastatic CRC. Nat Rev Clin Oncol. 2009;6:519–527. doi: 10.1038/nrclinonc.2009.111. [DOI] [PubMed] [Google Scholar]
- Petrova TV, Nykanen A, Norrmen C, Ivanov KI, Andersson LC, Haglund C, Puolakkainen P, Wempe F, von Melchner H, Gradwohl G, et al. Transcription factor PROX1 induces colon cancer progression by promoting the transition from benign to highly dysplastic phenotype. Cancer Cell. 2008;13:407–419. doi: 10.1016/j.ccr.2008.02.020. [DOI] [PubMed] [Google Scholar]
- Phelps RA, Chidester S, Dehghanizadeh S, Phelps J, Sandoval IT, Rai K, Broadbent T, Sarkar S, Burt RW, Jones DA. A two-step model for colon adenoma initiation and progression caused by APC loss. Cell. 2009;137:623–634. doi: 10.1016/j.cell.2009.02.037. [DOI] [PMC free article] [PubMed] [Google Scholar]
- Rawlins P, Mander T, Sadeghi R, Hill S, Gammon G, Foxwell B, Wrigley S, Moore M. Inhibition of endotoxin-induced TNF-alpha production in macrophages by 5Z-7-oxo-zeaenol and other fungal resorcylic acid lactones. Int J Immunopharmacol. 1999;21:799–814. doi: 10.1016/s0192-0561(99)00047-8. [DOI] [PubMed] [Google Scholar]
- Reid JF, Gariboldi M, Sokolova V, Capobianco P, Lampis A, Perrone F, Signoroni S, Costa A, Leo E, Pilotti S, et al. Integrative approach for prioritizing cancer genes in sporadic colon cancer. Genes Chromosomes Cancer. 2009;48:953–962. doi: 10.1002/gcc.20697. [DOI] [PubMed] [Google Scholar]
- Scholl C, Frohling S, Dunn IF, Schinzel AC, Barbie DA, Kim SY, Silver SJ, Tamayo P, Wadlow RC, Ramaswamy S, et al. Synthetic lethal interaction between oncogenic KRAS dependency and STK33 suppression in human cancer cells. Cell. 2009;137:821–834. doi: 10.1016/j.cell.2009.03.017. [DOI] [PubMed] [Google Scholar]
- Sekiya T, Adachi S, Kohu K, Yamada T, Higuchi O, Furukawa Y, Nakamura Y, Nakamura T, Tashiro K, Kuhara S, et al. Identification of BMP and activin membrane-bound inhibitor (BAMBI), an inhibitor of transforming growth factor-beta signaling, as a target of the beta-catenin pathway in colorectal tumor cells. J Biol Chem. 2004;279:6840–6846. doi: 10.1074/jbc.M310876200. [DOI] [PubMed] [Google Scholar]
- Shin TH, Yasuda J, Rocheleau CE, Lin R, Soto M, Bei Y, Davis RJ, Mello CC. MOM-4, a MAP kinase kinase kinase-related protein, activates WRM-1/LIT-1 kinase to transduce anterior/posterior polarity signals in C. elegans. Mol Cell. 1999;4:275–280. doi: 10.1016/s1097-2765(00)80375-5. [DOI] [PubMed] [Google Scholar]
- Singh A, Greninger P, Rhodes D, Koopman L, Violette S, Bardeesy N, Settleman J. A gene expression signature associated with “K-Ras addiction” reveals regulators of EMT and tumor cell survival. Cancer Cell. 2009;15:489–500. doi: 10.1016/j.ccr.2009.03.022. [DOI] [PMC free article] [PubMed] [Google Scholar]
- Starczynowski DT, Lockwood WW, Delehouzee S, Chari R, Wegrzyn J, Fuller M, Tsao MS, Lam S, Gazdar AF, Lam WL, et al. TRAF6 is an amplified oncogene bridging the RAS and NF-kappaB pathways in human lung cancer. J Clin Invest. 2011;121:4095–4105. doi: 10.1172/JCI58818. [DOI] [PMC free article] [PubMed] [Google Scholar]
- Vogelstein B, Fearon ER, Hamilton SR, Kern SE, Preisinger AC, Leppert M, Nakamura Y, White R, Smits AM, Bos JL. Genetic alterations during colorectal-tumor development. N Engl J Med. 1988;319:525–532. doi: 10.1056/NEJM198809013190901. [DOI] [PubMed] [Google Scholar]
- Whyte DB, Kirschmeier P, Hockenberry TN, Nunez-Oliva I, James L, Catino JJ, Bishop WR, Pai JK. K- and N-Ras are geranylgeranylated in cells treated with farnesyl protein transferase inhibitors. J Biol Chem. 1997;272:14459–14464. doi: 10.1074/jbc.272.22.14459. [DOI] [PubMed] [Google Scholar]
- Xie M, Zhang D, Dyck JR, Li Y, Zhang H, Morishima M, Mann DL, Taffet GE, Baldini A, Khoury DS, et al. A pivotal role for endogenous TGF-beta-activated kinase-1 in the LKB1/AMP-activated protein kinase energy-sensor pathway. Proc Natl Acad Sci U S A. 2006;103:17378–17383. doi: 10.1073/pnas.0604708103. [DOI] [PMC free article] [PubMed] [Google Scholar]
- Zou H, Wieser R, Massague J, Niswander L. Distinct roles of type I bone morphogenetic protein receptors in the formation and differentiation of cartilage. Genes Dev. 1997;11:2191–2203. doi: 10.1101/gad.11.17.2191. [DOI] [PMC free article] [PubMed] [Google Scholar]
Associated Data
This section collects any data citations, data availability statements, or supplementary materials included in this article.