

Abstract
Hippocampal atrophy, posterior cingulate and frontal glucose hypometabolism, and white-matter tract disruption are well-described early macroscopic events in Alzheimer’s disease. The relationships between these three types of alterations have been documented in previous studies, but their chronology still remains to be established. The present study used multi-modal Fluorodeoxyglucose - Positron Emission Tomography and Magnetic Resonance Imaging longitudinal data to address this question in patients with amnestic Mild Cognitive Impairment. We found unidirectional, specific sequential relationships between: i) baseline hippocampal atrophy and both cingulum bundle (r=0.70; p=3.10−3) and uncinate fasciculus (r=0.75; p=7.10−4) rate of atrophy; ii) baseline cingulum bundle atrophy and rate of decline of posterior (r=0.72; p=2.10−3) and anterior (r=0.74; p=1.10−3) cingulate metabolism; and iii) baseline uncinate white matter atrophy and subgenual metabolism rate of change (r=0.65; p=6.10−3). Baseline local grey matter atrophy was not found to contribute to hypometabolism progression within the posterior and anterior cingulate as well as subgenual cortices. These findings suggest that hippocampal atrophy progressively leads to disruption of the cingulum bundle and uncinate fasciculus, which in turn leads to glucose hypometabolism of the cingulate and subgenual cortices, respectively. This study reinforces the relevance of remote mechanisms above local interactions to account for the patterns of brain alteration observed in amnestic Mild Cognitive Impairment, and provides new avenues to assess the sequence of events in complex diseases characterized by multiple manifestations.
Keywords: Aged; Aged, 80 and over; Alzheimer Disease; metabolism; pathology; Atrophy; Brain; metabolism; pathology; Cerebral Cortex; metabolism; pathology; Female; Follow-Up Studies; Hippocampus; metabolism; pathology; Humans; Magnetic Resonance Imaging; Male; Middle Aged; Nerve Fibers, Myelinated; metabolism; pathology; Time Factors
Keywords: Alzheimers disease, MRI/fMRI, PET imaging, white matter, hippocampus
Introduction
Alzheimer’s disease is characterized by distinct brain alterations highlighted in vivo using imaging techniques, including grey matter atrophy, resting-state glucose hypometabolism and disruption of some white matter tracts. More specifically, studies using T1-weighted magnetic resonance imaging (MRI) have shown that the hippocampus is the brain region of highest and earliest atrophy in Alzheimer’s disease (Whitwell et al., 2007; Risacher et al., 2009). Fluorodeoxyglucose - positron emission tomography (18FDG-PET) studies have highlighted early hypometabolism in posterior associative cortical areas, especially in the posterior cingulate cortex and subsequently in prefrontal areas (Morbelli et al., 2009). Finally, studies using voxel-based morphometry (VBM) or diffusion tensor imaging have pointed to the alteration of several white matter tracts in Alzheimer’s disease, particularly the corpus callosum, cingulum bundle, fornix and uncinate fasciculus (Li et al., 2008; Kiuchi et al., 2009; Stricker et al., 2009; Bai et al., 2009b). The discrepancies between structural and functional changes, especially in the posterior cingulate cortex showing early hypometabolism despite non predominant atrophy (Chételat et al., 2008; Alsop et al., 2008), has led to the disconnection hypothesis according to which grey matter atrophy would disrupt white matter tracts and then induce distant hypometabolism (Jobst et al., 1992; Mielke et al., 1996; Matsuda, 2001; Smith, 2002; Nestor et al., 2003). Recently, several functional MRI studies have demonstrated alterations of functional connectivity in Alzheimer’s disease (Wang et al., 2006; Allen et al., 2007; Sorg et al., 2007; Zhang et al., 2009) arguing for the view that Alzheimer’s disease is, at least in part, a disconnection syndrome targeting cerebral regions of a same brain network (Seeley et al., 2009).
Several recent studies have directly assessed the relationship between some of these brain alterations in Alzheimer’s disease or amnestic Mild Cognitive Impairment (aMCI). These studies showed a relationship between hippocampal atrophy and distant alterations including posterior cingulate hypometabolism (Guedj et al., 2009), posterior cingulate activity during a memory task (Garrido et al., 2002; Rémy et al., 2005), and disruption of the cingulum bundle (Firbank et al., 2007; Villain et al., 2008; Choo et al., in press). Thanks to a multi-modal correlative approach, we previously demonstrated a significant relationship between hippocampal atrophy, cingulum bundle disruption and posterior cingulate hypometabolism in patients with Alzheimer’s disease (Villain et al., 2008). Moreover, in another study on aMCI, metabolic decreases in two frontal areas, namely the anterior cingulate cortex and the subgenual area, correlated with posterior cingulate and hippocampal metabolic changes, respectively (Fouquet et al., 2009). The hippocampus being connected to both the posterior and the anterior cingulate cortices via the cingulum bundle, and to the subgenual region via the uncinate fasciculus (Mufson and Pandya, 1984; Morris et al., 1999; Schmahmann and Pandya, 2006; Zhong et al., 2006), the metabolic alteration in these regions was interpreted as reflecting the disruption of these two major hippocampo-frontal pathways as a result of hippocampal atrophy.
There are however several alternatives to this hypothesis. For instance, these inter-related brain alterations may occur in parallel as distinct effects of a common upstream pathological process. Even if they reflect a cascade of sequential events, several mechanisms are still possible: grey matter atrophy or hypometabolism could be responsible for disruption of distant connected white matter tracts, and/or white matter tract disruption could induce distant hypometabolism and grey matter atrophy as a result of Wallerian and retrograde degeneration. Local interactions should also be considered, i.e. grey matter atrophy may induce local hypometabolism and, conversely, hypometabolism may lead to local grey matter atrophy. Determining the initial event responsible for the others is of importance as it may help targeting the key component for therapeutic interventions.
The aim of the present study was therefore to take advantage of repeated multi-modal (18FDG-PET and T1-MRI) acquisitions obtained in patients with aMCI to directly assess the sequential relationships between the main brain alterations observed in early Alzheimer’s disease, namely hippocampal atrophy, cingulate and uncinate fasciculi disruption, and posterior cingulate and medial frontal hypometabolism. To this end, we assessed the local and distant relationships between baseline and rates of change measurements; an alteration A was considered as the starting and preceding event of B if the correlation between baseline A and B rate of change was both statistically significant, and significantly higher than the correlation between A rate of change and baseline B, or baseline A and baseline B.
Material and Methods
Subjects
Seventeen unmedicated amnestic aMCI patients were recruited through a memory clinic. They all complained of memory impairment. They were right-handed, aged over 55 years and had at least 7 years of education (see Table 1 for demographic and clinical characteristics). They underwent medical, neurological, neuropsychological and neuroradiological examinations and were screened for the lack of cerebrovascular risk factors, substance abuse, head trauma and significant MRI (other than cortical atrophy) or biological abnormality. They were selected according to current criteria of single domain aMCI, i.e. isolated episodic memory deficits (>1.5 SD of the normal mean for age and education), normal performance in other areas of cognition and in global cognition (assessed with MMSE and Mattis scales), and NINCDS-ADRDA criteria for probable Alzheimer’s disease (McKhann et al., 1984) not met (see Chételat et al., 2005, for details). All aMCI patients were evaluated every 6 months over an 18-month follow-up period to assess whether they convert to probable Alzheimer’s disease or not. Over the 18-month follow-up period, 7 out of the 17 aMCI patients met NINCDS-ADRDA criteria for probable Alzheimer’s disease. Only patients who had both T1-weighted MRI and 18FDG-PET examinations at baseline and follow-up were included in the present study. The patients were the same as those reported in Fouquet et al. (2009). Seventeen unmedicated right-handed healthy aged controls with at least 7 years of education also underwent both MRI and 18FDG-PET examinations at inclusion. They were screened for the absence of cerebrovascular risk factors, mental disorder, substance abuse, head trauma and significant MRI or biological abnormality. The two groups were matched for age and sex (see Table 1). All the subjects were fully cooperative and free from behavioural disturbances. They all gave their consent to the study after detailed information was provided to them and the PET procedure was approved by the Ethical Committee of the University of Caen. The study was done in line with the Declaration of Helsinki.
Table 1.
Demographic and clinical characteristics of participants.
| Healthy Controls | Patients with amnestic Mild Cognitive Impairment | ||
|---|---|---|---|
| Number | 17 | 17 | |
| Male/Female | 8/9 | 6/11 | |
|
Age at baseline (years) mean ± standard deviation range |
67.7 ± 7.0 60–84 |
71.6 ± 8.9 55–87 |
|
|
MMSE mean ± standard deviation range |
Baseline 27.5 ± 1.2 25–29 |
Follow-up 25.6 ± 3.9 17–30 |
|
(Baseline = Entry in the protocol; Follow-up = 18 months after baseline).
Imaging data acquisition
All the MRI data sets were acquired on the same scanner (1.5 T Signa Advantage echospeed; General Electric, Milwaukee, WI) and using the same acquisition parameters. MRI consisted in a set of 128 adjacent axial slices parallel to the anterior commissure-posterior commissure (AC-PC) line with slice thickness 1.5 mm and pixel size 0.9375×0.9375 mm2 using a spoiled gradient echo sequence (SPGR) (repetition time (TR)=10.3 ms; echo time (TE)=2.1 ms; field of view (FoV)=240×180 mm2; matrix=256×192).
18FDG-PET data were collected using the Siemens ECAT Exact HR+ PET device with resolution of 4.2×4.2×4.6mm3 (x y z) (axial FoV= 158 mm). Patients had been fasting for at least 4 hours before scanning. To minimize anxiety, the PET procedure was explained in detail beforehand. Head was positioned on a head-rest according to the cantho-meatal line and gently restrained with straps. 18FDG uptake was measured in the resting condition, with eyes closed, in a quiet and dark environment. A catheter was introduced in a vein of the arm to inject the radiotracer. Following 68Ga transmission scans, three to five mCi of 18FDG were injected as a bolus at time 0, and a 10 min PET data acquisition started at 50 min post-injection. Sixty-three planes were acquired with septa out (3D acquisition), using a voxel size of 2.2×2.2×2.43 mm3 (x y z).
Imaging data handling and transformation
MRI data
MRI data sets were analyzed using Statistical Parametric Mapping (SPM5; http://www.fil.ion.ucl.ac.uk/spm). First, in order to reduce noise differences between baseline and follow-up MRI data and thus to improve the accuracy of baseline-to-follow-up change measurements, we used a procedure derived from our previous longitudinal VBM procedure (Chételat et al., 2005): i) pairs of raw baseline and follow-up MRI were first rigidly coregistered and a high dimensional warping was then undertaken to calculate volumetric deformations from baseline to follow-up MRI and from follow-up to baseline MRI (Ashburner and Friston, 2004); ii) warps from baseline to follow-up MRI were then applied to the baseline MRI data sets and warps from follow-up to baseline MRI were applied to the follow-up MRI data set; iii) finally a softmean MRI was calculated for each baseline (baseline plus warped follow-up) and follow-up (follow-up plus warped baseline) MRI data set.
These baseline and follow-up softmean MRI data were then segmented using VBM5.1 (http://dbm.neuro.uni-jena.de/vbm/) and imported into the diffeomorphic DARTEL pipeline (Ashburner, 2007). Using this pipeline, seventeen ‘single-subject baseline-follow-up templates’ were first created and then averaged to create a ‘group template’. For each subject, baseline and follow-up softmean grey matter, white matter and cerebrospinal fluid (CSF) data sets were normalized to the group template by applying a combination of the deformation parameters from both warps (i.e. the warp to the single-subject baseline-follow-up template and the warp to the group template). Resultant images were modulated by the jacobian determinants, smoothed at 9 mm full width at half-maximum (FWHM) and masked (see below).
For the sake of group comparison, baseline MRI data from healthy controls were segmented using VBM5.1 and warped to the same group template as that used for aMCI patients using the DARTEL pipeline.
18FDG-PET data
18FDG-PET data were first corrected for partial volume effect due to both CSF and white matter using the optimal voxel-by-voxel method originally proposed by Müller-Gartner et al. (1992), and slightly modified as proposed by Rousset et al. (1998). This method, referred to as ‘modified Müller-Gartner’, is described in detail in Quarantelli et al. (2004), and has been widely applied in our laboratory (Chételat et al., 2003b; Mevel et al., 2007; Chételat et al., 2008; Villain et al., 2008; Fouquet et al., 2009). All image processing steps for partial volume effect correction were carried out using the ‘PVE-lab’ software (Quarantelli et al., 2004). 18FDG-PET data were then scaled using a metabolically preserved brain region, namely the cerebellar vermis, to control for inter- and intra-individual global variations in 18FDG-PET signal (Mevel et al., 2007). Using SPM5, baseline partial volume effect-corrected 18FDG-PET data of controls and baseline and follow-up partial volume effect-corrected scaled 18FDG-PET data of aMCI patients were then coregistered onto their respective MRI and spatially normalized onto the same group template as that used for the spatial normalization of MRI data, by reapplying the combined warping parameters estimated from the DARTEL pipeline. The normalized 18FDG-PET data sets were then smoothed (8 mm FWHM; see below) and masked using the same grey matter mask as that used for the grey matter partition obtained from MRI data (see below).
Differential smoothing
To blur individual variations in gyral anatomy and increase the signal-to-noise ratio, the spatially normalized grey and white matter partitions and the partial volume effect-corrected spatially normalized 18FDG-PET data sets were smoothed. We used a Gaussian kernel of 8 mm FWHM for the 18FDG-PET data. Since 18FDG-PET and MRI data had different original spatial resolutions, differential smoothing was applied in order to obtain images of equivalent effective smoothness, and thus of identical resultant resolution (Richardson et al., 1997; Van Laere and Dierckx, 2001). To this end, we used a Gaussian kernel of 9 mm FWHM for the MRI grey and white matter data, resulting in an effective smoothness identical to 18FDG-PET images smoothed at 8 mm FWHM (Poline et al., 1995).
Masking
The grey matter, white matter and 18FDG-PET images obtained following the steps above were masked so as to include only grey or white matter voxels of interest and to prevent any overlap between voxels included in analyses with grey matter and those with white matter. The grey matter mask corresponded to the voxels of the group template with a grey matter probability higher than both white matter and CSF probabilities (grey matter>white matter ∩ grey matter>CSF) and the white matter mask to the voxels of the group template with a white matter probability higher than both grey matter and CSF probabilities (white matter>grey matter ∩ white matter>CSF), thus avoiding any overlap between voxels included in analyses with grey matter and those with white matter.
Percent change maps
For each aMCI patient, maps of percent annual change were created for each imaging modality (grey matter, white matter, 18FDG-PET). The percent change maps represent the voxel-wise calculation of percent change in one imaging modality over the 18-month follow-up period expressed as annual percent: (Fouquet et al., 2009). Briefly, percent change maps were calculated from baseline and follow-up images warped to the single-subject template and smoothed at 3 mm FWHM (baseline and follow-up 18FDG-PET data) or at 5.15 mm FWHM (baseline and follow-up grey and white matter data). Percent change maps were then warped onto the group template, smoothed at 7.4 mm FWHM - resulting in an effective smoothness identical to baseline or follow-up 18FDG-PET images smoothed at 8 mm FWHM - and masked using the grey or white matter mask described above.
Statistical analyses
Intra-modality analyses
For the sake of completeness, we first assessed the baseline patterns of grey and white matter atrophy by comparing the smoothed and masked grey or white matter baseline data sets of aMCI patients to those of controls using a ‘Two-sample t-test’ in SPM5 with total intracranial volume (TIV) as a covariate. Patterns of grey and white matter atrophy evolution within the aMCI sample were then assessed using a ‘Paired t-test’ in SPM5 with TIV as a covariate. The baseline pattern of grey matter hypometabolism and its evolution were assessed performing the same statistical analyses with 18FDG-PET data set except that TIV was not used as a covariate.
Inter-modality analyses
Voxel-to-voxel inter-modality analyses (Figure 3-I and -II)
Figure 3. Design for the inter-modality statistical analyses.
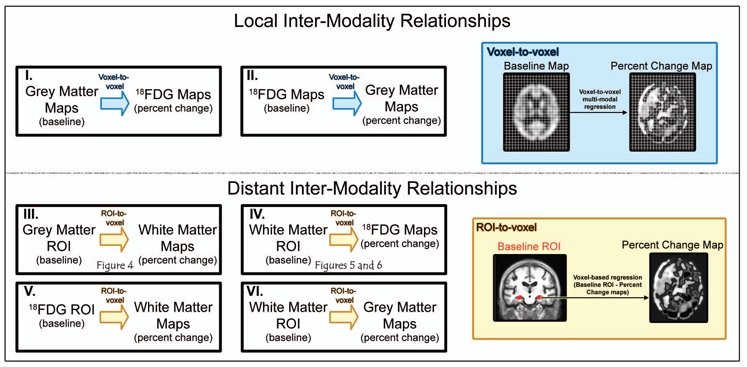
First, we assessed the relationships between baseline measures of grey matter atrophy and the evolution of local hypometabolism, and between baseline measures of grey matter hypometabolism and the evolution of local atrophy using a voxel-to-voxel correlation approach (I and II and blue box). Second, we assessed the distant effects of each baseline alteration in predefined regions of interest (ROI) onto the evolution of alterations in other modalities using a ROI-to-voxel approach (III, IV, V and VI and yellow box).
To assess whether baseline grey matter atrophy induces local hypometabolism, or conversely whether baseline hypometabolism induces local grey matter atrophy (Figure 3-I and 3-II), we performed two voxel-to-voxel multi-modal regressions between baseline grey matter maps and percent change 18FDG-PET maps (with TIV as a covariate) and between baseline 18FDG-PET maps and grey matter percent change maps using the Biological Parametric Mapping Toolbox (Casanova et al., 2007).
ROI-to-voxel distant inter-modality analyses
We then assessed the relationship between baseline alterations and rates of change in distant brain areas (Figure 3-III and 3-IV) to test the hypotheses listed in the Introduction. We used the main brain alterations observed in early Alzheimer’s disease, namely hippocampal atrophy, cingulate and uncinate fasciculi disruption, and posterior cingulate and medial frontal hypometabolism, as starting points in regions of interest (ROI)-to-voxel analyses between baseline measurements and percent change maps. According to our hypotheses, these relationships were only assessed in the biologically expected (i.e. positive) direction.
i. Relationships between baseline hippocampal atrophy and white matter MRI percent change maps (Figure 3-III)
First, the distant effects of baseline hippocampal atrophy on the evolution of white matter alterations were assessed. Baseline mean hippocampal grey matter values were extracted from the significantly atrophied hippocampal grey matter voxels (obtained by assessing the baseline pattern of grey matter atrophy), using a p uncorrected for multiple comparisons <0.001 threshold with k>50 mm3. Anatomical delineation of the hippocampus, used for data extraction, was based on the AAL software (Tzourio-Mazoyer et al., 2002). Since AAL labelling was performed on the MNI Single Subject Colin27 T1-MRI, we segmented the raw T1-MRI of the MNI single-subject using VBM5.1, warped it onto the 17 aMCI group template using the DARTEL pipeline and applied this transformation to the AAL label map using a nearest-neighbour interpolation.
Positive regressions were then computed across the 17 aMCI patients between mean hippocampal baseline grey matter values and whole brain white matter percent change maps, with TIV as a covariate, using the “Multiple Regression” SPM5 routine.
ii. Correlation between baseline ROI white matter values and whole brain 18FDG-PET and grey matter MRI percent change maps (Figure 3-IV and 3-VI)
The effects of baseline white matter alterations in the two ROI (cingulum and uncinate fascicle) on the progression of grey matter hypometabolism or atrophy over time were then assessed. Mean baseline white matter values were extracted in these two regions for each patient from the significant clusters of the previous voxel-based regression analysis (between hippocampal baseline grey matter values and white matter percent change maps) thresholded at p uncorrected <0.001 with k>50 mm3. For each cluster, individual baseline values of white matter were then entered as covariate in a regression analysis with whole brain 18FDG-PET percent change maps or grey matter percent change maps, using the TIV as a covariate and the “Multiple Regression” SPM5 routine.
iii. Correlation between baseline ROI 18FDG-PET values and whole brain white matter percent change maps (Figure 3-V)
Finally, the relationships between baseline grey matter hypometabolism in the posterior cingulate cortex, the anterior cingulate or the subgenual areas and white matter atrophy percent change maps were assessed. Mean posterior cingulate baseline 18FDG-PET values were extracted from the significantly hypometabolic posterior cingulate voxels (obtained by assessing the baseline pattern of grey matter hypometabolism), using a p uncorrected for multiple comparisons <0.001 threshold with k>50 mm3. Anatomical delineation of the posterior cingulate cortex, for data extraction, was based on the AAL software adapted to our template (see above). Positive regressions were then computed across the 17 aMCI patients between mean posterior cingulate baseline 18FDG-PET values and whole brain white matter percent change maps, with TIV as covariate, using the “Multiple Regression” SPM5 routine.
Baseline mean anterior cingulate 18FDG-PET values were extracted from the significant cluster of the previous voxel-based regression analysis (between cingulum bundle baseline white matter values and 18FDG-PET percent change maps), using a p uncorrected for multiple comparisons <0.005 threshold with k>50 mm3. Positive regressions were then computed across the 17 aMCI patients between baseline mean anterior cingulate 18FDG-PET values and whole brain white matter percent change maps, with TIV as a covariate, using the “Multiple Regression” SPM5 routine.
Baseline mean subgenual 18FDG-PET values were extracted from the significant cluster of the previous voxel-based regression analysis (between uncinate fasciculus baseline white matter values and 18FDG-PET percent change maps), using a p uncorrected for multiple comparisons <0.005 threshold with k>50 mm3. Since this cluster did not encompass other anatomical regions, no anatomical labelling was necessary. Positive regressions were then computed across the 17 aMCI patients between baseline mean subgenual 18FDG-PET values and whole brain white matter percent change maps, with TIV as a covariate, using the “Multiple Regression” SPM5 routine.
Testing the unidirectionality of intermodality distant relationships
As stated in the Introduction, the unidirectionality of the correlations between baseline A and B rate of change was assessed by comparing the strength of this correlation to that of the correlation between baseline B and A rate of change, as well as that between baseline A and baseline B. Hence, for each significant relationship identified between two regions A and B in the voxel-to-voxel or ROI-to-voxel regression analyses above, we extracted the baseline and percent change mean values in the significant clusters and computed three multiple regression analyses using Statistica software (Statsoft, Tulsa, OK): i) with baseline A values as the predictive variable and B percent change as the dependent variable; ii) with A percent change as the predictive variable and baseline B as the dependent variable; and iii) with baseline A as the predictive variable and baseline B as the dependent variable. The TIV was also introduced as a predictive variable in all multiple regression analyses. The three resulting partial correlation coefficients between A and B values were then statistically compared (Steiger, 1980).
Evaluation of the relative contribution of disconnection to hypometabolism through multiple regression analyses
In a last set of analyses, we assessed whether white matter atrophy provides significant independent contribution to 18FDG-PET percent change, over and above local grey matter atrophy. To this aim, we conducted three independent multiple regression analyses, one for each of the three metabolic ROI (i.e. the posterior cingulate, anterior cingulate and subgenual areas). Each 18FDG-PET percent change ROI value was entered in a multiple regression including three predictive variables, i.e. the corresponding baseline white matter value, local baseline grey matter value and TIV.
Statistical threshold and display of results
SPM-T maps of all previously described analyses were thresholded using a p uncorrected < 0.001 threshold with a k > 50 mm3. For the sake of illustration, a lower threshold (p <0.005) was used in some figures but this was then explicitly specified. Anatomical localization was based on the superimposition of the SPM-T maps onto the group template, and identification of the localization using the AAL software and anatomical atlases (Talairach and Tournoux, 1988; Tzourio-Mazoyer et al., 2002; Mori et al., 2005). The findings were rendered using the publicly available “Anatomist/BrainVISA” and “MRIcroN” software (www.brainvisa.info; http://www.sph.sc.edu/comd/rorden/mricron/).
Results
Profiles of grey matter atrophy, glucose hypometabolism and white matter atrophy
The profiles of baseline grey matter atrophy and hypometabolism have already been described elsewhere (Chételat et al., 2003a; Chételat et al., 2005; Fouquet et al., 2009) and are presented here in a single integrated figure (Figure 1) to provide a comprehensive view of brain alterations in this sample of aMCI patients. They showed the prominent involvement of the hippocampus for grey matter atrophy and of the posterior cingulate cortex for hypometabolism in aMCI, relative to controls. The highest changes over the 18-month follow-up affected the medial and lateral temporal, parietal and frontal lobes for grey matter atrophy, and posterior cingulate, lateral parietal and prefrontal areas for metabolic changes (see Chételat et al., 2003a; Chételat et al., 2005; Fouquet et al., 2009 for details). The profiles of cross-sectional and longitudinal white matter changes, not detailed elsewhere, are shown in Figure 2. Baseline white matter atrophy mainly involved bilaterally the perforant path, caudal part of the cingulum bundle and fornix as well as extensive left temporal white matter areas encompassing the superior and inferior longitudinal fasciculi, and right frontal white matter areas (Figure 2, green). Evolving white matter atrophy over the 18-month follow-up concerned mainly a large bilateral fronto-parietal cluster including the superior longitudinal fasciculus, rostral part of the cingulum bundle and superior fronto-occipital fasciculus, as well as the left uncinate fasciculus, bilateral perforant path and cortico-spinal tracts (Figure 2, red).
Figure 1. Brain patterns of grey matter atrophy and 18FDG hypometabolism in a MCI.
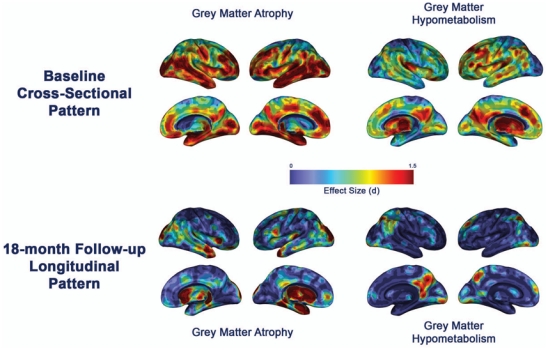
Profiles of brain alterations in patients with aMCI at baseline compared to healthy elderly (top) and over the 18-month follow-up (bottom). The effect size of each pattern is displayed on semi-inflated Anatomist 3D render (www.brainvisa.info; right and left hemispheres: lateral and medial views).
Figure 2. Illustration of white matter alterations.
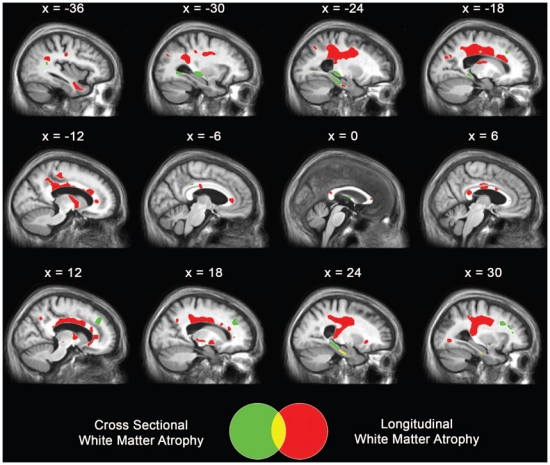
Areas of significant decrease in white matter regional volume in patients with aMCI at baseline compared to controls (green), and over the 18-month follow-up (red). Results are displayed at p < 0.001 uncorrected with k > 50 mm3 and projected onto sagittal sections of the mean aMCI MRI group template.
Voxel-to-voxel inter-modality regressions reveal no relationship between baseline grey matter atrophy or hypometabolism, and local changes over time
The voxel-to-voxel regression analyses between baseline grey matter maps and 18FDG-PET percent annual change (percent change) maps, and between baseline 18FDG-PET maps and grey matter-MRI percent change maps did not reveal any statistically significant finding (Figure 3-I and 3-II). This suggests that baseline atrophy is not related to local metabolic decrease over the subsequent 18 months, and conversely that baseline hypometabolism does not predict subsequent local grey matter atrophy.
Baseline alterations are found to be related to changes over time in distant brain regions
i. Hippocampal atrophy at baseline is related to subsequent disruption of both the cingulum bundle and the uncinate fasciculus
The results of the ROI-to-voxel regression between significantly atrophied hippocampal baseline grey matter values and white matter percent change maps are displayed in Figure 4. Significant regressions were found with the caudal part of the right cingulum bundle, left temporal and orbito-frontal white matter clusters belonging to the uncinate fasciculus, left internal capsule and middle part of the corpus callosum.
Figure 4. Relationship between baseline hippocampal atrophy and white matter-MRI percent change maps.

Results of the ROI-to-voxel regression analysis between baseline hippocampal grey matter volume and white matter percent change maps (thresholded at p < 0.005 uncorrected with k > 50 mm3). Left side of the brain is on the left.
ii. Baseline alterations of both the cingulum bundle and the uncinate fasciculus are related to subsequent annual rates of cortical hypometabolism, but not of atrophy
The results of the ROI-to-voxel regressions between baseline cingulum bundle white matter values and 18FDG-PET percent change maps (Figure 3-IV) are displayed in Figure 5. Significant regressions were found within the right posterior cingulate cortex (mostly its retrosplenial part; BA29/30), the right anterior cingulate cortex, the right parahippocampal/fusiform gyrus, and the right caudate nucleus. The results of the ROI-to-voxel regressions between baseline uncinate fasciculus white matter values and 18FDG-PET percent change maps (Figure 3-IV) are displayed in Figure 6. Significant regressions were found within extensive cortical areas including the subgenual area, left dorso-lateral prefrontal cortex, bilateral cingulate gyrus, right precuneus, right superior parietal lobule, and left occipital lobe. The ROI-to-voxel regressions between either the cingulum bundle or the uncinate fasciculus baseline white matter values and grey matter-MRI percent change maps (Figure 3-VI) did not reveal any significant finding.
Figure 5. Relationship between baseline cingulum bundle atrophy and 18FDG-PET percent change maps.
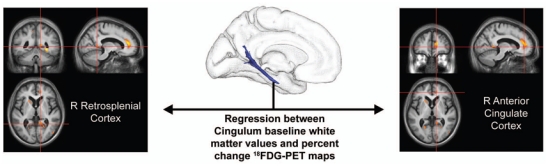
Results of the ROI-to-voxel regression analysis between baseline cingulum bundle (highlighted in Figure 4) white matter volume and 18FDG-PET percent change maps (thresholded at p < 0.005 uncorrected with k > 50 mm3). Left side of the brain is on the left.
Figure 6. Relationship between baseline uncinate fasciculus atrophy and 18FDG-PET percent change maps.
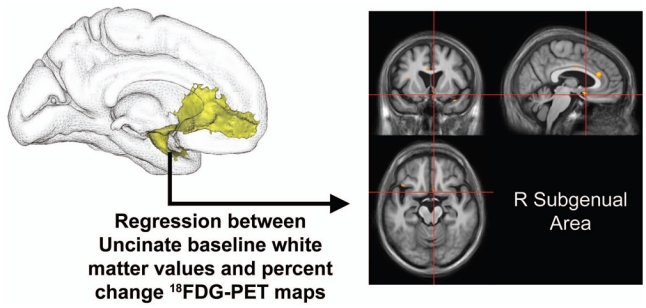
Results of the ROI-to-voxel regression analysis between baseline white matter volume in the uncinate fasciculus (highlighted in Figure 4) and 18FDG-PET percent change maps (thresholded at p < 0.005 uncorrected with k > 50 mm3). Left side of the brain is on the left.
iii. Baseline metabolic alteration in either the posterior cingulate cortex or the medial frontal ROI is not related to subsequent white matter rates of atrophy
None of the three ROI-to-voxel regressions between baseline posterior cingulate, anterior cingulate or subgenual areas 18FDG-PET values and white matter percent change maps (Figure 3-V) revealed any significant finding.
The same findings were obtained for all these analyses when introducing age and status conversion (converters vs. non-converters) as covariates (data not shown).
Intermodalities distant relationships show a specific direction from hippocampal atrophy to white matter alterations and from white matter alterations to grey matter hypometabolism
The results of the comparison analyses between the partial correlation coefficients of baseline-to-percent change, percent change-to-baseline, and baseline-to-baseline regressions are reported in Table 2. They showed that the partial correlations between baseline hippocampal atrophy and white matter percent change values in the cingulate and uncinate fasciculi were higher than the partial correlations between baseline white matter values and baseline or percent change hippocampal atrophy, and that the partial correlations between baseline white matter alterations and 18FDG-PET percent change values were higher than the corresponding partial correlations between baseline 18FDG-PET values and white matter baseline or percent change values. The statistical comparison among these partial correlation coefficients (Steiger, 1980) revealed that almost all these differences were statistically significant (see Table 2 for details).
Table 2. Test of the unidirectionality of inter-modality distant relationships.
Multiple regressions between Baseline-to-Percent Change, Percent Change-to-Baseline, and Baseline-to-Baseline values of the regions of interest (ROI) highlighted in the ROI-to-voxel analyses (with TIV as a covariate), and statistical comparisons among the partial correlation coefficients highlighted in the regressions.
| Alteration A | Alteration B | Partial Correlations Coefficients (p value) | ||
|---|---|---|---|---|
| Baseline A–B Percent Change | A Percent Change-Baseline B | Baseline A–Baseline B | ||
| Hippocampus Grey Matter | Cingulum Bundle White Matter | 0.70 (3.10−3) | −0.51 (0.04)** | 0.05 (0.84)** |
| Hippocampus Grey Matter | Uncinate Fasciculus White Matter | 0.75 (7.10−4) | −0.05 (0.84)** | 0.51 (0.04) |
| Cingulum Bundle White Matter | Posterior Cingulate Cortex 18FDG-PET | 0.72 (2.10−3) | 0.27 (0.30)* | 0.20 (0.44)* |
| Cingulum Bundle White Matter | Anterior Cingulate Cortex 18FDG-PET | 0.74 (1.10−3) | 0.24 (0.37)* | 0.11 (0.69)** |
| Uncinate Fasciculus White Matter | Subgenual Area 18FDG-PET | 0.65 (6.10−3) | −0.08 (0.77)** | −0.09 (0.73)** |
Stars indicate that the r value is significantly lower than the corresponding partial correlation coefficient for Baseline A – B Percent Change
: p <.05;
p <.01.
The relationships between baseline white matter alterations and metabolic changes in the ROI are independent from local baseline grey matter atrophy
The results of the ROI-based multiple regression analyses between 18FDG-PET percent change ROI values and the corresponding baseline white matter values and local baseline grey matter values are reported in Figure 7. All multiple regression analyses were significant and revealed that only the baseline white matter alteration, but not the baseline local grey matter atrophy, provided a significant independent contribution to the model.
Figure 7. Relative contribution of distant baseline white matter atrophy and local baseline grey matter atrophy onto glucose hypometabolism evolution, using multiple regression analyses.
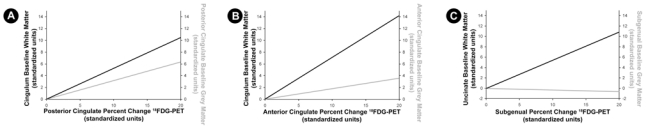
(A) Multiple regression using posterior cingulate 18FDG-PET percent change values as a dependent variable and baseline measures of cingulum bundle white matter volume and posterior cingulate grey matter volume (and TIV) as predictive variables. The multiple regression is statistically significant (R2=0.61, p= 6.10−3), and only the cingulum bundle baseline white matter provides a significant independent contribution to the model (p= 0.03, partial r=0.55; black slope), while baseline posterior cingulate atrophy shows no significant independent contribution (p= 0.14, partial r= 0.40; grey slope).
(B) Multiple regression using the anterior cingulate 18FDG-PET percent change value as a dependent variable and baseline measures of cingulum bundle white matter volume and anterior cingulate grey matter volume (and TIV) as predictive variables. The multiple regression is statistically significant (R2=0.68, p= 2.10−3), and only the cingulum bundle baseline white matter provides a significant independent contribution to the model (p= 2.10−3, partial r=0.72; black slope), while baseline anterior cingulate atrophy shows no significant independent contribution (p= 0.45, partial r= 0.21; grey slope).
(C) Multiple regression with the subgenual 18FDG-PET percent change value as a dependent variable and baseline measures of uncinate fasciculus white matter volume and subgenual grey matter volume (and TIV) as predictive variables. The multiple regression is statistically significant (R2=0.44, p= 0.049), and only the cingulum bundle baseline white matter provides significant independent contribution to the model (p= 8.10−3, partial r=0.65; black slope), while baseline anterior cingulate atrophy shows no significant independent contribution (p= 0.87, partial r= −0.05; grey slope).
Discussion
This study investigated the sequential relationships between the main grey and white matter structural and metabolic alterations observed in aMCI. Our findings indicate that in aMCI hippocampal atrophy is related to subsequent disruption of both the uncinate fasciculus and the cingulum bundle. Fibre loss in these white matter tracts is in turn related to the metabolic decrease observed in the posterior cingulate and medial orbito-frontal cortices. This interpretation is based on three sets of results from independent successive analyses. Firstly, we found baseline hippocampal grey matter atrophy to be related to white matter changes over time, and baseline white matter atrophy to metabolic changes over time, but neither baseline white matter nor baseline 18FDG-PET alterations were significantly related to subsequent grey or white matter changes. Secondly, these specific baseline-to-percent change relationships were significantly stronger than the corresponding percent change-to-baseline or baseline-to-baseline correlations, suggesting a unidirectional sequential relationship. Thirdly and finally, the relationship between the baseline white matter alterations and the grey matter metabolism decrease over time remained statistically significant even after removing the effect of baseline local grey matter atrophy, indicating that disruption of white matter tracts provides independent contribution to progressive metabolic changes, over and above local grey matter atrophy.
A comprehensive overview of grey matter atrophy, hypometabolism and white matter alterations in aMCI at baseline, and their evolution over the 18-month follow up period were presented. Apart from white matter atrophy, these findings have already been published and discussed (Chételat et al., 2003a; Chételat et al., 2005; Fouquet et al., 2009). Regarding white matter atrophy, volume loss was found at baseline in aMCI compared to controls in the cingulum bundle (caudal part), fornix, perforant path, and frontal and temporal white matter. These findings, obtained using VBM, are consistent with previous studies using diffusion tensor imaging that reported diffusivity increase or anisotropy decrease in the same set of white matter areas (Fellgiebel et al., 2004; Medina et al., 2006; Zhang et al., 2007; Huang et al., 2007; Ukmar et al., 2008; Wang et al., 2009; Chua et al., 2009; Kiuchi et al., 2009; Stricker et al., 2009), while atrophy of the perforant path has been previously reported in a VBM study on aMCI (Stoub et al., 2006). Assessing the progression of white matter atrophy over the 18-month follow-up period demonstrated a significant tissue loss within the rostral cingulum bundle, superior longitudinal fasciculus, superior fronto-occipital fasciculus, uncinate fasciculus, perforant path and cortico-spinal tract. This is the first longitudinal study describing white matter change over time throughout the whole brain either in aMCI or in Alzheimer’s disease. Fractional anisotropy changes over 3-month follow-up have been previously assessed in aMCI using diffusion tensor imaging in a selected set of ROI (including the fornix, cingulum bundle, corpus callosum splenium and cerebral peduncles), showing significant changes within the rostral part of the cingulum only (Mielke et al., 2009). Our findings are consistent with this previous report although we assessed the whole brain over a much longer follow-up period, and also reveal the involvement of additional tracts. Our findings of significant white matter loss in the superior longitudinal, superior fronto-occipital and uncinate fasciculi suggest the disruption of frontal connections with the parietal, occipital and temporal lobes, respectively. Moreover, the perforant path was also found to be progressively atrophied over the follow-up period, suggesting that this early process still progresses while atrophy spreads to several neo-cortical areas.
In a previous cross-sectional study in mild Alzheimer’s disease, baseline measures of hippocampal grey matter atrophy was found to correlate to cingulum bundle atrophy, itself related to posterior cingulate glucose hypometabolism (Villain et al., 2008), consistent with the known strong anatomical connection via the cingulum between hippocampus and posterior cingulate cortex (Kobayashi and Amaral, 2003). In the present study, we also found significant relationships between these three alterations in an independent sample of patients with aMCI (see Figure 8). Importantly, the present study shows that this relationship was not present at baseline but was found between baseline hippocampal grey matter atrophy and subsequent cingulum bundle atrophy, as well as between baseline cingulum atrophy and subsequent posterior cingulate hypometabolism. These findings therefore support the hypothesis of a sequential relationship between these pathological events. Although other processes may also independently contribute to each of the events, our results strongly suggest that hippocampal atrophy induces a progressive breakdown of cingulum fibres, which itself progressively leads to posterior cingulate hypometabolism. This proposed sequence of events would be in agreement with animal lesion studies where experimentally induced neuronal death, and inherent axonal Wallerian degeneration, were shown to lead to long-term neuronal alterations in projection sites of damaged neurons, such as decreases in glucose consumption and in the expression of metabolic-relevant genes and alteration of synaptic plasticity (Meguro et al., 1999; Albasser et al., 2007; Machado et al., 2008; Poirier et al., 2008; Garden et al., 2009). The baseline-to-baseline relationships observed in the Alzheimer’s disease stage (Villain et al., 2008) but not in the present study may reflect the long-term consequence of this process.
Figure 8. Overview of the results of the inter-modality analyses highlighting the chronology of events in aMCI.

1. Baseline hippocampal atrophy (red) is related to both cingulum bundle (blue) and uncinate fasciculus (yellow) white matter atrophy rates of change (orange arrows). 2. Baseline cingulum bundle white matter atrophy in turn relates to posterior cingulate (green) and anterior cingulate (pink) metabolic rates of change (dark red arrows), and baseline uncinate fasciculus white matter atrophy to subgenual (cyan) metabolic rate of change (dark red arrows).
Our findings also highlight a second pathway of related sequential events, starting from hippocampal atrophy and eventually leading to hypometabolism in two medial frontal regions, namely the anterior cingulate and subgenual areas (see Figure 8). More specifically, specific relationships were found between hippocampal atrophy and progression of i) uncinate fasciculus disruption, in turn predicting subgenual hypometabolism, and ii) caudal cingulum disruption, in turn related to anterior cingulate metabolism. The present findings are consistent with those obtained in our previous 18FDG-PET study (Fouquet et al., 2009), but they emphasize the temporality thereby further suggesting a causality between these different events. Our interpretation is consistent with strong neuroanatomical evidence for a direct connection between medial temporal lobe structure and medio-orbital frontal cortex via the uncinate fasciculus (Barbas and Blatt, 1995; Carmichael and Price, 1995; Kondo et al., 2005; Zhong et al., 2006; Saleem et al., 2008). Taken together, our data also support the idea that the posterior cingulate cortex is an important crossroads on the indirect hippocampo-frontal route passing through the cingulum (Mufson and Pandya, 1984; Morris et al., 1999; Kobayashi and Amaral, 2003; Kobayashi and Amaral, 2007; Shibata and Naito, 2008).
White matter atrophy was found to influence remote metabolism over and above local grey matter structural alterations, which is consistent with our previous finding in Alzheimer’s disease (Chételat et al., 2009). Nonetheless, the multiple regression analyses showed that distant and local atrophy together accounted for only 45 to 70% of total metabolic change variance in these regions. Although the remaining unexplained 30–55% may be due to methodological limitations (see below), they might also reflect additional local mechanisms contributing to grey matter hypometabolism and white matter disruption, such as soluble and insoluble β-amyloid, inflammation, oxidative stress, amyloid angiopathy, myelin loss and astrocyte degradation or gliosis (Chételat et al., 2008; Buckner et al., 2008; Mosconi et al., 2008; Gouw et al., 2008; Bai et al., 2009a). It is possible that some of these alterations, such as myelin disruption, in turn induce remote grey matter loss through retrograde or Wallerian degeneration (Bartzokis, in press; Bai et al., 2009a), although the present study do not support this hypothesis.
There are several limitations to the current study. Our sample of aMCI patients is relatively small, which may limit our statistical power. Therefore negative findings should be considered with caution. However, the sample was extremely homogeneous clinically. Moreover, note that all the findings that have been published from this cohort have been fully consistent with the literature and/or consistently replicated with sometimes much larger samples (e.g. Risacher et al., 2009). Although limited in size, our sample therefore seems to well represent prodromal/early Alzheimer’s disease. Other aetiologies for aMCI are possible (Petersen and Negash, 2008), but the aMCI criteria used here, namely, single-domain amnestic aMCI (Petersen and Negash, 2008), defines the most specific clinical entity for the early stage of Alzheimer’s disease (Mitchell and Shiri-Feshki, 2009). Still, the results depicted here are essentially a snapshot of the dynamics of structure and metabolism over a short observation period, and do not represent the whole variability spectrum nor the entire course of Alzheimer’s disease. Note also that the use of VBM to assess white matter alteration could be disputed. Diffusion tensor imaging is probably more specific than VBM to axonal damage (Gouw et al., 2008) and allows better identification and isolation of white matter tracts. However, our findings are highly consistent with those obtained using diffusion tensor imaging (see above and Villain et al., 2008), and both methods are known to produce highly correlated assessment of white matter damage (Gouw et al., 2008). As white matter atrophy measured with VBM can result from white matter-CSF boundary changes (see for instance Balthazar et al., 2009, Figure 2) rather than proper white matter alteration, we conducted supplementary white matter analyses where this boundary shift was controlled for by measuring ‘white matter density’ modifications. We were thus able to demonstrate that our findings were not the mere reflection of white matter-CSF boundary shift (see Figure 2, Supplementary Material and Figure S1). Note also that findings obtained using VBM within the deep grey matter could be biased due to segmentation issues in these regions (Ashburner and Friston, 2005), so that we decided not to consider such findings in the present study. Also, one could argue that the sequential analysis approach used in this study is biased as the ROI definition for data extraction between the imaging modalities is not symmetric and therefore not independent. There was no unique method allowing to individualize all the ROI we were interested in, so we decided to use this sequential approach which could be applied to most ROI. Note however that we also used alternative methods for ROI definitions and the findings were almost unchanged (see Supplementary Material and Tables S1 and S2). Besides, the estimation of longitudinal changes is based on measurements at two time points only, which is more sensitive to test-retest noise than multiple assessments and assumes a linear change between the two measures which is not necessarily true (Jack et al., 2008; Schuff et al., 2009). Finally, even if the sequential relationships highlighted here provide strong arguments for causal links and diaschisis in Alzheimer’s disease, they do not provide a direct evidence for these mechanisms since other factors not assessed here such as amyloid deposition may mediate these relationships (Delatour et al., 2004; Chételat et al., 2010).
In summary, this study shows a temporal sequence of events supporting the causality between the different brain alterations observed in Alzheimer’s disease using in vivo neuroimaging. Hippocampal atrophy thus appears to cause progressive disruption in at least two brain pathways, namely the cingulum bundle, itself responsible for posterior and anterior cingulate hypometabolism, and the uncinate fasciculus leading to metabolism decrease in the subgenual cortex (see Figure 8 for a summary diagram). Our findings further reinforce the relevance of the disconnection process as a pathophysiological mechanism underlying brain alteration progression in the course of Alzheimer’s disease. As we are entering the era of large multicentre multi-modal imaging longitudinal studies, our approach can be used to integrate other modalities such as amyloid deposition to the above causal model in order to further our understanding of the pathological mechanisms underpinning the cascade of events eventually leading to Alzheimer’s disease-related dementia.
Supplementary Material
Acknowledgments
We acknowledge the financial/scientific support of the Inserm, including Inserm-Liliane Bettencourt MD-PhD Program, PHRC (Ministère de la Santé), Région Basse-Normandie and Association France Alzheimer for this project. The authors are indebted to B. Grassiot regarding the material support essential to this study. We thank B. Dickerson and R. La Joie for their helpful comments regarding this study, C. Lalevée and A. Pélerin for help with neuropsychological assessments, B. Dupuy and D. Hannequin for their contribution to the recruitment of patients, G. Perchey, M.H. Noël, M.C. Onfroy, D. Luet, O. Tirel, and L. Barré for help with neuroimaging data acquisition, and the volunteers who participated in this study.
Abbreviations
- aMCI
amnestic Mild Cognitive Impairment
- 18FDG
Fluorodeoxyglucose
- PET
Positron Emission Tomography
- MRI
Magnetic Resonance Imaging
- ROI
Region of Interest
- TIV
Total Intracranial Volume
- VBM
Voxel-Based Morphometry
References
- Albasser MM, Poirier GL, Warburton EC, Aggleton JP. Hippocampal lesions halve immediate-early gene protein counts in retrosplenial cortex: distal dysfunctions in a spatial memory system. Eur J Neurosci. 2007;26:1254–1266. doi: 10.1111/j.1460-9568.2007.05753.x. [DOI] [PubMed] [Google Scholar]
- Allen G, Barnard H, McColl R, Hester AL, Fields JA, Weiner MF, et al. Reduced hippocampal functional connectivity in Alzheimer disease. Arch Neurol. 2007;64:1482–1487. doi: 10.1001/archneur.64.10.1482. [DOI] [PubMed] [Google Scholar]
- Alsop DC, Casement M, de Bazelaire C, Fong T, Press DZ. Hippocampal hyperperfusion in Alzheimer’s disease. Neuroimage. 2008;42:1267–1274. doi: 10.1016/j.neuroimage.2008.06.006. [DOI] [PMC free article] [PubMed] [Google Scholar]
- Ashburner J. A fast diffeomorphic image registration algorithm. Neuroimage. 2007;38:95–113. doi: 10.1016/j.neuroimage.2007.07.007. [DOI] [PubMed] [Google Scholar]
- Ashburner J, Friston KJ. Unified segmentation. Neuroimage. 2005;26:839–851. doi: 10.1016/j.neuroimage.2005.02.018. [DOI] [PubMed] [Google Scholar]
- Ashburner JT, Friston KJ. High-Dimensional Image Warping. In: Frackowiak RS, Friston KJ, Frith CD, Dolan RJ, Price CJ, Zeki S, Ashburner JT, Penny WD, editors. Human Brain Function. Amsterdam: Elsevier; 2004. pp. 673–694. [Google Scholar]
- Bai F, Zhang Z, Watson DR, Yu H, Shi Y, Yuan Y. Abnormal white matter independent of hippocampal atrophy in amnestic type mild cognitive impairment. Neurosci Lett. 2009a;462:147–151. doi: 10.1016/j.neulet.2009.07.009. [DOI] [PubMed] [Google Scholar]
- Bai F, Zhang Z, Watson DR, Yu H, Shi Y, Yuan Y, et al. Abnormal integrity of association fiber tracts in amnestic mild cognitive impairment. J Neurol Sci. 2009b;278:102–106. doi: 10.1016/j.jns.2008.12.009. [DOI] [PubMed] [Google Scholar]
- Balthazar ML, Yasuda CL, Pereira FR, Pedro T, Damasceno BP, Cendes F. Differences in grey and white matter atrophy in amnestic mild cognitive impairment and mild Alzheimer’s disease. Eur J Neurol. 2009;16:468–474. doi: 10.1111/j.1468-1331.2008.02408.x. [DOI] [PubMed] [Google Scholar]
- Barbas H, Blatt GJ. Topographically specific hippocampal projections target functionally distinct prefrontal areas in the rhesus monkey. Hippocampus. 1995;5:511–533. doi: 10.1002/hipo.450050604. [DOI] [PubMed] [Google Scholar]
- Bartzokis G. Alzheimer’s disease as homeostatic responses to age-related myelin breakdown. Neurobiol Aging. doi: 10.1016/j.neurobiolaging.2009.08.007. In Press. [DOI] [PMC free article] [PubMed] [Google Scholar]
- Buckner RL, Andrews-Hanna JR, Schacter DL. The brain’s default network: anatomy, function, and relevance to disease. Ann N Y Acad Sci. 2008;1124:1–38. doi: 10.1196/annals.1440.011. [DOI] [PubMed] [Google Scholar]
- Carmichael ST, Price JL. Limbic connections of the orbital and medial prefrontal cortex in macaque monkeys. J Comp Neurol. 1995;363:615–641. doi: 10.1002/cne.903630408. [DOI] [PubMed] [Google Scholar]
- Casanova R, Srikanth R, Baer A, Laurienti PJ, Burdette JH, Hayasaka S, et al. Biological parametric mapping: A statistical toolbox for multimodality brain image analysis. Neuroimage. 2007;34:137–143. doi: 10.1016/j.neuroimage.2006.09.011. [DOI] [PMC free article] [PubMed] [Google Scholar]
- Chételat G, Desgranges B, de la Sayette V, Viader F, Berkouk K, Landeau B, et al. Dissociating atrophy and hypometabolism impact on episodic memory in mild cognitive impairment. Brain. 2003a;126:1955–1967. doi: 10.1093/brain/awg196. [DOI] [PubMed] [Google Scholar]
- Chételat G, Desgranges B, de la Sayette V, Viader F, Eustache F, Baron JC. Mild cognitive impairment: Can FDG-PET predict who is to rapidly convert to Alzheimer’s disease? Neurology. 2003b;60:1374–1377. doi: 10.1212/01.wnl.0000055847.17752.e6. [DOI] [PubMed] [Google Scholar]
- Chételat G, Desgranges B, Landeau B, Mezenge F, Poline JB, de la Sayette V, et al. Direct voxel-based comparison between grey matter hypometabolism and atrophy in Alzheimer’s disease. Brain. 2008;131:60–71. doi: 10.1093/brain/awm288. [DOI] [PubMed] [Google Scholar]
- Chételat G, Landeau B, Eustache F, Mezenge F, Viader F, de la Sayette V, et al. Using voxel-based morphometry to map the structural changes associated with rapid conversion in MCI: a longitudinal MRI study. Neuroimage. 2005;27:934–946. doi: 10.1016/j.neuroimage.2005.05.015. [DOI] [PubMed] [Google Scholar]
- Chételat G, Villain N, Desgranges B, Eustache F, Baron JC. Posterior cingulate hypometabolism in Alzheimer’s disease: what is the contribution of local atrophy versus disconnection? Brain. 2009;132:e133. doi: 10.1093/brain/awp253. [DOI] [PMC free article] [PubMed] [Google Scholar]
- Chételat G, Villemagne VL, Bourgeat P, Pike KE, Jones G, Ames D, et al. Relationship between atrophy and beta-amyloid deposition in Alzheimer disease. Ann Neurol. 2010;67:317–324. doi: 10.1002/ana.21955. [DOI] [PubMed] [Google Scholar]
- Choo IH, Lee DY, Oh JS, Lee JS, Lee DS, Song IC, et al. Posterior cingulate cortex atrophy and regional cingulum disruption in mild cognitive impairment and Alzheimer’s disease. Neurobiol Aging. doi: 10.1016/j.neurobiolaging.2008.06.015. In Press. [DOI] [PubMed] [Google Scholar]
- Chua TC, Wen W, Chen X, Kochan N, Slavin MJ, Trollor JN, et al. Diffusion tensor imaging of the posterior cingulate is a useful biomarker of mild cognitive impairment. Am J Geriatr Psychiatry. 2009;17:602–613. doi: 10.1097/JGP.0b013e3181a76e0b. [DOI] [PubMed] [Google Scholar]
- Delatour B, Blanchard V, Pradier L, Duyckaerts C. Alzheimer pathology disorganizes cortico-cortical circuitry: direct evidence from a transgenic animal model. Neurobiol Dis. 2004;16:41–47. doi: 10.1016/j.nbd.2004.01.008. [DOI] [PubMed] [Google Scholar]
- Fellgiebel A, Wille P, Muller MJ, Winterer G, Scheurich A, Vucurevic G, et al. Ultrastructural hippocampal and white matter alterations in mild cognitive impairment: a diffusion tensor imaging study. Dement Geriatr Cogn Disord. 2004;18:101–108. doi: 10.1159/000077817. [DOI] [PubMed] [Google Scholar]
- Firbank MJ, Blamire AM, Krishnan MS, Teodorczuk A, English P, Gholkar A, et al. Atrophy is associated with posterior cingulate white matter disruption in dementia with Lewy bodies and Alzheimer’s disease. Neuroimage. 2007;36:1–7. doi: 10.1016/j.neuroimage.2007.02.027. [DOI] [PubMed] [Google Scholar]
- Fouquet M, Desgranges B, Landeau B, Duchesnay E, Mezenge F, de la Sayette V, et al. Longitudinal brain metabolic changes from amnestic mild cognitive impairment to Alzheimer’s disease. Brain. 2009;132:2058–2067. doi: 10.1093/brain/awp132. [DOI] [PMC free article] [PubMed] [Google Scholar]
- Garden DL, Massey PV, Caruana DA, Johnson B, Warburton EC, Aggleton JP, et al. Anterior thalamic lesions stop synaptic plasticity in retrosplenial cortex slices: expanding the pathology of diencephalic amnesia. Brain. 2009;132:1847–1857. doi: 10.1093/brain/awp090. [DOI] [PubMed] [Google Scholar]
- Garrido GE, Furuie SS, Buchpiguel CA, Bottino CM, Almeida OP, Cid CG, et al. Relation between medial temporal atrophy and functional brain activity during memory processing in Alzheimer’s disease: a combined MRI and SPECT study. J Neurol Neurosurg Psychiatry. 2002;73:508–516. doi: 10.1136/jnnp.73.5.508. [DOI] [PMC free article] [PubMed] [Google Scholar]
- Gouw AA, Seewann A, Vrenken H, van der Flier WM, Rozemuller JM, Barkhof F, et al. Heterogeneity of white matter hyperintensities in Alzheimer’s disease: post-mortem quantitative MRI and neuropathology. Brain. 2008;131:3286–3298. doi: 10.1093/brain/awn265. [DOI] [PubMed] [Google Scholar]
- Guedj E, Barbeau EJ, Didic M, Felician O, de Laforte C, Ranjeva JP, et al. Effects of medial temporal lobe degeneration on brain perfusion in amnestic MCI of AD type: deafferentation and functional compensation? Eur J Nucl Med Mol Imaging. 2009;36:1101–1112. doi: 10.1007/s00259-009-1060-x. [DOI] [PubMed] [Google Scholar]
- Huang J, Friedland RP, Auchus AP. Diffusion Tensor Imaging of Normal-Appearing White Matter in Mild Cognitive Impairment and Early Alzheimer Disease: Preliminary Evidence of Axonal Degeneration in the Temporal Lobe. AJNR Am J Neuroradiol. 2007;28:1943–1948. doi: 10.3174/ajnr.A0700. [DOI] [PMC free article] [PubMed] [Google Scholar]
- Jack CR, Jr, Weigand SD, Shiung MM, Przybelski SA, O’Brien PC, Gunter JL, et al. Atrophy rates accelerate in amnestic mild cognitive impairment. Neurology. 2008;70:1740–1752. doi: 10.1212/01.wnl.0000281688.77598.35. [DOI] [PMC free article] [PubMed] [Google Scholar]
- Jobst KA, Smith AD, Barker CS, Wear A, King EM, Smith A, et al. Association of atrophy of the medial temporal lobe with reduced blood flow in the posterior parietotemporal cortex in patients with a clinical and pathological diagnosis of Alzheimer’s disease. J Neurol Neurosurg Psychiatry. 1992;55:190–194. doi: 10.1136/jnnp.55.3.190. [DOI] [PMC free article] [PubMed] [Google Scholar]
- Kiuchi K, Morikawa M, Taoka T, Nagashima T, Yamauchi T, Makinodan M, et al. Abnormalities of the uncinate fasciculus and posterior cingulate fasciculus in mild cognitive impairment and early Alzheimer’s disease: a diffusion tensor tractography study. Brain Res. 2009;1287:184–191. doi: 10.1016/j.brainres.2009.06.052. [DOI] [PubMed] [Google Scholar]
- Kobayashi Y, Amaral DG. Macaque monkey retrosplenial cortex: II. Cortical afferents. J Comp Neurol. 2003;466:48–79. doi: 10.1002/cne.10883. [DOI] [PubMed] [Google Scholar]
- Kobayashi Y, Amaral DG. Macaque monkey retrosplenial cortex: III. Cortical efferents. J Comp Neurol. 2007;502:810–833. doi: 10.1002/cne.21346. [DOI] [PubMed] [Google Scholar]
- Kondo H, Saleem KS, Price JL. Differential connections of the perirhinal and parahippocampal cortex with the orbital and medial prefrontal networks in macaque monkeys. J Comp Neurol. 2005;493:479–509. doi: 10.1002/cne.20796. [DOI] [PubMed] [Google Scholar]
- Li S, Pu F, Shi F, Xie S, Wang Y, Jiang T. Regional white matter decreases in Alzheimer’s disease using optimized voxel-based morphometry. Acta Radiol. 2008;49:84–90. doi: 10.1080/02841850701627181. [DOI] [PubMed] [Google Scholar]
- Machado CJ, Snyder AZ, Cherry SR, Lavenex P, Amaral DG. Effects of neonatal amygdala or hippocampus lesions on resting brain metabolism in the macaque monkey: A microPET imaging study. Neuroimage. 2008;39:832–846. doi: 10.1016/j.neuroimage.2007.09.029. [DOI] [PMC free article] [PubMed] [Google Scholar]
- Matsuda H. Cerebral blood flow and metabolic abnormalities in Alzheimer’s disease. Ann Nucl Med. 2001;15:85–92. doi: 10.1007/BF02988596. [DOI] [PubMed] [Google Scholar]
- McKhann G, Drachman D, Folstein M, Katzman R, Price D, Stadlan EM. Clinical diagnosis of Alzheimer’s disease: report of the NINCDS-ADRDA Work Group under the auspices of Department of Health and Human Services Task Force on Alzheimer’s Disease. Neurology. 1984;34:939–944. doi: 10.1212/wnl.34.7.939. [DOI] [PubMed] [Google Scholar]
- Medina D, Toledo-Morrell L, Urresta F, Gabrieli JD, Moseley M, Fleischman D, et al. White matter changes in mild cognitive impairment and AD: A diffusion tensor imaging study. Neurobiol Aging. 2006;27:663–672. doi: 10.1016/j.neurobiolaging.2005.03.026. [DOI] [PubMed] [Google Scholar]
- Meguro K, Blaizot X, Kondoh Y, Le Mestric C, Baron JC, Chavoix C. Neocortical and hippocampal glucose hypometabolism following neurotoxic lesions of the entorhinal and perirhinal cortices in the non-human primate as shown by PET. Implications for Alzheimer’s disease. Brain. 1999;122 ( Pt 8):1519–1531. doi: 10.1093/brain/122.8.1519. [DOI] [PubMed] [Google Scholar]
- Mevel K, Desgranges B, Baron JC, Landeau B, de la Sayette V, Viader F, et al. Detecting hippocampal hypometabolism in Mild Cognitive Impairment using automatic voxel-based approaches. Neuroimage. 2007;37:18–25. doi: 10.1016/j.neuroimage.2007.04.048. [DOI] [PubMed] [Google Scholar]
- Mielke MM, Kozauer NA, Chan KC, George M, Toroney J, Zerrate M, et al. Regionally-specific diffusion tensor imaging in mild cognitive impairment and Alzheimer’s disease. Neuroimage. 2009;46:47–55. doi: 10.1016/j.neuroimage.2009.01.054. [DOI] [PMC free article] [PubMed] [Google Scholar]
- Mielke R, Schroder R, Fink GR, Kessler J, Herholz K, Heiss WD. Regional cerebral glucose metabolism and postmortem pathology in Alzheimer’s disease. Acta Neuropathol. 1996;91:174–179. doi: 10.1007/s004010050410. [DOI] [PubMed] [Google Scholar]
- Mitchell AJ, Shiri-Feshki M. Rate of progression of mild cognitive impairment to dementia-- meta-analysis of 41 robust inception cohort studies. Acta Psychiatr Scand. 2009;119:252–265. doi: 10.1111/j.1600-0447.2008.01326.x. [DOI] [PubMed] [Google Scholar]
- Morbelli S, Piccardo A, Villavecchia G, Dessi B, Brugnolo A, Piccini A, et al. Mapping brain morphological and functional conversion patterns in amnestic MCI: a voxel-based MRI and FDG-PET study. Eur J Nucl Med Mol Imaging. 2009 doi: 10.1007/s00259-009-1218-6. [DOI] [PubMed] [Google Scholar]
- Mori S, Wakana S, Nagae-Poetscher LM, van Zilj PCM. MRI Atlas of Human White Matter. Amsterdam: Elsevier; 2005. [Google Scholar]
- Morris R, Pandya DN, Petrides M. Fiber system linking the mid-dorsolateral frontal cortex with the retrosplenial/presubicular region in the rhesus monkey. J Comp Neurol. 1999;407:183–192. doi: 10.1002/(sici)1096-9861(19990503)407:2<183::aid-cne3>3.0.co;2-n. [DOI] [PubMed] [Google Scholar]
- Mosconi L, Pupi A, de Leon MJ. Brain glucose hypometabolism and oxidative stress in preclinical Alzheimer’s disease. Ann N Y Acad Sci. 2008;1147:180–195. doi: 10.1196/annals.1427.007. [DOI] [PMC free article] [PubMed] [Google Scholar]
- Mufson EJ, Pandya DN. Some observations on the course and composition of the cingulum bundle in the rhesus monkey. J Comp Neurol. 1984;225:31–43. doi: 10.1002/cne.902250105. [DOI] [PubMed] [Google Scholar]
- Muller-Gartner HW, Links JM, Prince JL, Bryan RN, McVeigh E, Leal JP, et al. Measurement of radiotracer concentration in brain gray matter using positron emission tomography: MRI-based correction for partial volume effects. J Cereb Blood Flow Metab. 1992;12:571–583. doi: 10.1038/jcbfm.1992.81. [DOI] [PubMed] [Google Scholar]
- Nestor PJ, Fryer TD, Ikeda M, Hodges JR. Retrosplenial cortex (BA 29/30) hypometabolism in mild cognitive impairment (prodromal Alzheimer’s disease) Eur J Neurosci. 2003;18:2663–2667. doi: 10.1046/j.1460-9568.2003.02999.x. [DOI] [PubMed] [Google Scholar]
- Petersen RC, Negash S. Mild cognitive impairment: an overview. CNS Spectr. 2008;13:45–53. doi: 10.1017/s1092852900016151. [DOI] [PubMed] [Google Scholar]
- Poirier GL, Shires KL, Sugden D, Amin E, Thomas KL, Carter DA, et al. Anterior thalamic lesions produce chronic and profuse transcriptional deregulation in retrosplenial cortex: a model of retrosplenial hypoactivity and covert pathology. Thalamus Relat Syst. 2008;4:59–77. doi: 10.1017/S1472928808000368. [DOI] [PMC free article] [PubMed] [Google Scholar]
- Poline JB, Worsley KJ, Holmes AP, Frackowiak RS, Friston KJ. Estimating smoothness in statistical parametric maps: variability of p values. J Comput Assist Tomogr. 1995;19:788–796. doi: 10.1097/00004728-199509000-00017. [DOI] [PubMed] [Google Scholar]
- Quarantelli M, Berkouk K, Prinster A, Landeau B, Svarer C, Balkay L, et al. Integrated software for the analysis of brain PET/SPECT studies with partial-volume-effect correction. J Nucl Med. 2004;45:192–201. [PubMed] [Google Scholar]
- Rémy F, Mirrashed F, Campbell B, Richter W. Verbal episodic memory impairment in Alzheimer’s disease: a combined structural and functional MRI study. Neuroimage. 2005;25:253–266. doi: 10.1016/j.neuroimage.2004.10.045. [DOI] [PubMed] [Google Scholar]
- Richardson MP, Friston KJ, Sisodiya SM, Koepp MJ, Ashburner J, Free SL, et al. Cortical grey matter and benzodiazepine receptors in malformations of cortical development. A voxel-based comparison of structural and functional imaging data. Brain. 1997;120 ( Pt 11):1961–1973. doi: 10.1093/brain/120.11.1961. [DOI] [PubMed] [Google Scholar]
- Risacher SL, Saykin AJ, West JD, Shen L, Firpi HA, McDonald BC. Baseline MRI predictors of conversion from MCI to probable AD in the ADNI cohort. Curr Alzheimer Res. 2009;6:347–361. doi: 10.2174/156720509788929273. [DOI] [PMC free article] [PubMed] [Google Scholar]
- Rousset OG, Ma Y, Evans AC. Correction for partial volume effects in PET: principle and validation. J Nucl Med. 1998;39:904–911. [PubMed] [Google Scholar]
- Saleem KS, Kondo H, Price JL. Complementary circuits connecting the orbital and medial prefrontal networks with the temporal, insular, and opercular cortex in the macaque monkey. J Comp Neurol. 2008;506:659–693. doi: 10.1002/cne.21577. [DOI] [PubMed] [Google Scholar]
- Schmahmann JD, Pandya DN. Fiber Pathways of the Brain. New York: Oxford University Press; 2006. [Google Scholar]
- Schuff N, Woerner N, Boreta L, Kornfield T, Shaw LM, Trojanowski JQ, et al. MRI of hippocampal volume loss in early Alzheimer’s disease in relation to ApoE genotype and biomarkers. Brain. 2009;132:1067–1077. doi: 10.1093/brain/awp007. [DOI] [PMC free article] [PubMed] [Google Scholar]
- Seeley WW, Crawford RK, Zhou J, Miller BL, Greicius MD. Neurodegenerative diseases target large-scale human brain networks. Neuron. 2009;62:42–52. doi: 10.1016/j.neuron.2009.03.024. [DOI] [PMC free article] [PubMed] [Google Scholar]
- Shibata H, Naito J. Organization of anterior cingulate and frontal cortical projections to the retrosplenial cortex in the rat. J Comp Neurol. 2008;506:30–45. doi: 10.1002/cne.21523. [DOI] [PubMed] [Google Scholar]
- Smith AD. Imaging the progression of Alzheimer pathology through the brain. Proc Natl Acad Sci U S A. 2002;99:4135–4137. doi: 10.1073/pnas.082107399. [DOI] [PMC free article] [PubMed] [Google Scholar]
- Sorg C, Riedl V, Muhlau M, Calhoun VD, Eichele T, Laer L, et al. Selective changes of resting-state networks in individuals at risk for Alzheimer’s disease. Proc Natl Acad Sci U S A. 2007;104:18760–18765. doi: 10.1073/pnas.0708803104. [DOI] [PMC free article] [PubMed] [Google Scholar]
- Steiger JH. Tests for Comparing Elements of a Correlation Matrix. Psychol Bull. 1980;87:245–251. [Google Scholar]
- Stoub TR, Toledo-Morrell L, Stebbins GT, Leurgans S, Bennett DA, Shah RC. Hippocampal disconnection contributes to memory dysfunction in individuals at risk for Alzheimer’s disease. Proc Natl Acad Sci U S A. 2006;103:10041–10045. doi: 10.1073/pnas.0603414103. [DOI] [PMC free article] [PubMed] [Google Scholar]
- Stricker NH, Schweinsburg BC, Delano-Wood L, Wierenga CE, Bangen KJ, Haaland KY, et al. Decreased white matter integrity in late-myelinating fiber pathways in Alzheimer’s disease supports retrogenesis. Neuroimage. 2009;45:10–16. doi: 10.1016/j.neuroimage.2008.11.027. [DOI] [PMC free article] [PubMed] [Google Scholar]
- Talairach J, Tournoux P. Co-Planar Stereotaxic Atlas of the Human Brain. New York: Thieme; 1988. [Google Scholar]
- Tzourio-Mazoyer N, Landeau B, Papathanassiou D, Crivello F, Etard O, Delcroix N, et al. Automated anatomical labeling of activations in SPM using a macroscopic anatomical parcellation of the MNI MRI single-subject brain. Neuroimage. 2002;15:273–289. doi: 10.1006/nimg.2001.0978. [DOI] [PubMed] [Google Scholar]
- Ukmar M, Makuc E, Onor ML, Garbin G, Trevisiol M, Cova MA. Evaluation of white matter damage in patients with Alzheimer’s disease and in patients with mild cognitive impairment by using diffusion tensor imaging. Radiol Med. 2008;113:915–922. doi: 10.1007/s11547-008-0286-1. [DOI] [PubMed] [Google Scholar]
- Van Laere KJ, Dierckx RA. Brain perfusion SPECT: age- and sex-related effects correlated with voxel-based morphometric findings in healthy adults. Radiology. 2001;221:810–817. doi: 10.1148/radiol.2213010295. [DOI] [PubMed] [Google Scholar]
- Villain N, Desgranges B, Viader F, de la Sayette V, Mezenge F, Landeau B, et al. Relationships between hippocampal atrophy, white matter disruption, and gray matter hypometabolism in Alzheimer’s disease. J Neurosci. 2008;28:6174–6181. doi: 10.1523/JNEUROSCI.1392-08.2008. [DOI] [PMC free article] [PubMed] [Google Scholar]
- Wang L, Goldstein FC, Veledar E, Levey AI, Lah JJ, Meltzer CC, et al. Alterations in cortical thickness and white matter integrity in mild cognitive impairment measured by whole-brain cortical thickness mapping and diffusion tensor imaging. AJNR Am J Neuroradiol. 2009;30:893–899. doi: 10.3174/ajnr.A1484. [DOI] [PMC free article] [PubMed] [Google Scholar]
- Wang L, Zang Y, He Y, Liang M, Zhang X, Tian L, et al. Changes in hippocampal connectivity in the early stages of Alzheimer’s disease: evidence from resting state fMRI. Neuroimage. 2006;31:496–504. doi: 10.1016/j.neuroimage.2005.12.033. [DOI] [PubMed] [Google Scholar]
- Whitwell JL, Przybelski SA, Weigand SD, Knopman DS, Boeve BF, Petersen RC, et al. 3D maps from multiple MRI illustrate changing atrophy patterns as subjects progress from mild cognitive impairment to Alzheimer’s disease. Brain. 2007;130:1777–1786. doi: 10.1093/brain/awm112. [DOI] [PMC free article] [PubMed] [Google Scholar]
- Zhang HY, Wang SJ, Xing J, Liu B, Ma ZL, Yang M, et al. Detection of PCC functional connectivity characteristics in resting-state fMRI in mild Alzheimer’s disease. Behav Brain Res. 2009;197:103–108. doi: 10.1016/j.bbr.2008.08.012. [DOI] [PubMed] [Google Scholar]
- Zhang Y, Schuff N, Jahng GH, Bayne W, Mori S, Schad L, et al. Diffusion tensor imaging of cingulum fibers in mild cognitive impairment and Alzheimer disease. Neurology. 2007;68:13–19. doi: 10.1212/01.wnl.0000250326.77323.01. [DOI] [PMC free article] [PubMed] [Google Scholar]
- Zhong YM, Yukie M, Rockland KS. Distinctive morphology of hippocampal CA1 terminations in orbital and medial frontal cortex in macaque monkeys. Exp Brain Res. 2006;169:549–553. doi: 10.1007/s00221-005-0187-7. [DOI] [PubMed] [Google Scholar]
Associated Data
This section collects any data citations, data availability statements, or supplementary materials included in this article.