Abstract
A new technique is introduced in the present study for in vivo measurement of arterial cerebral blood volume (CBV) by combining arterial spin labeling (ASL) with a segmented multi-phase balanced steady-state free precession (bSSFP) readout sequence. This technique takes advantage of the phenomenon that the longitudinal magnetization of flowing blood is not or only marginally disturbed (besides T1 relaxation) by the bSSFP ±α pulse train. When the blood water exchanges into tissue, it becomes quickly saturated by the bSSFP pulse train due to 0 velocity and reduced T1, T2 relaxation times. Therefore, labeled blood water behaves like an intravascular contrast agent in multi-phase bSSFP scans, and can be used to quantify arterial CBV in a similar way as dynamic susceptibility contrast MRI. Both Bloch equation simulation and in vivo experiments were carried out to demonstrate the feasibility for quantifying CBV in arteries, arterioles and capillaries using two variants of the proposed method. Functional MRI of visual cortex stimulation was further performed using multi-phase bSSFP based ASL and compared with vascular-space occupancy (VASO) contrast. The proposed multi-phase bSSFP based ASL technique may allow separation of CBV of different vascular compartments for fMRI studies and clinical evaluation of the cerebral vasculature.
Keywords: Arterial Spin Labeling (ASL), Cerebral Blood Volume (CBV), Steady-State Free Precession (SSFP), Arteriole, Capillary
Introduction
In vivo measurement of cerebral blood volume (CBV) is important in clinical applications such as stroke (1) and brain tumor (2), as well as in functional MRI (fMRI) studies to understand hemodynamic responses (3–5). Dynamic susceptibility contrast (DSC) MRI is the most widely used method for clinical studies. However, it requires intravenous injection of contrast agents. Vascular-space occupancy (VASO) (6) contrast provides estimate of relative CBV changes for fMRI, yet contrast agent is still required to quantify absolute CBV (7). Recently, inflow VASO (iVASO) techniques have been introduced for in vivo measurement of arterial CBV (aCBV) (8,9). However, iVASO methods rely on a set of assumptions of arterial transit times which still await verification. Probing CBV changes in different compartments is essential for understanding the source and mechanism of the blood oxygen level-dependent (BOLD) contrast, as it remains controversial regarding the contribution of arterial, capillary and venous volume changes during fMRI activation (5,10,11). In addition, different disease processes and stages may induce hallmark changes on specific vasculature. For instance, malignant neoplasm is generally associated with angiogenesis (12). In ischemic stroke, veins draining the brain region with occluded blood supply may collapse, causing difficulty for reperfusion even if the clot is dissolved or retrieved (1). In Alzheimer’s disease, a high prevalence of cerebral amyloid angiopathy (CAA) may specifically target arterioles and capillaries (13).
Arterial spin labeling (ASL) methods have been applied for estimation of arterial CBV due to its sensitivity to labeled blood in arteries, in a way similar to angiography (14,15). This is generally achieved through continuous image readout using Look-Locker echo-planar imaging (LL-EPI), often in conjunction with flow spoiling gradients. However, the signal-to-noise ratio (SNR) is not satisfactory with potential distortions of flow signals in EPI. In addition, it is questionable whether the measured aCBV includes arterioles or even finer microvasculature due to the limitation of the encoding velocity of flow spoiling gradients (on the order a few cm/s) and/or the saturation effect of the RF pulse train on slow-flowing spins by LL-EPI (14,15). On the other hand, the CBV of pial arteries, arterioles (and capillaries) may be most relevant for fMRI since it has been shown that microvessels smaller than 200μm are equipped with vascular smooth muscle cells and thus are able to constrict and dilate (16,17). Other ASL based techniques have been attempted to separate arterial and venous CBV (e.g. MOTIVE) in animal models (18), yet these methods may not be easily translated to human studies due to limitations in specific absorption rate (SAR) of RF power.
In the present study, a new technique is introduced by combining ASL with multi-phase balanced steady-state free precession (bSSFP) to quantify arterial CBV without contrast agent. Balanced SSFP offers high SNR and imaging efficiency and is ideal for flow imaging because of the high signal intensity from blood, which has an intrinsically high T2/T1 ratio. The technique is also inherently flow compensated, thereby minimizing sensitivity to flow artifacts. While initially designed for 4D dynamic MR angiography (dMRA) (19), both theoretical analysis and in vivo experiments were carried out in the present study to prove that this technique can be extended for quantifying CBV in small arteries, arterioles and even capillaries. In this work, two variants of the technique are proposed with specific weighting on the arterial and capillary end, respectively. Further, functional MRI of visual cortex stimulation was performed using multi-phase bSSFPbased ASL and compared with VASO contrast to demonstrate the feasibility for estimating CBV changes in different vascular compartments during fMRI activation.
Methods
Pulse Sequence
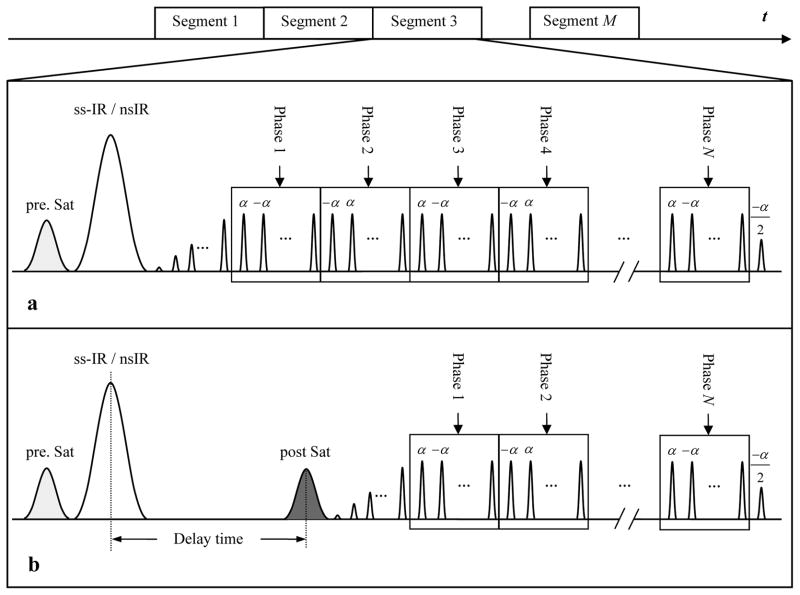
The pulse sequence was designed by combining ASL with a segmented multi-phase bSSFP readout sequence. The flow-sensitive alternating inversion recovery (FAIR) technique was implemented for spin tagging (20). As shown in the pulse sequence diagram (Fig. 1a), a slice-selective (ss) or non-selective (ns) hyperbolic secant (HS) inversion pulse was applied immediately following the pre-saturation pulse. Subsequently, a train of 20 dummy radiofrequency pulses with a linear ramp of flip angles (i.e., α/21, −2α/21, 3α/21, …, −20α/21) was applied to minimize transient signal oscillations. The signal was then continuously acquired by a segmented multi-phase bSSFP readout with alternating ±α pulses, resulting in a series of images obtained at multiple delay times (or TIs). Each measurement of the sequence was composed of a pair of ss-Inversion Recovery (ss-IR) and ns-IR acquisitions. Dynamic time courses of labeled blood signals were obtained by pairwise subtractions between the ss-IR and ns-IR acquisitions at each TI. Two pulse sequence schemes were implemented: 1) the FAIR method, in which the bSSFP images are acquired immediately after the HS inversion pulse, as shown in Fig. 1a; and 2) the QUIPSS II method (21), in which a delay time (τ) followed by a saturation pulse to spoil the label is inserted between inversion pulses and the bSSFP readout, as shown in Fig. 1b. A spatially confined ASL approach was employed in QUIPSS II to restrict the width of the tagging slab to 10cm (22). The saturation pulse was then applied at the identical location of the 10cm tagging slab after a delay τ. The FAIR method is expected to reveal the full dynamic course of the labeled blood flowing through arteries, arterioles and even capillaries. By skipping the arterial phases of the dynamic course of inflowing labeled blood, the QUIPSS II method is expected to accentuate flow signals in microvessels.
Figure 1.
Diagram of the pulse sequence that combines ASL and a segmented multi-phase bSSFP readout. A saturation pulse is applied in the image plane to suppress the image background before the inversion pulse. Two pulse sequence schemes are proposed: the FAIR method (a) in which the bSSFP readout immediately follows the inversionpulse; and the QUIPSS II method (b) in which a delay is inserted between the inversion pulse and bSSFP readout. A saturation pulse is applied inferior to the image plane to spoil the label at the delay time.
Figure 2.
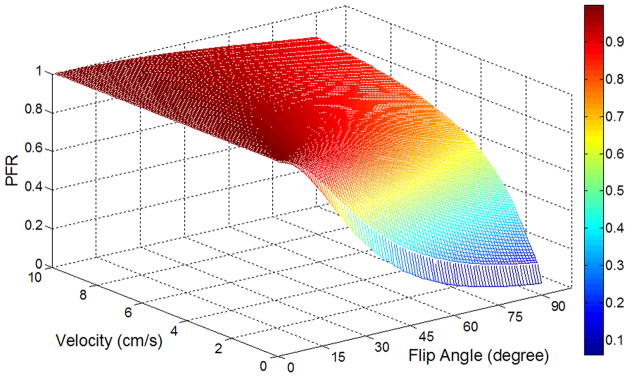
Bloch equation simulation of preserved flow ratio (PFR) of multi-phase bSSFP based ASL as a function of flow velocity and flip angle.
Theory and Simulations
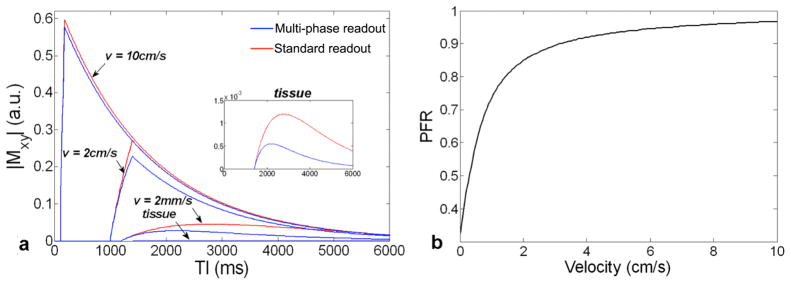
It has been well established that the steady state bSSFPsignal of static tissue is governed by the T2/T1 ratio of the tissue. The transient phase of bSSFP can be modeled by an exponential decay from the initial amplitude and the decay rate is a weighted average of the T1 and T2 relaxation times, where the weighting is determined by the flip angle of excitation pulses (23). Due to relatively prolonged T1 and T2 values as well as the continuous replenishment of flesh blood, the longitudinal magnetization of flowing blood is not or minimally disturbed (besides T1 relaxation) by the bSSFP±α pulse train (24). This phenomenon has been exploited for in vivo measurement of blood T1 and 4D dynamic MRA (19,24). In pseudo-continuous ASL (25,26), bSSFP serves as the control pulses since it does not significantly affect the longitudinal magnetization of flowing blood in arteries. Once the spins reach tissue, however, they become quickly saturated by the bSSFP pulse train due to 0 velocity and reduced T1, T2 relaxation times. Therefore, labeled blood behaves like an intravascular contrast agent in multi-phase bSSFPscans, and can be used to quantify arterial CBV (aCBV) in a way similar to DSC MRI. In this study, we define the preserved flow ratio (PFR) as the ratio between the area-under-the-curve of dynamic ASL signals acquired using multi-phase and standard (single-phase) bSSFPreadout (see Fig. 3a), and investigate PFR as a function of flip angle (FA) and flow velocity (v) using Bloch equation simulation. It is important to note that the dependence of PFR on flow velocity is determined by the number of RF pulses experienced by a spin, which also depends on slice thickness.
Figure 3.
Simulated dynamic time courses of standard (single-phase) (red) and multi-phase (blue) bSSFP based ASL of arterial and tissue compartments with different flow velocities (a); The PFR is calculated as the ratio of the area-under-the-curve between the multi-phase (blue) and standard (red) time courses. The PFR as a function of flow velocity at a flip angle of 40° is shown in (b).
Simulation was conducted for labeled blood in the vascular and tissue compartment, respectively. For the sake of simplicity, blood vessels were assumed to align perpendicular to the imaging slice for the vascular compartment simulation (effects of tortuous vasculature are discussed below). According to the through-plane flow velocity of v, an imaging slice of thickness d was first divided into sub-slices with number of d/(vTR), which is also the number of α pulses experienced by the flowing spins. The spin replacement occurs in a first-in-first-out order, i.e., during each TR, the spins in the downstream end sub-slice flow out and the remaining spins in the slice are shifted by a sub-slice. At the same time, the inflowing spins enter the imaging slice with magnetization Min(t) according to
| [1] |
where t is the delay time after the labeling pulse, Mb,0 is the thermal equilibrium blood magnetization, Min,0 is the magnetization of inflowing blood spins at time t = 0. For the FAIR labeling scheme, Min,0 is given by:
| [2] |
where δ is the arterial transit time for the labeled blood to reach the imaging slice and w is the bolus duration. The blood magnetization Mb(t) for both the control and tag acquisitions was calculated as the magnetization vector sum over all sub-slices.
For the tissue compartment, the tissue magnetization Mtissue(t) was simulated according to:
| [3] |
where Mtissue,0 is the thermal equilibrium tissue magnetization, T1app is the apparent longitudinal relaxation time defined as 1/T1app= 1/T1,tissue + f/λ, f is the perfusion rate and λ is the tissue to blood partition coefficient, Mb,in(t) represents the blood magnetization leaving the arterial compartment and exchanging with the tissue which was calculated in the simulation of the vascular compartment signal. For both vascular and tissue compartment simulation, the dynamic ASL signals were obtained by the magnitude of the transverse magnetization of the complex difference between the control and tagging acquisitions. For simplicity, potentially imperfect slice profiles and out-of-slice contributions during bSSFP scans were ignored (27) and all spins were assumed to be on resonance.
The dynamic vascular and tissue ASL signals for both multi-phase and standard bSSFP readout were simulated using the model described above. For the vascular compartment, the magnetization evolution was computed with the flow velocity v ranging from 0.2 to 10 cm/s with a step size of 0.5 mm/s and the flip angle (FA) ranging from 1 to 90° insteps of 1°. The arterial transit time δ was assumed to vary from 100 to 1200ms which is inversely proportional to the corresponding flow velocity (28). An infinite bolus duration w was assumed for FAIR. For the tissue compartment, blood spins were assumed to remain in capillaries (v = 2mm/s) for an additional delay da of 200 ms before exchanging into tissue (29). The physiological and imaging parameters used in the simulation were as follows (30): T1,blood = 1600 ms, T2,blood = 120 ms, T1,tissue = 1200 ms, T2,tissue = 80 ms, f = 60 ml/100g/min, λ = 0.9g/ml, TR = 3.4 ms, TE = TR/2, slice thickness d = 8 mm and TI = 0 to 6000 ms. All simulations were implemented in MATLAB (Mathworks, Natick, MA, USA) using in-house programs.
Arterial CBV quantification
Based on the standard tracer kinetic model employed in DSC MRI (31), aCBV was calculated by:
| [4] |
where T1,blood is the T1 of blood (1.6s), C(t) is the dynamic time course of the subtracted labeled blood signal of each pixel. The arterial input function Ca(t) was determined by the dynamic time course of the subtracted labeled blood signal in the arterial region-of-interest (ROI). In the QUIPSS II method, Ca(t) (after correction for T1 relaxation) was assumed to be a rectangular function with an amplitude of 2βMb,0 and a duration of the label bolus τ. Arterial CBV was calculated as:
| [5] |
where β is the labeling efficiency (0.95). Note aCBV measured by FAIR includes small arteries, arterioles and capillaries, whereas aCBV measured by QUIPSS II primarily consists of arterioles and capillaries, i.e., microvascular CBV on the arterial end.
Experiments
All experiments were performed on a Siemens 3T TIM Trio MR system (Erlangen, Germany), using the product 12 channel head coil. A total of 14 healthy volunteers (ages 26 ± 4 years, 6 males) participated in this study after they provided written informed consent, according to a protocol approved by the Institutional Review Board. Imaging parameters of bSSFP scans were: FOV=220×165mm2, matrix=96×72, FA=40°, TR=3.4ms, TE=TR/2, Bandwidth= 814Hz/pixel. An oblique slice of 8mm thickness covering the primary visual cortex was imaged. For the FAIR method, bSSFP readout was carried out using 27 phases between the TI of 150 to 2542ms with a step size of 92ms. Each measurement consisted of 27 segments with an interval of 3s between inversion pulses. Eight measurements (8 pairs of ss-IR and ns-IR acquisitions) were performed with a total scan time of 3min. For comparison, 4 standard (single-phase) bSSFP based ASL scans were performed at TIs of 655/1155/1655/2155ms respectively. For QUIPSS II, to suppress the arterial signals, a delay (τ) of 700ms followed by a saturation pulse was inserted between inversion pulses and bSSFP readout. Twenty-three phases between the TI of 845 to 2544ms with a step size of 72ms were acquired.
Nine of the 14 subjects also participated in the fMRI study. Both FAIR and QUIPSS II scans were performed using a block-design visual stimulation paradigm with flashing checkerboard as the stimulation. Eighteen measurements were performed with 3 cycles of alternating resting and visual stimulation conditions (3 measurements each condition). For comparison, fMRI scans using the VASO contrast were performed on 4 of the 9 subjects, using a 1 min OFF/ON visual stimulation paradigm. A single slice with the same position of the bSSFP based ASL scans was acquired using gradient-echo EPI following a nonselective inversion pulse. Imaging parameters were: FOV=220×220mm2, matrix=96×96, TR=3s, TI=895ms, 120 images with a scan time of 6min.
Data Analysis
Dynamic images of labeled blood (ΔM) were obtained by pairwise subtraction between the ss-IR and ns-IR bSSFP acquisitions at each TI. Arterial ROIs were defined by thresholding the subtracted images, and tissue ROIs were defined manually by excluding visible arteries in gray and white matter, respectively. The mean time courses of labeled blood signals were extracted from the arterial and tissue ROIs. For aCBV quantification, the subtracted dynamic signals of labeled blood, C(t), were measured in each pixel. For FAIR, the arterial input function, Ca(t), was derived from an arterial ROI, which was defined by two pixels with the highest signal intensity in the anterior cerebral artery. To minimize partial volume effects, the arterial input function (AIF) was scaled by the ratio of the peak intensity of one pixel in the superior sagittal sinus and the peak intensity of AIF (after correction for T1 relaxation). Arterial CBV was calculated according to Eqs. [4] and [5] pixel by pixel for the FAIR and QUIPSS II method respectively. For QUIPSS II, the AIF was assumed to be a rectangular function with an amplitude of 2βMb,0 and a duration of 700ms, where Mb,0 was estimated from a blood-filled voxel in the sagittal sinus to avoid partial volume effects.
For the fMRI study, the area-under-the-curve of the T1 corrected ΔM time course (i.e., relative arterial CBV) was calculated for each measurement of bSSFP based ASL scans, resulting in 18 measurements of relative aCBV for each fMRI scan. Apaired t-test was then applied to the 18 relative aCBV measurements to detect significant activation to visual stimulation using an arbitrary threshold of uncorrected p<0.05 for multi-phase bSSFP based ASL scans. The VASO fMRI data were analyzed using the general linear model in SPM5 (University College London, UK). Spatial smoothing (full width at half maximum of 8 mm) was applied in preprocessing. An arbitrary threshold of uncorrected p<0.05 was used to detect significant activation. The common ROIs of FAIR, QUIPSS II (and VASO fMRI) scans were used to derive mean signal changes. Statistical analyses were performed using the SPSS 19.0 software package (SPSS, Inc., Chicago, IL, USA). A t-test was performed to test the difference of the peak latency of the dynamic time course of bSSFP ASL signals, as well as to test the difference of mean CBV changes between FAIR, QUIPSS II and VASO fMRI scans.
Results
Theory and Simulations
Figure 2 shows the simulated preserved flow ratio (PFR) as a function of flow velocity (v) and flip angle (FA) for multi-phase bSSFP based ASL scans. The PFR is generally above 90% for flowing blood with v>6cm/s (across the FA range of 1 to 90°), such as those in arteries. As blood flows into arterioles and capillaries, the PFR decreases with larger FA and slower v. Once the blood exchanges into tissue, the PFR further decreases due to 0 velocity and reduced T1, T2 relaxation times. In the present study, anFAof 40° was chosen as the optimal tradeoff between SNR and RF power deposition in experiments (in our pilot study, FA > 45° exceeded SAR limit and FA < 30° yielded unsatisfactory SNR). The saturation effect of multi-phase bSSFP read out on ASL signals can clearly be seen in Fig. 3a of simulated dynamic time courses of standard and multi-phase bSSFP based ASL signals as well as in Fig. 3b of the simulated PFR as a function of v at the FA of 40°. The PFR remains above 85% for v>2cm/s, approximately 50% for v=2mm/s and drops to 35% for v=0. If we define the flow velocity with 50% PFR as the cutoff of aCBV measurement (v=2mm/s corresponding to capillary flow), FA = 40° provides the optimal balance between suppressing tissue while preserving vascular signals.
Experimental Validation and Optimization
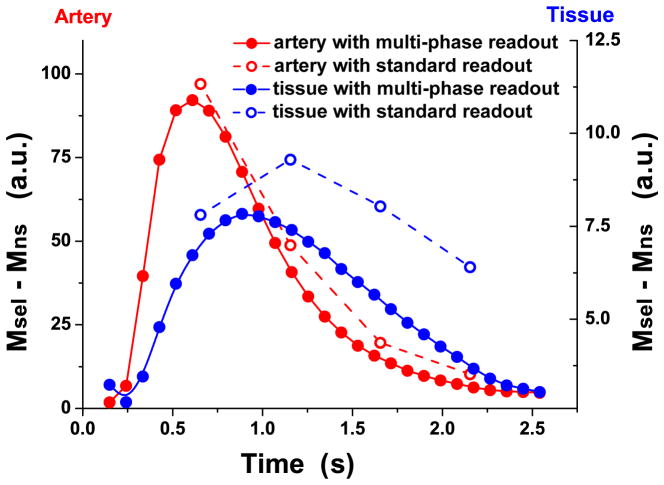
Figure 4 shows the experimental data of mean dynamic time courses of standard and multi-phase bSSFP based ASL signals in the arterial and tissue ROIs. Compared to the benchmark of standard bSSFP ASL measurements, the arterial time courses obtained by multi-phase bSSFP based ASL scans were virtually identical, suggesting little saturation effects. The measured dynamic time courses of labeled blood signals in tissue, however, suffered greater saturation effects at longer TI with multi-phase bSSFP based ASL scans compared to standard scans (multi-phase vs. standard scan ratio of 84.0±9.5%, 70.2±8.8%, 50.9±12.8%, 26.7±7.4% at the TI of 655, 1155, 1655, 2155ms in the tissue ROIs). The experimental results shown in Fig. 4 are in good agreement with the simulation results of Figs. 2&3, suggesting greater saturation effects of multi-phase bSSFP based ASL signals when labeled blood flows through arteries and arterioles into capillaries and tissue. In other words, multi-phase bSSFP based ASL signals mainly arise from flowing blood in arteries, arterioles and even capillaries with preserved longitudinal magnetization.
Figure 4.
Comparison of subtracted blood flow signals between multi-phase & standard bSSFP based ASL
Arterial CBV at Baseline
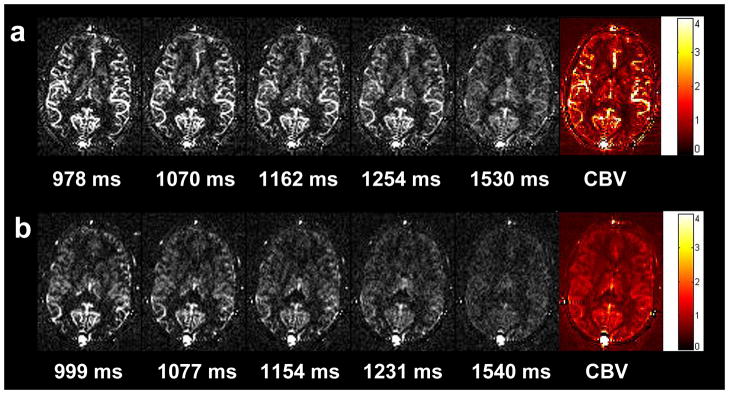
Figures 5a and bexhibit multi-phase bSSFP based ASL images acquired at 5 representative TIs as well as the calculated quantitative aCBV maps using the FAIR and QUIPSS II approaches, respectively. The multi-phase bSSFP based ASL images clearly demonstrate the dynamic course of the labeled blood flowing through arteries into the microvasculature. Both aCBV maps are of high quality due to the integral of serial bSSFP images acquired at multiple TIs. There is clear contrast in the aCBV maps between arteries, gray and white matter. The calculated mean aCBV in the arteries, gray matter and white matter of the 11 subjects were 10.07±2.26% (mean±SD), 2.05±0.44%, and 0.55±0.25% for the FAIR method, 1.73±0.49%, 1.14±0.22%, and 0.46±0.22% for the QUIPSS II method (see Table 1). As expected, the mean aCBV of the arteries was significantly lower (p<0.001) in QUIPSS II (1.73±0.49%) than those of FAIR (10.07±2.26%) scans, suggesting effective suppression of arterial signals using the QUIPSS II scheme. The mean aCBV in the gray matter was lower in QUIPSS II (1.14±0.22%) than in FAIR (2.05±0.44%) (p<0.001), while there was no significant difference of aCBV in white matter between the two methods.
Figure 5.
Multi-phase bSSFP based ASL images at 5 representative TIs, and calculated quantitative aCBV maps using the FAIR (a) and QUIPSS II (b) method respectively
Table 1.
Baseline absolute aCBV in arterial, gray matter and white matter ROIs in each subject.
| Subject No. | FAIR aCBV (%)
|
QUIPSS II aCBV (%)
|
||||
|---|---|---|---|---|---|---|
| Artery | Gray matter | White matter | Artery | Gray matter | White matter | |
| 1 | 8.99 | 2.23 | 0.80 | 1.17 | 0.89 | 0.42 |
| 2 | 6.35 | 1.09 | 0.21 | 1.61 | 0.94 | 0.28 |
| 3 | 9.90 | 2.26 | 0.64 | 1.70 | 1.05 | 0.41 |
| 4 | 10.87 | 2.63 | 0.39 | 1.70 | 1.23 | 0.26 |
| 5 | 11.53 | 2.17 | 0.39 | 2.69 | 1.60 | 0.44 |
| 6 | 13.13 | 2.07 | 0.72 | 1.84 | 1.15 | 0.66 |
| 7 | 8.84 | 2.11 | 1.11 | 1.50 | 1.21 | 1.02 |
| 8 | 11.83 | 2.23 | 0.62 | 2.29 | 1.30 | 0.54 |
| 9 | 7.25 | 1.49 | 0.45 | 1.34 | 1.08 | 0.43 |
| 10 | 13.18 | 2.46 | 0.34 | 2.12 | 1.26 | 0.28 |
| 11 | 8.84 | 1.80 | 0.43 | 1.02 | 0.81 | 0.30 |
| Mean (±SD) | 10.07±2.26 | 2.05±0.44 | 0.55±0.25 | 1.73±0.49 | 1.14±0.22 | 0.46±0.22 |
Arterial CBV Changes during fMRI
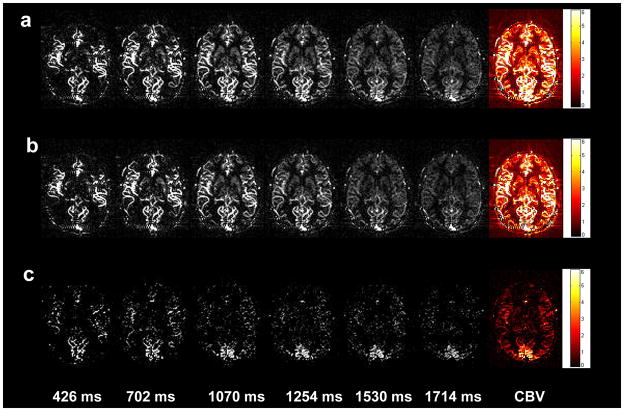
Robust visual cortex activation was observed by both the FAIR and QUIPSS II methods in all 9 subjects. The dynamic bSSFP based ASL images acquired at rest and during visual simulation as well as the associated subtracted images are shown in Figures 6a, b and c, respectively. The calculated aCBV maps are shown in the last column of Fig. 6. For the FAIR and QUIPSS II method, the mean aCBV was 1.85±0.62% and 3.11±1.24%, 1.13±0.29% and 1.69±0.40% at rest and during visual stimulation, respectively (see Table 2). The mean aCBV increase was 67.2±17.5% and 49.7±8.8% for FAIR and QUIPSS II respectively. Robust visual cortex deactivation with a mean fractional signal change of −2.00±0.40% was observed during VASO fMRI scans in the 4 subjects. The VASO method is thought to reflect total CBV changes during fMRI activation. Assuming the total CBV at baseline is approximately 5% (32), the VASO signal changes can be translated into an increase in CBV of 42.9±8.6%, which is significantly smaller than the observed aCBV changes using FAIR in 9 participants (p=0.0034, unpaired t-test, 1-tailed). However, the VASO CBV change was not significantly different from the aCBV change using QUIPSS II (p=0.12). Figures 7a and b show the meantime courses of multi-phase bSSFP based ASL signals from the activated ROI during both rest and visual stimulation from a representative subject using FAIR and QUIPSS II, respectively. A shortened (paired t-test, p=0.031, 1-tailed) peak latency was observed during activation (1.24±0.15s) in the FAIR data, compared to the resting state (1.35±0.24s).
Figure 6.
Multi-phase bSSFP based ASL images during visual stimulation (a) and resting state (b) at 5 representative TIs, as well as the subtracted images between visual stimulation and resting states (c); quantitative aCBV maps are shown in the right column.
Table 2.
Absolute aCBV and relative CBV changes during resting and activation in each individual subjects, relative CBV changes of VASO scans were estimated by assuming a total CBV of 5% at baseline.
| Subject No. | FAIR aCBV (%)
|
QUIPSS II aCBV (%)
|
VASO
|
||||
|---|---|---|---|---|---|---|---|
| rest | active | rel.aCBV changes(%) | rest | active | rel.aCBV changes(%) | rel.CBV changes(%) | |
| 1 | 3.30 | 6.21 | 88.0 | 1.57 | 2.12 | 35.7 | --- |
| 2 | 1.90 | 2.92 | 53.2 | 1.23 | 1.74 | 41.2 | --- |
| 3 | 1.05 | 1.95 | 86.1 | 0.87 | 1.44 | 66.2 | --- |
| 4 | 1.56 | 2.86 | 83.7 | 1.48 | 2.27 | 53.8 | --- |
| 5 | 1.44 | 2.23 | 54.7 | 0.88 | 1.28 | 45.9 | --- |
| 6 | 1.79 | 3.25 | 81.8 | 1.39 | 2.18 | 56.5 | 32.0 |
| 7 | 2.01 | 3.27 | 62.9 | 0.90 | 1.33 | 47.4 | 40.7 |
| 8 | 1.84 | 2.75 | 49.4 | 0.96 | 1.45 | 51.4 | 52.1 |
| 9 | 1.76 | 2.55 | 45.0 | 0.91 | 1.35 | 49.3 | 46.8 |
| Mean (±SD) | 1.85±0.62 | 3.11±1.24 | 67.2±17.5 | 1.13±0.29 | 1.69±0.40 | 49.7±8.8 | 42.9±8.6 |
Figure 7.
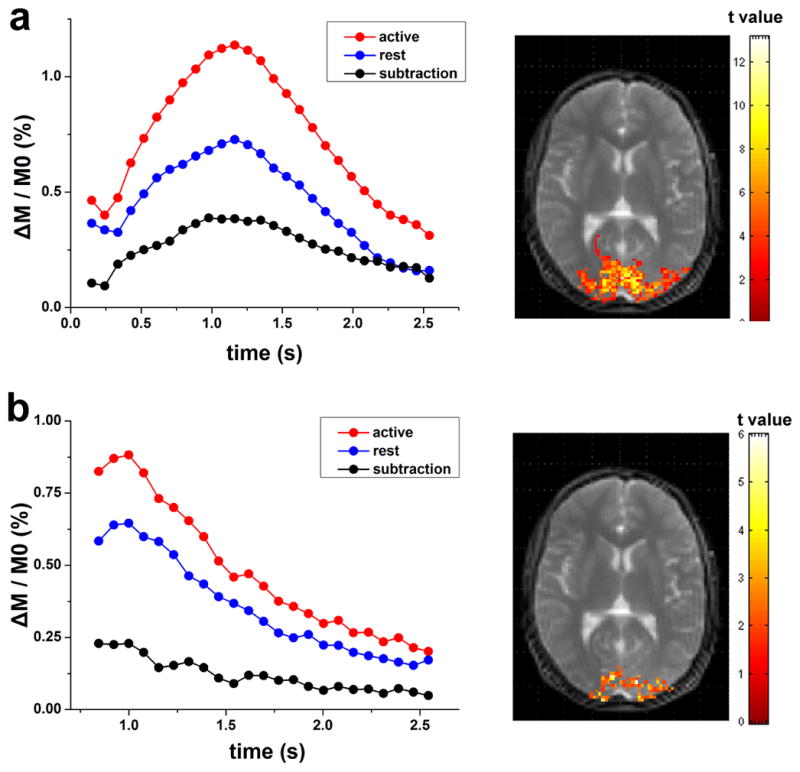
Average dynamic time courses of multi-phase bSSFP based ASL signals in the visual ROI from a representative subject using the FAIR (a) and QUIPSS II (b) method; activation maps are shown on the right side.
Discussion
In the present study, we introduced a new technique for noninvasive estimation of arterial CBV by combining ASL with a segmented multi-phase bSSFP sequence. The estimated mean aCBV values in arteries, gray and white matter, are in good agreement with those reported in the literature (Petersen et al reported aCBV of 0.93±0.06% and 0.33±0.02% in gray and white matter; Brookes et al reported aCBV of 9.3% and 2.8% in the arteries and gray matter; for gray matter Hua et al found aCBV of 2.04±0.27 ml blood/100ml tissue; Donahue et al 1.6±0.1%) (8,9,14,15). As a balanced SSFP technique, bSSFP possesses several advantages for blood flow imaging such as high imaging efficiency, flow-compensated gradients and the intrinsically high T2/T1 ratio of (arterial) blood. Due to relatively prolonged T1 and T2 values as well as the continuous replenishment of flesh blood, the longitudinal magnetization of flowing blood is minimally disturbed by the ±α bSSFP pulse train (24). Our theoretical calculations indicate <10% saturation effect for flowing blood with v>6cm/s. Using phantom data, we have validated that the T1 of flowing fluids is not significantly affected by bSSFP scans as long as v ≥6cm/s (24). The present study extends such findings and further demonstrates that multi-phase bSSFP based ASL is capable of imaging dynamic flow signals in microvessels and even capillaries. If we define the flow velocity with 50% PFR as the cutoff of aCBV measurement (v=2mm/s for FA of 40°), the measured aCBV should include arteries, arterioles and part of capillaries since v=2mm/s is in the range of blood flow velocity in capillaries (33). In this sense, multi-phase bSSFP based ASL provides aCBV analogous to LL-EPI based aCBV measurement with strong flow spoiling gradients (Venc=2mm/s). However, such strong gradients may entail a significant SNR penalty and cause image distortions in LL-EPI based ASL. As demonstrated in our previous study, multi-phase bSSFP has obvious advantages in terms of SNR, image distortions and susceptibility artifacts over LL-EPI for dynamic ASL-based flow imaging (19).
Two multi-phase bSSFP based ASL methods for measuring aCBV have been proposed in the present study. The FAIR method was found to be able to visualize the full time course of labeled blood, allowing estimation of aCBV based on the standard tracer kinetic model. However, the calculated aCBV contains both arteries and microvessels, as can clearly be seen in Fig. 5a. To suppress the arterial compartment of CBV, QUIPSS II was implemented by inserting a delay (700ms) followed by a saturation pulse to spoil the label between labeling pulses and the bSSFP readout. A delay of 700ms was adopted from past pulsed ASL studies to explicitly define the duration of the labeling bolus (21). As shown in Fig. 5b, the arterial signal has been largely suppressed in the calculated aCBV maps. One caveat of the QUIPSS II method, however, is the assumption that the initial phases of dynamic signals of labeled blood (before the delay of 700ms) primarily arise from arteries and therefore are skipped during acquisition. Due to the spatial heterogeneity of the arterial transit time, this assumption may cause under- or overestimation of aCBV of microvessels. As shown in the first panel of Figure 5b, arteries can still be seen at TI of 999ms in the posterior brain regions while arterial signals are largely suppressed in the reminder of the brain. Based on our simulation, the possible error of aCBV was within 17% assuming that the arterial transit time varies within the range of 700±500ms. Nevertheless, the measured mean aCBV values in gray and white matter using QUIPSS II match those reported in the literature well (14). An alternative approach to spoil arterial signals is to implement flow-spoiling gradients during multi-phase bSSFP readout, which, however, remains technically challenging. As proposed by Scheffler et al. (34), this may be realized by periodically restoring the magnetization along the Z-axis using an α/2 pulse and performing some manipulation (e.g. applying flow spoiling gradients) and then continuing bSSFP readout using another α/2 pulse.
Another interesting application of the proposed techniques is functional MRI. The observed mean aCBV changes during visual stimulation were 67.2±17.5% and 49.7±8.8% for FAIR and QUIPSS II respectively, with the former significantly greater than the latter (paired t-test, p=0.0082, 1-tailed). This result further supports that multi-phase bSSFP based ASL measurement of aCBV includes pial arteries, arterioles and a portion of capillaries since microvessels are able to constrict and dilate with equipped vascular smooth muscle cells (16,17). There is also evidence supporting the role of endothelial cells in the autoregulation of CBF (35). Previous fMRI studies using LL-EPI have either failed to detect aCBV changes (36) or reported a smaller degree of aCBV increase during sensorimotor stimulation (15), suggesting these LL-EPI based aCBV measurements may not have adequate sensitivity to detect microvascular blood volume changes. Functional MRI based on the VASO contrast is thought to reflect the total CBV change of arterioles, capillaries and venules. Assuming a total CBV of 5% at baseline (32), a mean CBV change of 42.9±8.6% was obtained using the VASO contrast in the present study (Table 2). Because the proposed multi-phase bSSFP based ASL method provides both absolute aCBV and relative aCBV change in response to fMRI activation, it is possible to estimate the CBV change in each compartment of the vasculature. Given the FAIR measurement of aCBV at baseline and during activation (1.85±0.62% and 3.11±1.24%), a total CBV (tCBV) of 5% at baseline and a mean total CBV change of 42.9±8.6% during activation, the estimated venous CBV (vCBV) change is approximately 28% according to:
| [6] |
This finding is in good agreement with previous animal studies by Kim et al (5) and Lee et al (37), in which they indicated that the increased total CBV changes during neural activation originate mainly from arterial rather than venous CBV. In the present study, aCBV changes detected by QUIPSS II were smaller than those by FAIR, but were not significantly different from the estimated total CBV changes using VASO fMRI, providing evidence that both QUIPSS II and VASO fMRI emphasize CBV of microvessels and capillaries. Overall, our observations suggest that arterial CBV expansion plays a dominant role in the hemodynamic responses to brain activation, while the degree of CBV expansion decreases from arterioles, capillaries to venules. This is a hypothesis to be tested in follow-up studies.
Since the purpose of the present study was to demonstrate the feasibility of in vivo estimate of aCBV, a detailed quantitative analysis of the fractional changes of CBV in each vascular compartment is beyond the scope of this work. Nevertheless, the potential for separating arterial, capillary and venous CBV changes during fMRI may have profound implications. For instance, venous CBV change is an important parameter in the quantitative model of BOLD contrast. The majority of existing studies assume that vCBV changes follow CBF changes by Grubb’s equation (4,38), partly due to the lack of approaches for in vivo estimation of vCBV. Although the VASO contrast can be applied for estimation of relative CBV change during fMRI, recent evidence suggests that its accuracy may be confounded by cerebrospinal fluid volume changes and the lack of information on baseline CBV (30). The separation of arterial and venous CBV may also have value in clinical applications. In ischemic stroke, aCBV in the vicinity of occluded brain regions may expand to form collateral blood supply, which may be an indicator of positive outcome. In contrast, the collapse of veins draining the occluded brain region may prohibit or impair reperfusion, which may be a negative sign of patient outcome (1).
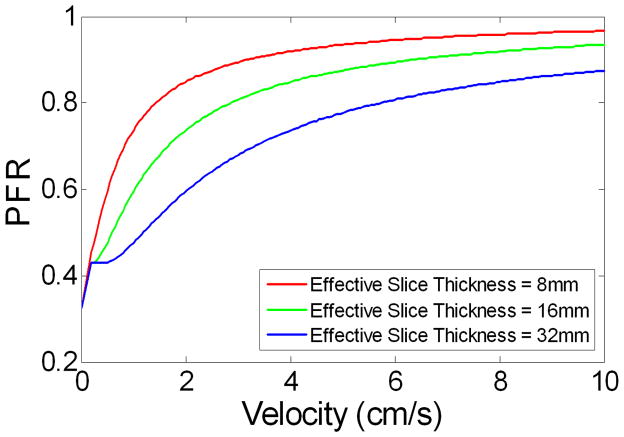
There are several limitations of this work. Both our theoretical analysis and experimental study were based on a 2D single slice with a simplified model of vasculature. To simulate the saturation effects on flowing spins in tortuous vasculature and/or in-plane vessels, we repeated Bloch equation simulation with 3 different effective slice thicknesses (8, 16 and 32mm respectively). As shown in Fig. 8, for flowing spins with velocities greater than 0.5cm/s, the saturation effects increased with slice thickness (i.e., prolonged time for spins to traverse the slice). However, for spins in capillaries (0.2cm/s) and tissue, the saturation effects remain the same regardless of slice thickness. This simulation result may provide insights for further extension of the multi-phase bSSFP based ASL method from 2D to 3D. Another potential confounding factor of the proposed method is the residual tissue contribution to the estimated aCBV value. Nevertheless, our simulation based on the single-pass approximation model suggests that the tissue contribution to multi-phase bSSFP ASL signal is within 10% (39). This small tissue contribution may be attributed to the relatively short tagging bolus in pulsed ASL and limited water exchange across the blood-brain barrier, in addition to the saturation effect of bSSFP pulse train. Lastly, it took 3min to scan a single slice using the existing technique, leading to relatively long scan time to cover multiple slices. In future work, parallel imaging and radial acquisition should have potential to improve the imaging efficiency for volumetric measurement of aCBV (40).
Figure 8.
Simulation results showing the PFR as a function of flow velocity at the flip angle of 40° with 3 different effective slice thicknesses.
Conclusion
The proposed multi-phase bSSFP based ASL method has promise for noninvasively measuring arterial CBV. This technique may allow separation of CBV of different vascular compartments for fMRI studies and clinical evaluation of the cerebral vasculature.
Acknowledgments
This work was supported by NIH grants MH080892, AG016570-11A, and ARRA grant MH080892-S1. The authors are grateful to Dr. Tae Kim for his valuable comments and Dr. Keith St Lawrence for his help with simulation.
References
- 1.Liebeskind DS. Imaging the future of stroke: I. Ischemia. Ann Neurol. 2009;66(5):574–590. doi: 10.1002/ana.21787. [DOI] [PubMed] [Google Scholar]
- 2.Law M, Yang S, Babb JS, Knopp EA, Golfinos JG, Zagzag D, Johnson G. Comparison of cerebral blood volume and vascular permeability from dynamic susceptibility contrast-enhanced perfusion MR imaging with glioma grade. AJNR Am J Neuroradiol. 2004;25(5):746–755. [PMC free article] [PubMed] [Google Scholar]
- 3.Donahue MJ, Blicher JU, Ostergaard L, Feinberg DA, MacIntosh BJ, Miller KL, Gunther M, Jezzard P. Cerebral blood flow, blood volume, and oxygen metabolism dynamics in human visual and motor cortex as measured by whole-brain multi-modal magnetic resonance imaging. J Cereb Blood Flow Metab. 2009;29(11):1856–1866. doi: 10.1038/jcbfm.2009.107. [DOI] [PubMed] [Google Scholar]
- 4.Davis TL, Kwong KK, Weisskoff RM, Rosen BR. Calibrated functional MRI: Mapping the dynamics of oxydative metabolism. Proc Natl Acad Sci USA. 1998;95:1834–1839. doi: 10.1073/pnas.95.4.1834. [DOI] [PMC free article] [PubMed] [Google Scholar]
- 5.Kim T, Hendrich KS, Masamoto K, Kim SG. Arterial versus total blood volume changes during neural activity-induced cerebral blood flow change: implication for BOLD fMRI. J Cereb Blood Flow Metab. 2007;27(6):1235–1247. doi: 10.1038/sj.jcbfm.9600429. [DOI] [PubMed] [Google Scholar]
- 6.Lu H, Golay X, Pekar JJ, Van Zijl PC. Functional magnetic resonance imaging based on changes in vascular space occupancy. Magn Reson Med. 2003;50(2):263–274. doi: 10.1002/mrm.10519. [DOI] [PubMed] [Google Scholar]
- 7.Lu H, Law M, Johnson G, Ge Y, van Zijl PC, Helpern JA. Novel approach to the measurement of absolute cerebral blood volume using vascular-space-occupancy magnetic resonance imaging. Magn Reson Med. 2005;54(6):1403–1411. doi: 10.1002/mrm.20705. [DOI] [PubMed] [Google Scholar]
- 8.Donahue MJ, Sideso E, MacIntosh BJ, Kennedy J, Handa A, Jezzard P. Absolute arterial cerebral blood volume quantification using inflow vascular-space-occupancy with dynamic subtraction magnetic resonance imaging. J Cereb Blood Flow Metab. 2010;30(7):1329–1342. doi: 10.1038/jcbfm.2010.16. [DOI] [PMC free article] [PubMed] [Google Scholar]
- 9.Hua J, Qin Q, Pekar JJ, Zijl PC. Measurement of absolute arterial cerebral blood volume in human brain without using a contrast agent. NMR Biomed. 2011 doi: 10.1002/nbm.1693. [DOI] [PMC free article] [PubMed] [Google Scholar]
- 10.Buxton RB, Wong EC, Frank LR. Dynamics of blood flow and oxygenation changes during brain activation: the balloon model. Magn Reson Med. 1998;39(6):855–864. doi: 10.1002/mrm.1910390602. [DOI] [PubMed] [Google Scholar]
- 11.Kim T, Kim SG. Temporal dynamics and spatial specificity of arterial and venous blood volume changes during visual stimulation: implication for BOLD quantification. J Cereb Blood Flow Metab. 2011;31:1211–1222. doi: 10.1038/jcbfm.2010.226. [DOI] [PMC free article] [PubMed] [Google Scholar]
- 12.Cha S, Knopp EA, Johnson G, Wetzel SG, Litt AW, Zagzag D. Intracranial mass lesions: dynamic contrast-enhanced susceptibility-weighted echo-planar perfusion MR imaging. Radiology. 2002;223(1):11–29. doi: 10.1148/radiol.2231010594. [DOI] [PubMed] [Google Scholar]
- 13.Weller RO, Preston SD, Subash M, Carare RO. Cerebral amyloid angiopathy in the aetiology and immunotherapy of Alzheimer disease. Alzheimers Res Ther. 2009;1(2):6. doi: 10.1186/alzrt6. [DOI] [PMC free article] [PubMed] [Google Scholar]
- 14.Petersen ET, Lim T, Golay X. Model-free arterial spin labeling quantification approach for perfusion MRI. Magn Reson Med. 2006;55(2):219–232. doi: 10.1002/mrm.20784. [DOI] [PubMed] [Google Scholar]
- 15.Brookes MJ, Morris PG, Gowland PA, Francis ST. Noninvasive measurement of arterial cerebral blood volume using Look-Locker EPI and arterial spin labeling. Magn Reson Med. 2007;58(1):41–54. doi: 10.1002/mrm.21199. [DOI] [PubMed] [Google Scholar]
- 16.Atkinson JL, Anderson RE, Sundt TM., Jr The effect of carbon dioxide on the diameter of brain capillaries. Brain research. 1990;517(1–2):333–340. doi: 10.1016/0006-8993(90)91046-j. [DOI] [PubMed] [Google Scholar]
- 17.Duelli R, Kuschinsky W. Changes in brain capillary diameter during hypocapnia and hypercapnia. J Cereb Blood Flow Metab. 1993;13(6):1025–1028. doi: 10.1038/jcbfm.1993.129. [DOI] [PubMed] [Google Scholar]
- 18.Kim T, Kim SG. Quantification of cerebral arterial blood volume and cerebral blood flow using MRI with modulation of tissue and vessel (MOTIVE) signals. Magn Reson Med. 2005;54(2):333–342. doi: 10.1002/mrm.20550. [DOI] [PubMed] [Google Scholar]
- 19.Yan L, Wang S, Zhuo Y, Wolf RL, Stiefel MF, An J, Ye Y, Zhang Q, Melhem ER, Wang DJ. Unenhanced dynamic MR angiography: high spatial and temporal resolution by using true FISP-based spin tagging with alternating radiofrequency. Radiology. 256(1):270–279. doi: 10.1148/radiol.10091543. [DOI] [PMC free article] [PubMed] [Google Scholar]
- 20.Kim SG. Quantification of relative cerebral blood flow change by flow-sensitive alternating inversion recovery (FAIR) technique: application to functional mapping. Magn Reson Med. 1995;34:293–301. doi: 10.1002/mrm.1910340303. [DOI] [PubMed] [Google Scholar]
- 21.Wong EC, Buxton RB, Frank LR. Quantitative imaging of perfusion using a single subtraction (QUIPSS and QUIPSS II) Magn Reson Med. 1998;39(5):702–708. doi: 10.1002/mrm.1910390506. [DOI] [PubMed] [Google Scholar]
- 22.Zhang Y, Song HK, Wang J, Techawiboonwong A, Wehrli FW. Spatially-confined arterial spin-labeling with FAIR. J Magn Reson Imaging. 2005;22(1):119–124. doi: 10.1002/jmri.20362. [DOI] [PubMed] [Google Scholar]
- 23.Scheffler K. On the transient phase of balanced SSFP sequences. Magn Reson Med. 2003;49(4):781–783. doi: 10.1002/mrm.10421. [DOI] [PubMed] [Google Scholar]
- 24.Wu WC, Jain V, Li C, Giannetta M, Hurt H, Wehrli FW, Wang DJ. In vivo venous blood T1 measurement using inversion recovery true-FISP in children and adults. Magn Reson Med. 64(4):1140–1147. doi: 10.1002/mrm.22484. [DOI] [PMC free article] [PubMed] [Google Scholar]
- 25.Wu WC, Fernandez-Seara M, Detre JA, Wehrli FW, Wang J. A theoretical and experimental investigation of the tagging efficiency of pseudocontinuous arterial spin labeling. Magn Reson Med. 2007;58(5):1020–1027. doi: 10.1002/mrm.21403. [DOI] [PubMed] [Google Scholar]
- 26.Dai W, Garcia D, de Bazelaire C, Alsop DC. Continuous flow-driven inversion for arterial spin labeling using pulsed radio frequency and gradient fields. Magn Reson Med. 2008;60(6):1488–1497. doi: 10.1002/mrm.21790. [DOI] [PMC free article] [PubMed] [Google Scholar]
- 27.Markl M, Alley MT, Elkins CJ, Pelc NJ. Flow effects in balanced steady state free precession imaging. Magn Reson Med. 2003;50(5):892–903. doi: 10.1002/mrm.10631. [DOI] [PubMed] [Google Scholar]
- 28.Wang J, Alsop DC, Song HK, Maldjian JA, Tang K, Salvucci AE, Detre JA. Arterial transit time imaging with flow encoding arterial spin tagging (FEAST) Magn Reson Med. 2003;50(3):599–607. doi: 10.1002/mrm.10559. [DOI] [PubMed] [Google Scholar]
- 29.Wang J, Fernandez-Seara MA, Wang S, St Lawrence KS. When perfusion meets diffusion: in vivo measurement of water permeability in human brain. J Cereb Blood Flow Metab. 2007;27(4):839–849. doi: 10.1038/sj.jcbfm.9600398. [DOI] [PubMed] [Google Scholar]
- 30.Donahue MJ, Lu H, Jones CK, Edden RA, Pekar JJ, van Zijl PC. Theoretical and experimental investigation of the VASO contrast mechanism. Magn Reson Med. 2006;56(6):1261–1273. doi: 10.1002/mrm.21072. [DOI] [PubMed] [Google Scholar]
- 31.Ostergaard L, Weisskoff RM, Chesler DA, Gyldensted C, Rosen BR. High resolution measurement of cerebral blood flow using intravascular tracer bolus passages. Part I: Mathematical approach and statistical analysis. Magn Reson Med. 1996;36(5):715–725. doi: 10.1002/mrm.1910360510. [DOI] [PubMed] [Google Scholar]
- 32.Gu H, Lu H, Ye FQ, Stein EA, Yang Y. Noninvasive quantification of cerebral blood volume in humans during functional activation. NeuroImage. 2006;30(2):377–387. doi: 10.1016/j.neuroimage.2005.09.057. [DOI] [PubMed] [Google Scholar]
- 33.Mchedlishvili G. Arterial behavior and blood circulation in the brain. New York: Plenum Press; 1986. [Google Scholar]
- 34.Scheffler K, Heid O, Hennig J. Magnetization preparation during the steady state: fat-saturated 3D TrueFISP. Magn Reson Med. 2001;45(6):1075–1080. doi: 10.1002/mrm.1142. [DOI] [PubMed] [Google Scholar]
- 35.McHedlishvili G. Physiological mechanisms controlling cerebral blood flow. Stroke. 1980;11(3):240–248. doi: 10.1161/01.str.11.3.240. [DOI] [PubMed] [Google Scholar]
- 36.Ho YC, Petersen ET, Golay X. Measuring arterial and tissue responses to functional challenges using arterial spin labeling. NeuroImage. 2010;49(1):478–487. doi: 10.1016/j.neuroimage.2009.07.040. [DOI] [PubMed] [Google Scholar]
- 37.Lee SP, Duong TQ, Yang G, Iadecola C, Kim SG. Relative changes of cerebral arterial and venous blood volumes during increased cerebral blood flow: implications for BOLD fMRI. Magn Reson Med. 2001;45(5):791–800. doi: 10.1002/mrm.1107. [DOI] [PubMed] [Google Scholar]
- 38.Hoge RD, Atkinson J, Gill B, Crelier GR, Marrett S, Pike GB. Linear coupling between cerebral blood flow and oxygen consumption in activated human cortex. Proceedings of the National Academy of Sciences of the United States of America. 1999;96(16):9403–9408. doi: 10.1073/pnas.96.16.9403. [DOI] [PMC free article] [PubMed] [Google Scholar]
- 39.St Lawrence KS, Wang J. Effects of the apparent transverse relaxation time on cerebral blood flow measurements obtained by arterial spin labeling. Magn Reson Med. 2005;53(2):425–433. doi: 10.1002/mrm.20364. [DOI] [PubMed] [Google Scholar]
- 40.Yan L, Yu J, Xue Y, Kumar R, Song HK, Wang DJ. Time-Resolved 4D MRA using TrueFISP based Spin Tagging and Dynamic Golden Angle Radial Acquisition. Proc Intl Soc Magn Reson Med. 2011;19:2826. [Google Scholar]


