

Abstract
Previous studies using gene-targeted mutant mice revealed several molecules important for the development or function of invariant natural killer (iNKT)-cells. However, these gene knockout mice represent cases that are rare in humans. Thus, it remains unclear how naturally occurring allelic variants of these genes or others regulate the numerical and functional diversity of iNKT-cells in both mice and humans. Studies in humans are mostly limited to iNKT-cells in peripheral blood (PB). It is not known if the relative distribution of iNKT-cells between PB and other lymphoid organs is correlated or under common genetic control. To initially address these questions, we analyzed iNKT-cells in the spleen, thymus, and PB of 38 inbred mouse strains. Percentages of iNKT-cells in these three anatomical sites varied significantly in a strain-dependent manner. The correlation between PB and spleen was moderate, and none was observed between PB and thymus. Similarly, proportions of the CD4-expressing subset of iNKT-cells differed significantly among inbred strains. The percentages of CD4-positive iNKT-cells displayed a strong correlation between PB and spleen although it remained poor between PB and thymus. Genome-wide association studies across strains identified only partially overlapping loci associated with variability of iNKT-cell frequencies within and between differing anatomical sites.
Keywords: iNKT cells, peripheral blood, genetics, inbred mice, strain survey
Introduction
CD1d-restricted invariant natural killer T (iNKT)-cells are unique immunoregulatory populations with diverse functions 1. Distinct from conventional CD4 and CD8 T-cells, iNKT-cells are selected by CD1d-expressing CD4+CD8+ double positive (DP) thymocytes and thereafter in mice develop into CD4+, CD4−CD8− double negative (DN), and the interleukin (IL)-17 producing subsets 2, 3. iNKT-cells can promote immune responses against tumors and infectious organisms, but they are also paradoxically capable of suppressing autoimmunity 4. It has been suggested that the seemingly opposite outcomes of immune regulation are due to the preferential involvement of distinct iNKT-cell subsets. Alternatively, they could also result from differential iNKT-mediated activation of immunogenic versus tolerogenic dendritic cells (DC) at the time when the immune responses are initiated 5.
Defects in iNKT-cells have been linked to several diseases, including autoimmune type 1 diabetes (T1D) 6. In the NOD mouse model of T1D, disease development partly results from the numerical and functional defects in iNKT-cells characterizing this strain 7. This conclusion is based on the findings that NOD mice were protected from T1D by administration of the iNKT-cell super-angonist α-galactosylceramide (α-GalCer) 8-11. In addition, it has been reported that CD1d-deficient NOD mice lacking iNKT-cells exhibit accelerated T1D 11, 12. Moreover, increasing iNKT-cell numbers by adoptive transfer prevented T1D development in NOD mice 13, 14. Genetically, multiple T1D susceptibility (Idd) loci have been associated with an altered iNKT-cell compartment and likely contribute to disease development in NOD mice by limiting the generation or function of these immune regulators 15-19.
In contrast to the mouse studies, the role of iNKT-cells in human T1D has been controversial 6. Early studies indicated that frequencies of iNKT-cells were reduced in T1D patients and functionally they were altered with an impaired ability to produce Th2 cytokines 20, 21. However, these observations were later challenged by others as the numerical and functional differences between iNKT-cells in human T1D patients and control subjects were not consistently reported 22, 23. It has also been reported that while no differences were found in the frequencies of total iNKT-cells, the proportions of the CD4+ subset were significantly reduced in humans with or at high risk for T1D 24, 25. These results are consistent with the idea that different iNKT-cell subpopulations have distinct functions and those expressing CD4 preferentially promote tolerance induction 26-28. The inconsistent human study reports could be due to several reasons. The most apparent difference between human and murine studies was the source of cells used for comparison. Cells isolated from lymphoid organs, such as the thymus, spleen, and lymph nodes were used to compare the frequency of iNKT-cells between NOD mice and other non-autoimmune prone control strains. On the other hand, these lymphoid organs are not readily accessible in humans and all the above mentioned clinical studies analyzed peripheral blood (PB) leukocytes. Importantly, it has been shown that the frequencies of PB iNKT-cells did not always correlate with those in the thymi of human infants 29. Furthermore, it has also been shown that despite being significantly reduced in lymphoid organs, numbers of iNKT-cells in PB of NOD mice are comparable to that of the BALB/c and C57BL/6 control strains 30. To date, the only human study that used cells isolated from pancreatic lymph nodes (PLN) indicated that iNKT-cells from T1D patients have a reduced ability to produce IL-4, although direct comparisons between PLN and PB in the same individuals were not determined 31. Therefore, additional human studies that analyze iNKT-cells in different lymphoid organs are required to further assess their role in T1D.
In addition to the source of cells used for evaluation, the large variations of PB iNKT-cell frequencies in humans (>100 fold) also confound the comparison between different subject groups 23-25, 29, 32. While to what extent environmental factors could alter the frequency of iNKT-cells in humans is not known, it appears that it is largely genetically controlled 23. Although not to the level seen in humans, studies using a limited number of inbred mouse strains also showed a high degree of variation in iNKT-cell-frequencies in the liver 33. Taken together, these results suggest that the development of iNKT-cells is a complex trait controlled by multiple genetic variants that normally exist in humans and mice. One approach to further determine if iNKT-cells modulate the development of T1D or other disorders in humans is to ask if disease susceptibility genes or the pathways in which they participate are also involved in controlling the frequency and/or functional activity of such immunoregulatory populations at various anatomical sites. It is also important to determine if the distribution of iNKT-cells in PB and lymphoid organs may be under common genetic control. As a first step to address these questions, we surveyed a large panel of inbred mouse strains for the frequencies of iNKT-cells in the spleen, thymus, and PB, and used a genome-wide association (GWA) mapping approach to identify novel loci that modulate the development/homeostasis of these immune regulators.
Results
Strain dependent variations of iNKT-cell frequencies in the PB, spleen, and thymus
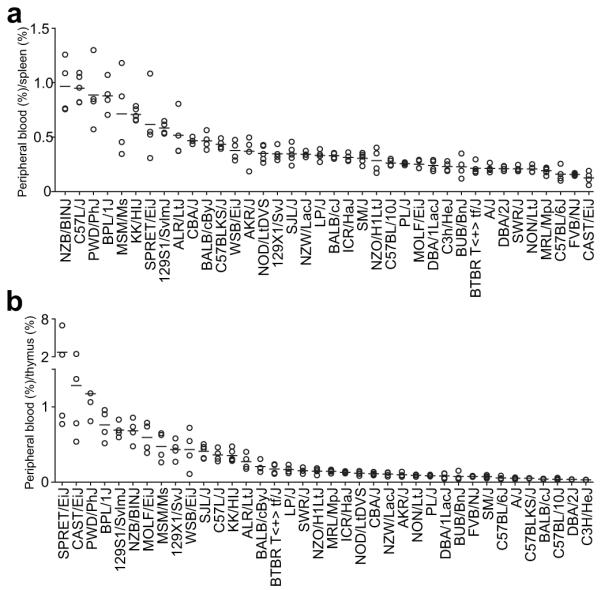
Development of iNKT-cells is reportedly controlled by a large number of genes 34, 35. However, most of the studies assessed iNKT-cell deficiencies resulting from complete expression loss of targeted genes in mutant mice. Studies using a limited number of inbred mouse strains indicate that naturally existing genetic variants also modulate homeostasis and the functional activity of iNKT-cells 33. To further extend these previous findings, we analyzed iNKT-cells in the PB, spleen, and thymus of 38 inbred mouse strains, selected on a basis of possessing diverse genetic backgrounds. To normalize the variations in the frequencies of total T-cells, we present the results as a proportion of iNKT-cells among total TCRβ+ cells in the PB and spleen, and of total TCRβhigh cells in the thymus. As shown in Figure 1, the percentages of iNKT-cells in different strains were highly variable in the PB and both lymphoid organs (P < 0.0001 across all strains, one way ANOVA). iNKT-cell percentages ranged from 3.2% to 0.01% in the PB, 4.12% to 0.02% in the spleen, and 9.39% to 0.02% in the thymus, a variation level comparable to what was reported in humans 23-25, 29, 32. It is worth noting that all wild-derived inbred strains (CAST/EiJ, MOLF/EiJ, MSM/Ms, PWD/PhJ, SPRET/EiJ, and WSB/EiJ) had low proportions of iNKT-cells at each examined site. In particular, iNKT-cells were almost not detectable in MSM/Ms and PWD/PhJ mice. NOD mice reported to have reduced numbers of iNKT-cells were indeed found to be at the low end of the spectrum at each anatomical site compared to the array of analyzed strains (most not previously examined), further supporting the role of iNKT-cells in the regulation of T1D.
Figure 1.

Percentages of total iNKT-cells. Red blood cell-depleted single cell suspensions were obtained from peripheral blood (A), spleen (B), and thymus (C) of each inbred mouse strain. iNKT-cells were identified by a staining cocktail containing CD1d tetramers, anti-TCRβ, and anti-CD4. The results are presented as the percentages of total TCRβ+ cells in peripheral blood and the spleen, and of total TCRβhigh cells in the thymus. Each symbol represents one mouse (4-5 mice per strain). The horizontal bar indicates the mean of each strain.
Strain dependent development of iNKT-cell subsets
Mouse iNKT-cells can be grouped into two subsets based on the surface expression of CD4 molecules. Therefore, we asked if different strains exhibited preferential accumulation of the CD4+ subsets in the PB, spleen and thymus. Because the overall frequencies of iNKT-cells in the PB, spleen, and thymus of PWD/PhJ, SPRET/EiJ, and MSM/Ms mice, as well as the PB of the CAST/EiJ strain were all extremely low, these strains were excluded from the CD4+ iNKT-cell subset analyses in the corresponding anatomical sites. Similar to the percentages of total iNKT-cells, the proportions of the CD4+ subset also showed profound strain-dependent variations in all 3 anatomical sites (Fig. 2, P < 0.0001 across all strains, one way ANOVA). Functional differences have been ascribed to CD4+ and DN iNKT-cells, as in several disease models, the former subset preferentially exerted immunological tolerance induction activities 26-28, 36. When compared to most other strains, NOD mice also had reduced proportions of CD4+ iNKT-cells (Figure 2). These results further support our previous studies indicating that CD4+ iNKT-cells are part of an immunoregulatory network modulating T1D development 36.
Figure 2.

Proportions of iNKT-cells that also express CD4. Red blood cell-depleted single cell suspensions were obtained from peripheral blood (A), spleen (B), and thymus (C) of each inbred mouse strain. iNKT-cells were identified by a staining cocktail containing CD1d tetramers, anti-TCRβ, and anti-CD4. The results are presented as the percentages among total iNKT-cells. Each symbol represents one mouse (4-5 mice per strain). The horizontal bar indicates the mean of each strain.
Correlation of iNKT-cells in PB and in lymphoid organs
We next determined if the percentage of iNKT-cells in PB can reflect that in the spleen and thymus. We determined the Pearson correlation between PB and splenic iNKT-cells and between those in PB and the thymus. As presented in Figure 3A, the percentages of total iNKT-cells in the PB and spleen showed an overall positive but only moderate correlation (r = 0.6336, P < 0.0001). In contrast, no correlation was found between the percentages of total iNKT-cells in the PB and thymus (Fig. 3B, r = 0.1963, P = 0.2376). Compared to the percentages of total iNKT-cells, there was a greater overall positive correlation in the proportions of the CD4+ subset between PB and the spleen (Fig. 3C, r = 0. 801 8, P < 0.0001), as well as between PB and the thymus (Fig. 3D, r = 0.5023, P = 0.0025). Further analyses were carried out to determine if there was genetic variability in the extent to which the proportion of iNKT-cells in PB could predict their levels in lymphoid organs. This was done by determining across all 38 strains the ratio of the percentage of iNKT-cells in PB to that in spleen (Fig. 4A). The same was done for the PB and thymus (Fig. 4B). A ratio of 1.0 would indicate the frequency of iNKT-cells in PB accurately reflects that in spleen and/or thymus. Ratios of less than or greater than 1.0 would respectively indicate the frequency of iNKT-cells in PB under or over represents their levels in spleen and/or thymus. These analyses clearly showed a strain dependent variation in the relative distribution of iNKT-cells in PB and lymphoid organs (P < 0.0001 across all strains, one way ANOVA). In only a handful of strains does the percentage of iNKT-cells in PB reflect that in lymphoid organs. In most cases the frequency of iNKT-cells in PB was found to under-estimate that in lymphoid tissues. Interestingly, in three wild derived strains (SPRET/EiJ, CAST/EiJ, PWD/PhJ) characterized by overall very low levels of iNKT-cells (Fig. 1), the frequency of such immunomodulatory cells in PB would over-estimate that in the thymus (Fig. 4B).
Figure 3.

Correlation of iNKT-cells in peripheral blood and lymphoid organs. Correlation of the frequencies of total iNKT-cells (A and B) or the percentages of CD4-expressing iNKT-cells (C and D) between peripheral blood and the spleen (A and C), and peripheral blood and the thymus (B and D) was determined by the Pearson correlation coefficient analysis. The line in each plot represents the best linear fit.
Figure 4.
Distribution of iNKT-cells in peripheral blood relative to the spleen and thymus. The ratio was calculated by dividing the percentage of total iNKT-cells in peripheral blood by the corresponding frequency in the spleen (A) or thymus (B) in individual mice. Each symbol represents one mouse (4-5 mice per strain). The horizontal bar indicates the mean of each strain.
Genome-wide association mapping
The genome-wide association mapping approach has had some success in identifying genetic loci that control important biological processes in mice 37-39. The large panel of inbred mouse strains analyzed here and the availability of the high-density SNP genotyping data provided us an opportunity to perform genome-wide association mapping of several of the iNKT-cell-related traits evaluated in this study. As SNP genotyping results were not available for the SPRET/EiJ strain it was not included in the mapping study. We chose the percentages of iNKT-cells in the spleen and thymus (Figs. 1B and 1C) as phenotypes for association mapping studies to evaluate if genetic regions or genes previously found to regulate the development and homeostasis of these cells 34, 35 could be identified in our studies. We further attempted to identify loci that regulate the PB:spleen iNKT-cell ratio (Fig. 4A) as a phenotype for the association mapping studies. SNP data were originally obtained from the Center of Genome Dynamics at The Jackson Laboratory (http://cgd.jax.org/) and analyzed as described in Materials and Methods. A complete list of SNPs used for genome-wide association mapping will be provided upon request. Based on a score of 5 or higher (P < 10−5), several loci on Chromosomes (Chr.) 4, 6, 7, 9, 10, 12, 14, 19, and X were found to be significantly associated with the percentages of thymic iNKT-cells (Fig. 5A). Several peaks on Chr. 4, 5, 6, 7, 10, 12, 17, and 19 were found to be linked to the frequencies of splenic iNKT-cells (Fig. 5B). Multiple loci on Chr. 1, 2, 4, 5, 6, 8, 9, 10, 11, 13, 14, 17, and X were identified to regulate the PB/spleen ratio (Fig. 5C). The location of the loci found by genome-wide association analyses to regulate various aspects of iNKT-cell development and the complete list of genes within them are summarized in Tables 1, 2, and 3. Interestingly, as indicated in Tables 1 and 2 regions on Chr. 4, 6, 7, 10, 12, and 19 were indicated to contain a gene(s) commonly contributing to both thymic and splenic iNKT-cell levels. Among these, a cluster of genetic loci on the proximal end of Chr 7 was found to jointly contribute to both thymic and splenic iNKT-cell levels. However, unexpectedly no genes previously reported to regulate iNKT development mapped to any of these chromosomal regions 34, 35.
Figure 5.

Genome-wide association studies of the iNKT-cell compartment. Three traits were analyzed: the percentages of total iNKT-cells among TCRβhigh cells in the thymus (A), the percentages of iNKT cells among TCRβ+ cells in the spleen (B), and the ratio between peripheral blood and the spleen (C). The dotted line indicates a score of 5 (P = 10−5)
Table 1.
Summary of genome wide association studies for the frequency of thymic iNKT cells.
| chromosome | position (Mb) | peak score | gene upstream | gene within | gene downstream |
|---|---|---|---|---|---|
| 4 | 43.57-43.58 | 5.41 | Tpm2 | Tln1, Creb3, Gba2 | Rgp1 |
| 4 | 143.03-143.09 | 5.55 | Pramef8 | Oog4 | Gm13043 |
| 6 | 81.58-81.60 | 5.23 | Gm4408 | NA | Mir468 |
| 7 | 3.10-3.62 | 6.27 | NA |
AU018091, AU018091, Mir290, Mir291a, Mir292, Mir291b, Mir293, Mir294, Mir295, Nlp12, Myadm, Prkcc, Cacng7, Cacng8, Cacng6, Vstm1, Tarm1, Oscar, Ndufa3, Tfpt, Prpf31, Cnot3, Leng1 |
Tmc4 |
| 7 | 3.66-3.66 | 5.75 | Tsen34 | Rps9, Lilrb3 | Pira1 |
| 7 | 4.47-4.62 | 5.77 | Tnnt1 | Tnni3, 6030429G01Rik, Syt5, Ptprh, Tmem86b, Ppp6r1, Hspbp1 |
Brsk1 |
| 7 | 4.76-4.77 | 5.03 | Rpl28 | Ube2s, Shisa7 | Isoc2b |
| 7 | 13.58-14.02 | 6.35 | Zfp446 | Slc27a5, Zbtb45, Gm3901, Trim28, Ube2m, Mzf1, Vmn1r85, Gm10301, Vmn1r87, Vmnlr88, Vmn1r89, 6330408A02Rik, Lig1, Pla2g4c, Gm10712, Cabp5 |
Bsph1 |
| 7 | 14.93-16.25 | 6.08 | Gm5585 | 2810007J24Rik, Vmn1r90, Gm4745, Gm9545, Obox2, Obox1, Obox3 |
Obox5 |
| 7 | 16.48-16.49 | 5.35 | Crx | Crxos1 | Sepw1 |
| 7 | 20.65-21.97 | 6.23 | n-R5s152 | Vmn1r91, Gm16442, Vmn1r93, Vmn1r94, Gm4494, Gm6164, Gm4498, Gm5890, Gm4133, Gm4505, Gm5728, Vmn1r100, Vmn1r101, Gm10670, Vmn1r103, Vmn1r104, Gm5726, Gm4141, Gm5156, Vmn1r109, Vmn1r110, Vmn1r111, Gm10668, Vmn1r112, Vmn1r113, Vmn1r114, Vmn1r115, Vmn1r116, Vmn1r118, Vmn1r119, Gm4534, Vmn1r120, Vmn1r121, Vmn1r122, Vmn1r123 |
Vmn1r124 |
| 9 | 86.00-86.00 | 5.43 | Tpbg | NA | Ube2cbp |
| 9 | 114.99-115.01 | 5.08 | Gm9846 | Osbpl10 | Sttb3 |
| 9 | 118.79-118.80 | 5.20 | Golga4 | Itga9 | Ctdspl |
| 9 | 119.65-119.67 | 5.35 | Scn10a | Scn11a | Gm2449 |
| 9 | 119.91-119.93 | 6.35 | Csrnp1 | Xirp1 | Cx3cr1 |
| 10 | 81.17-81.51 | 6.17 | Gm8117 | GM3055, Gm8264, Gm4767, Gm8137, Zfp433, Zfp781, Gm8156, Gm8158, Gm8290, AL117821 |
Zfp873 |
| 12 | 68.44-79.94 | 6.72 | Mdga2 | n-R5s60, n-R5s61 | Gm2912 |
| 12 | 70.39-70.39 | 6.81 | Klhdc1 | NA | Klhdc2 |
| 12 | 71.11-71.41 | 17.24 | Gm3086 | Nin, Gm9997, Abhd12b, Pygl, Trim9 | Tmx1 |
| 12 | 73.09-73.09 | 6.28 | Dact1 | Daam1 | Gpr135 |
| 12 | 73.44-73.45 | 5.20 | 4930403N07Rik | Rtn1 | Lrrc9 |
| 12 | 74.27-74.30 | 5.82 | Six4 | Mnat1 | Trmt5 |
| 12 | 76.83-77.15 | 7.15 | Wdr89 | Sgpp1, Syne2 | Esr2 |
| 12 | 77.41-77.41 | 5.07 | Tex21 | Mthfd1 | Akap5 |
| 12 | 77.56-77.60 | 5.00 | Gm70 | NA | Plkhg3 |
| 12 | 98.44-98.45 | 5.72 | 1700019M22Rik | NA | Gm2417 |
| 14 | 75.82-76.03 | 6.18 | Zc3h13 | Siah3, Spert | 4930564B18Rik |
| 19 | 48.36-48.41 | 5.82 | Gm9494 | Sorcs3 | Gm4095 |
| X | 63.45-63.49 | 5.73 | Ctag2 | NA | 4930447F04Rik |
NA: not available. Chromosomal regions noted in bold and underlined contain a gene(s) commonly contributing to both thymic and splenic iNKT-cell levels.
Table 2.
Summary of genome wide association studies for the frequency of iNKT cells in the spleen.
| chromosome | position (Mb) | peak score | gene upstream | gene within | gene downstream |
|---|---|---|---|---|---|
| 4 | 143.03-143.09 | 5.22 | Pramef8 | Oog4 | Gm13043 |
| 5 | 82.90-82.93 | 5.10 | Lphn3 | NA | Mir1187 |
| 6 | 81.58-81.60 | 7.03 | Gm4408 | NA | Mir468 |
| 7 | 3.10-3.62 | 7.27 | NA |
AU018091, Mir290, Mir291a, Mir292, Mir291b, Mir293, Mir294, Mir295, Nlrp12, Myadm, Prkcc, Cacng7, Cacng8, Cacng6, Vstm1, Tarm1, Oscar, Ndufa2, Tfpt, Prpf31, Cnot3, Leng1 |
Tmc4 |
| 7 | 3.66-3.66 | 5.65 | Tsen34 | Rps9, Lilrb3 | Pira1 |
| 7 | 4.47-4.62 | 6.92 | Tnni1 | 6030429G01Rik, Syt5, Ptprh, Tmem86b, Ppp6r1, Hspbp1 |
Brsk1 |
| 7 | 4.69-4.84 | 7.58 | Tmem150b | Suv420h2, Cox6b2, Fam71e2, Il11, Tmem190, 2210411K11Rik, Rpl28, Ube2s, Shisa7, Isoc2b, Isoc2a |
Zfp628 |
| 7 | 13.58-13.87 | 7.41 | Zfp446 | Slc27a5, Zbtb45, Gm3901, Trim28, Chmp2a, Ube2m, Mzf1, Vmn1r85, Gm10301, Vmn1r87, Vmn1r88, Vmn1r89, 6330408A02Rik, Lig1 |
Pla2g4c |
| 7 | 14.00-14.02 | 5.95 | Gm10712 | Cabp5 | Bsph1 |
| 7 | 14.93-16.25 | 7.41 | Gm5585 | 2810007J24Rik, Vmn1r90, Gm4745, Gm9545, Obox2, Obox1, Obox3, Obox5 |
Obox5 |
| 7 | 16.48-16.49 | 6.26 | Crx | Crxos1 | Sepw1 |
| 7 | 20.65-21.97 | 7.70 | n-R5s152 | Vmn1r91, Gm16442, Vmn1r93, Vmn1r94, Gm17331, Gm4494, Gm6164, Gm4498, Gm5890, Gm4133, Gm4505, Gm5728, Vmn1r100, Vmn1r101, Gm10670, Vmn1r103, Vmn1r104, Gm5726, Gm4141, Vmn1r107, Gm4144, Gm5156, Vmn1r109, Vmn1r110, Vmn1r111, Gm10668, Vmn1r112, Vmn1r113, Vmn1r114, Vmn1r115, Vmn1r116, Vmn1r117, Vmn1r118, Vmn1r119, Gm4534, Vmn1r120, Vmn1r121, Vmn1r122, Vmn1r123 |
Vmn1r124 |
| 10 | 81.17-81.51 | 7.62 | Gm8117 | Gm8117, Gm3055, Gm8264, Gm4767, Gm8137, Zfp433, Zfp781, Gm8156, Gm8158, Gm8290, AL117821 |
Zfp873 |
| 12 | 98.42-98.45 | 7.29 | 1700019M22Rik | NA | Gm2417 |
| 12 | 99.76-99.79 | 5.09 | Gpr65 | Kcnk10 | Spata7 |
| 17 | 73.51-73.51 | 7.77 | Lbh | Lclat1 | Capn13 |
| 19 | 48.36-48.41 | 7.44 | Gm9494 | Sorcs3 | Gm4095 |
NA: not available. Chromosomal regions noted in bold and underlined contain a gene(s) commonly contributing to both thymic and splenic iNKT-cell levels.
Table 3.
Summary of genome wide association studies for the relative iNKT cells distribution in the PB and spleen.
| chromosome | position (Mb) | peak score | gene upstream | gene within | gene downstream |
|---|---|---|---|---|---|
| 1 | 107.46-107.48 | 8.49 | Gm17634 | Pign | 2310035C23Rik |
| 2 | 47.00-48.32 | 5.46 | Zeb2 | NA | Acvr2a |
| 4 | 130.40-130.41 | 5.46 | Sdc3 | NA | Laptm5 |
| 5 | 82.45-82.54 | 5.68 | Lphn3 | NA | Mir1187 |
| 5 | 142.44-142.44 | 5.46 | Card11 | Sdk1 | Foxk1 |
| 6 | 28.64-29.02 | 6.75 | Pax4 | Snd1, Lrrc4, Gm3294, Lep | Rbm28 |
| 8 | 10.50-10.66 | 5.45 | Tnfsf13b | Myo16 | Gm2814 |
| 9 | 15.87-15.87 | 5.77 | Mtnr1b | Fat3 | Chordc1 |
| 10 | 106.23-106.23 | 5.50 | Gm7263 | Ppfia2 | Acss3 |
| 11 | 109.07-109.11 | 5.86 | E030025P04Rik | Rgs9 | Gm11696 |
| 13 | 21.16-21.17 | 7.16 | Aoah | Olfr1370 | Oflr1368 |
| 14 | 73.53-73.56 | 5.68 | Cysltr2 | Rcbtb2 | Rb1 |
| 17 | 27.97-28.19 | 5.46 | D17Wsu92e | Snrpc, Uhrf1bp1, Taf11, Anks1 | Tcp11 |
| X | 63.45-63.49 | 9.76 | Ctag2 | NA | 4930447F04Rik |
NA: not available
Discussion
A survey approach utilizing 38 classical and wild-derived inbred mouse strains was used to further understand the genetic control of iNKT-cell development. Our primary finding is that the degree of variation in iNKT-cell frequency across multiple inbred mouse strains is similar to what has been observed in humans 23-25, 29, 32. Since our mice were housed in a well-controlled specific pathogen free environment, the genetic background is expected to be the primary contributor to the observed strain-dependent variation. Previous studies in identical twins also suggested that the genetic background contributes more significantly than environmental factors to the variation of iNKT-cell frequencies in humans 23. Taken together, these results indicate that development of iNKT-cells in both humans and mice is a complex trait that requires further studies to more fully understand its genetic basis. An important finding of the current study stems from the comparison of iNKT-cell levels in PB and lymphoid organs. These analyses revealed while there is some correlation, levels of total iNKT cells in PB do not necessarily predict their frequency in lymphoid tissue. We also confirm that compared to most of the strains analyzed, autoimmune T1D prone NOD mice have severely reduced levels of iNKT-cells. However, NOD mice exhibited a higher PB:spleen ratio of total iNKT cells compared to many other strains (Fig. 4). This observation was in line with a previous report 30. While weak for total iNKT-cells, there is a strong correlation between PB and spleen in the proportion of the CD4+ subset. Taken together, these results suggest that in PB-based human studies analyses of the proportion of CD4+ rather than total iNKT-cells may provide a more consistent and reliable readout of their levels in lymphoid tissues.
A somewhat surprising finding in our current studies is that most wild-derived inbred mouse strains had very low frequencies of iNKT-cells (Fig. 1). Some of them had barely detectable iNKT-cells. Polymorphisms in the CD1d1 gene found in wild-derived inbred strains of Mus spretus and Mus musculus castaneus origins affect its antigen presentation function 40. When congenically expressed in C57BL/6 mice, Mus spretus-derived CD1d1 molecules had a diminished ability to select iNKT-cells resulting a ~50% reduction of these cells in the thymus 40. Therefore, the allele difference in CD1d1 could contribute to the overall low frequencies of iNKT-cells in the wild-derived inbred strains examined here. However, the extremely low levels of iNKT-cells in some of those strains, such as SPRET/EiJ (Mus spretus), can not be explained solely by the previously reported polymorphisms in the CD1d1 gene. Furthermore, the MSM/Ms strain that belongs to the Mus musculus molossinus subspecies previously found to have the same CD1d1 allele as that in C57BL/6 mice virtually lacked iNKT-cells (Fig. 1). GWA studies did not reveal an association of any analyzed iNKT phenotype with a genetic control component on Chr 3 where the CD1d1 gene is located. While this could be explained by the exclusion of SPRET/EiJ from the mapping studies, it also suggests that the overall contribution of the CD1d1 polymorphisms from other wild-derived inbred strains, such as CAST/EiJ, is relatively weak to reach the threshold for the whole genome association study. Collectively, these results indicate that genetic components other than CD1d1 polymorphisms contribute more strongly to the largely reduced iNKT-cell levels in wild-derived inbred strains. Therefore, identification of the other genetic components that inhibit the development of iNKT-cells in the wild-derived inbred strains represents an area warranting further studies.
Genome-wide association mapping studies identified loci on on Chr. 4, 6, 7, 10, 12, and 19 were found to contain a gene(s) regulating the levels of both thymic and splenic iNKT-cells. In this regard the proximal end of Chr. 7 is of particular interest as it contains a cluster of loci linked to levels of both thymic and splenic iNKT-cells. This Chr. 7 cluster includes a region between 3.10-3.62Mb where several microRNAs (Mir290 to Mir295) are located. This may be of significance as microRNAs are reported to be important for normal iNKT-cell development 41, 42. In addition, the most significant region detected in our entire analyses (peak score = 17.24) was for a locus on Chr 12 regulating levels of thymic iNKT-cells. Genes within these collective regions will be prioritized for future studies.
Previous studies using a backcross approach from C57BL/6 to NOD.Nkrp1b mice identified two loci respectively on Chr 1 and 2 significantly linked to the frequency of thymic iNKT-cells 43. Both loci (Nkt1 and Nkt2) were subsequently confirmed by congenic analysis, and Slamf1 and Slamf6 within the Nkt1 locus have also been shown to regulate iNKT-cell development 17, 44-46. To our surprise, neither locus was detected by our genome-wide association mapping across strains for thymic iNKT-cell frequencies. One possible explanation is that the statistical power in our study was not high enough to detect Nkt1 and Nkt2 due to the increased genetic complexity and an insufficient number of inbred strains used in our study. In a genetically more complex but overall small population as in our case, contributions from other loci may exceed Nkt1 and Nkt2 in terms of ability to regulate thymic iNKT-cells. A non-mutually exclusive possibility is that other genetic variants present in some of the strains analyzed here mask the effect of Nkt1 and Nkt2. As a result, the likelihood to detect these two loci in our analysis is reduced. In any case, it can be predicted that more loci than Nkt1 and Nkt2 can be identified if different pairs of inbred mouse strains were chosen for an F2 or first-backcross analyses to map genes controlling the development of iNKT-cells. Our results also further indicate the development and anatomical distribution of iNKT-cells are complex traits that remain to be fully dissected. While genome-wide association studies (GWAS) have provided a tremendous amount of information to our understanding of the genetic control of several disease-related traits in humans, the same approach remains a challenge when a limited number of mouse strains are used. Nevertheless, our strain survey results and GWAS provide a starting point for the future identification and functional characterization of genes controlling various aspects of iNKT-cell development.
In conclusion, we showed a large variation in iNKT-cell frequency across multiple inbred mouse strains similar to the case in humans. Relatively poor correlation in the frequency of total iNKT-cells between PB and the spleen or thymus further emphasizes the importance of comprehensive analysis of lymphoid organs in humans when possible. Finally, our results will facilitate the selection of mouse strains for future studies mapping genes regulating iNKT-cell development.
Materials and Methods
Mice and reagents
The following 38 inbred strains were used for the current study: 129S1/SvImJ, 129X1/SvJ, A/J, AKR/J, ALR/LtJ, BALB/cByJ, BALB/cJ, BPL/1J, BTBR T<+> tf/J, BUB/BnJ, C3H/HeJ, C57BL/10J, C57BL/6J, C57BLKS/J, C57L/J, CAST/EiJ, CBA/J, DBA/1LacJ, DBA/2J, FVB/NJ, ICR/HaJ, KK/HlJ, LP/J, MOLF/EiJ, MRL/MpJ, MSM/Ms, NOD/LtDVS, NON/LtJ, NZB/BINJ, NZO/H1LtJ, NZW/LacJ, PL/J, PWD/PhJ, SJL/J, SM/J, SPRET/EiJ, SWR/J, WSB/EiJ. All mice were maintained at The Jackson Laboratory under specific pathogen free (SPF) conditions. Male mice between 8 to 10 weeks of age were used for iNKT-cell analyses. α-galactosylceramide analog PBS57-loaded CD1d tetramers were provided by the NIH tetramer core facility. CD4 (clone RM4-5) and TCRβ (clone H57-597) specific antibodies were purchased from BD Bioscience.
Flow cytometry
Red blood cell depleted single cell suspensions were prepared from the thymus, spleen, and peripheral blood. Cells were Fc blocked at room temperature with anti-CD16/CD32 (clone 2.4G2, BD Bioscience) for 10 min followed by an antibody cocktail containing CD1d/α-galactosylceramide analog loaded tetramers, anti-CD4, and anti-TCRβ for 30 min at 4°C. Stained cells were washed and analyzed on a FACSCalibur flow cytometer (Becton Dickinson) using the CellQuest software. Propidium iodide was used to gate out dead cells.
Statistical analysis
Genome-wide association mapping was performed using the free R add-on package EMMA (Efficient Mixed Models Association: http://mouse.cs.ucla.edu/emma), which uses a linear mixed model algorithm to control for population structure and genetic relatedness 47. We input phenotype at per animal level and carried out the analysis using a panel of 549,599 single nucleotide polymorphisms (SNPs) that passed quality control filtering from the Mouse Diversity Genotyping Array, a high-density mouse genotyping array that captures the known genetic variations present in the laboratory mouse 48. SNPs with a minor allele frequency less than 3% were removed from the mapping studies. A total of 335,583 informative SNPs were used for the analysis. Each SNP was evaluated individually, and a P value was recorded as the strength of the genotype-phenotype association. All P values were transformed using −log10(P value) in the scan plots (score). In this study, we focused on associations with a P value less than 10−5. Annotation and information regarding probe performance can be obtained from the Center for Genome Dynamics website (http://cgd.jax.org//tools/diversityarray.shtml). We used one-way analysis of variance (ANOVA) to test for strain effect on each of the 7 traits. To determine how well the percentage of total or the proportion of CD4-expressing iNKT-cells in PB can reflect those in the spleen and thymus, we calculated Pearson correlation coefficient of these traits between PB and spleen or thymus. One-way ANOVA and Pearson correlation coefficient were performed using the Prism 5 software (GraphPad).
Acknowledgements
This work was supported by National Institutes of Health grants DK46266 and DK51090 (to D.V.S.) and DK077443 (to Y.-G.C.).
Footnotes
Conflict of interest The authors have no financial conflicts of interest.
References
- 1.Bendelac A, Savage PB, Teyton L. The biology of NKT cells. Annu Rev Immunol. 2007;25:297–336. doi: 10.1146/annurev.immunol.25.022106.141711. [DOI] [PubMed] [Google Scholar]
- 2.Coquet JM, Chakravarti S, Kyparissoudis K, McNab FW, Pitt LA, McKenzie BS, et al. Diverse cytokine production by NKT cell subsets and identification of an IL-17-producing CD4-NK1.1- NKT cell population. Proc Natl Acad Sci U S A. 2008;105(32):11287–92. doi: 10.1073/pnas.0801631105. [DOI] [PMC free article] [PubMed] [Google Scholar]
- 3.Michel ML, Keller AC, Paget C, Fujio M, Trottein F, Savage PB, et al. Identification of an IL-17-producing NK1.1(neg) iNKT cell population involved in airway neutrophilia. J Exp Med. 2007;204(5):995–1001. doi: 10.1084/jem.20061551. [DOI] [PMC free article] [PubMed] [Google Scholar]
- 4.Matsuda JL, Mallevaey T, Scott-Browne J, Gapin L. CD1d-restricted iNKT cells, the ‘Swiss-Army knife’ of the immune system. Curr Opin Immunol. 2008;20(3):358–68. doi: 10.1016/j.coi.2008.03.018. [DOI] [PMC free article] [PubMed] [Google Scholar]
- 5.Hegde S, Fox L, Wang X, Gumperz JE. Autoreactive natural killer T cells: promoting immune protection and immune tolerance through varied interactions with myeloid antigen-presenting cells. Immunology. 2010;130(4):471–83. doi: 10.1111/j.1365-2567.2010.03293.x. [DOI] [PMC free article] [PubMed] [Google Scholar]
- 6.Berzins SP, Smyth MJ, Baxter AG. Presumed guilty: natural killer T cell defects and human disease. Nat Rev Immunol. 2011;11(2):131–42. doi: 10.1038/nri2904. [DOI] [PubMed] [Google Scholar]
- 7.Wilson SB, Delovitch TL. Janus-like role of regulatory iNKT cells in autoimmune disease and tumour immunity. Nat Rev Immunol. 2003;3(3):211–22. doi: 10.1038/nri1028. [DOI] [PubMed] [Google Scholar]
- 8.Naumov YN, Bahjat KS, Gausling R, Abraham R, Exley MA, Koezuka Y, et al. Activation of CD1d-restricted T cells protects NOD mice from developing diabetes by regulating dendritic cell subsets. Proc Natl Acad Sci U S A. 2001;98(24):13838–43. doi: 10.1073/pnas.251531798. [DOI] [PMC free article] [PubMed] [Google Scholar]
- 9.Hong S, Wilson MT, Serizawa I, Wu L, Singh N, Naidenko OV, et al. The natural killer T-cell ligand alpha-galactosylceramide prevents autoimmune diabetes in non-obese diabetic mice. Nat Med. 2001;7(9):1052–6. doi: 10.1038/nm0901-1052. [DOI] [PubMed] [Google Scholar]
- 10.Sharif S, Arreaza GA, Zucker P, Mi QS, Sondhi J, Naidenko OV, et al. Activation of natural killer T cells by alpha-galactosylceramide treatment prevents the onset and recurrence of autoimmune Type 1 diabetes. Nat Med. 2001;7(9):1057–62. doi: 10.1038/nm0901-1057. [DOI] [PubMed] [Google Scholar]
- 11.Wang B, Geng YB, Wang CR. CD1-restricted NK T cells protect nonobese diabetic mice from developing diabetes. J Exp Med. 2001;194(3):313–20. doi: 10.1084/jem.194.3.313. [DOI] [PMC free article] [PubMed] [Google Scholar]
- 12.Shi FD, Flodstrom M, Balasa B, Kim SH, Van Gunst K, Strominger JL, et al. Germ line deletion of the CD1 locus exacerbates diabetes in the NOD mouse. Proc Natl Acad Sci U S A. 2001;98(12):6777–82. doi: 10.1073/pnas.121169698. [DOI] [PMC free article] [PubMed] [Google Scholar]
- 13.Lehuen A, Lantz O, Beaudoin L, Laloux V, Carnaud C, Bendelac A, et al. Overexpression of natural killer T cells protects Valpha14- Jalpha281 transgenic nonobese diabetic mice against diabetes. J Exp Med. 1998;188(10):1831–9. doi: 10.1084/jem.188.10.1831. [DOI] [PMC free article] [PubMed] [Google Scholar]
- 14.Hammond KJ, Poulton LD, Palmisano LJ, Silveira PA, Godfrey DI, Baxter AG. alpha/beta-T cell receptor (TCR)+CD4−CD8− (NKT) thymocytes prevent insulin-dependent diabetes mellitus in nonobese diabetic (NOD)/Lt mice by the influence of interleukin (IL)-4 and/or IL-10. J Exp Med. 1998;187(7):1047–56. doi: 10.1084/jem.187.7.1047. [DOI] [PMC free article] [PubMed] [Google Scholar]
- 15.Zekavat G, Mozaffari R, Arias VJ, Rostami SY, Badkerhanian A, Tenner AJ, et al. A novel CD93 polymorphism in non-obese diabetic (NOD) and NZB/W F1 mice is linked to a CD4+ iNKT cell deficient state. Immunogenetics. 2010;62(6):397–407. doi: 10.1007/s00251-010-0442-3. [DOI] [PMC free article] [PubMed] [Google Scholar]
- 16.Ueno A, Wang J, Cheng L, Im JS, Shi Y, Porcelli SA, et al. Enhanced early expansion and maturation of semi-invariant NK T cells inhibited autoimmune pathogenesis in congenic nonobese diabetic mice. J Immunol. 2008;181(10):6789–96. doi: 10.4049/jimmunol.181.10.6789. [DOI] [PubMed] [Google Scholar]
- 17.Fletcher JM, Jordan MA, Snelgrove SL, Slattery RM, Dufour FD, Kyparissoudis K, et al. Congenic analysis of the NKT cell control gene Nkt2 implicates the peroxisomal protein Pxmp4. J Immunol. 2008;181(5):3400–12. doi: 10.4049/jimmunol.181.5.3400. [DOI] [PubMed] [Google Scholar]
- 18.Chen YG, Driver JP, Silveira PA, Serreze DV. Subcongenic analysis of genetic basis for impaired development of invariant NKT cells in NOD mice. Immunogenetics. 2007;59(9):705–12. doi: 10.1007/s00251-007-0236-4. [DOI] [PubMed] [Google Scholar]
- 19.Matsuki N, Stanic AK, Embers ME, Van Kaer L, Morel L, Joyce S. Genetic dissection of V alpha 14J alpha 18 natural T cell number and function in autoimmune-prone mice. J Immunol. 2003;170(11):5429–37. doi: 10.4049/jimmunol.170.11.5429. [DOI] [PubMed] [Google Scholar]
- 20.Kukreja A, Cost G, Marker J, Zhang C, Sun Z, Lin-Su K, et al. Multiple immuno-regulatory defects in type-1 diabetes. J Clin Invest. 2002;109(1):131–40. doi: 10.1172/JCI13605. [DOI] [PMC free article] [PubMed] [Google Scholar]
- 21.Wilson SB, Kent SC, Patton KT, Orban T, Jackson RA, Exley M, et al. Extreme Th1 bias of invariant Valpha24JalphaQ T cells in type 1 diabetes. Nature. 1998;391(6663):177–81. doi: 10.1038/34419. [DOI] [PubMed] [Google Scholar]
- 22.Roman-Gonzalez A, Moreno ME, Alfaro JM, Uribe F, Latorre-Sierra G, Rugeles MT, et al. Frequency and function of circulating invariant NKT cells in autoimmune diabetes mellitus and thyroid diseases in Colombian patients. Hum Immunol. 2009;70(4):262–8. doi: 10.1016/j.humimm.2009.01.012. [DOI] [PubMed] [Google Scholar]
- 23.Lee PT, Putnam A, Benlagha K, Teyton L, Gottlieb PA, Bendelac A. Testing the NKT cell hypothesis of human IDDM pathogenesis. J Clin Invest. 2002;110(6):793–800. doi: 10.1172/JCI15832. [DOI] [PMC free article] [PubMed] [Google Scholar]
- 24.Montoya CJ, Pollard D, Martinson J, Kumari K, Wasserfall C, Mulder CB, et al. Characterization of human invariant natural killer T subsets in health and disease using a novel invariant natural killer T cell-clonotypic monoclonal antibody, 6B11. Immunology. 2007;122(1):1–14. doi: 10.1111/j.1365-2567.2007.02647.x. [DOI] [PMC free article] [PubMed] [Google Scholar]
- 25.Kis J, Engelmann P, Farkas K, Richman G, Eck S, Lolley J, et al. Reduced CD4+ subset and Th1 bias of the human iNKT cells in Type 1 diabetes mellitus. J Leukoc Biol. 2007;81(3):654–62. doi: 10.1189/jlb.1106654. [DOI] [PubMed] [Google Scholar]
- 26.Nakamura T, Sonoda KH, Faunce DE, Gumperz J, Yamamura T, Miyake S, et al. CD4+ NKT cells, but not conventional CD4+ T cells, are required to generate efferent CD8+ T regulatory cells following antigen inoculation in an immune-privileged site. J Immunol. 2003;171(3):1266–71. doi: 10.4049/jimmunol.171.3.1266. [DOI] [PubMed] [Google Scholar]
- 27.Roelofs-Haarhuis K, Wu X, Gleichmann E. Oral tolerance to nickel requires CD4+ invariant NKT cells for the infectious spread of tolerance and the induction of specific regulatory T cells. J Immunol. 2004;173(2):1043–50. doi: 10.4049/jimmunol.173.2.1043. [DOI] [PubMed] [Google Scholar]
- 28.Terabe M, Matsui S, Noben-Trauth N, Chen H, Watson C, Donaldson DD, et al. NKT cell-mediated repression of tumor immunosurveillance by IL-13 and the IL-4R-STAT6 pathway. Nat Immunol. 2000;1(6):515–20. doi: 10.1038/82771. [DOI] [PubMed] [Google Scholar]
- 29.Berzins SP, Cochrane AD, Pellicci DG, Smyth MJ, Godfrey DI. Limited correlation between human thymus and blood NKT cell content revealed by an ontogeny study of paired tissue samples. Eur J Immunol. 2005;35(5):1399–407. doi: 10.1002/eji.200425958. [DOI] [PubMed] [Google Scholar]
- 30.Berzins SP, Kyparissoudis K, Pellicci DG, Hammond KJ, Sidobre S, Baxter A, et al. Systemic NKT cell deficiency in NOD mice is not detected in peripheral blood: implications for human studies. Immunol Cell Biol. 2004;82(3):247–52. doi: 10.1046/j.1440-1711.2004.01238.x. [DOI] [PubMed] [Google Scholar]
- 31.Kent SC, Chen Y, Clemmings SM, Viglietta V, Kenyon NS, Ricordi C, et al. Loss of IL-4 secretion from human type 1a diabetic pancreatic draining lymph node NKT cells. J Immunol. 2005;175(7):4458–64. doi: 10.4049/jimmunol.175.7.4458. [DOI] [PubMed] [Google Scholar]
- 32.Chan AC, Serwecinska L, Cochrane A, Harrison LC, Godfrey DI, Berzins SP. Immune characterization of an individual with an exceptionally high natural killer T cell frequency and her immediate family. Clin Exp Immunol. 2009;156(2):238–45. doi: 10.1111/j.1365-2249.2009.03888.x. [DOI] [PMC free article] [PubMed] [Google Scholar]
- 33.Rymarchyk SL, Lowenstein H, Mayette J, Foster SR, Damby DE, Howe IW, et al. Widespread natural variation in murine natural killer T-cell number and function. Immunology. 2008;125(3):331–43. doi: 10.1111/j.1365-2567.2008.02846.x. [DOI] [PMC free article] [PubMed] [Google Scholar]
- 34.Godfrey DI, Berzins SP. Control points in NKT-cell development. Nat Rev Immunol. 2007;7(7):505–18. doi: 10.1038/nri2116. [DOI] [PubMed] [Google Scholar]
- 35.Godfrey DI, Stankovic S, Baxter AG. Raising the NKT cell family. Nat Immunol. 2010;11(3):197–206. doi: 10.1038/ni.1841. [DOI] [PubMed] [Google Scholar]
- 36.Chen YG, Chen J, Osborne MA, Chapman HD, Besra GS, Porcelli SA, et al. CD38 is required for the peripheral survival of immunotolerogenic CD4+ invariant NK T cells in nonobese diabetic mice. J Immunol. 2006;177(5):2939–47. doi: 10.4049/jimmunol.177.5.2939. [DOI] [PubMed] [Google Scholar]
- 37.Yang IV, Wade CM, Kang HM, Alper S, Rutledge H, Lackford B, et al. Identification of novel genes that mediate innate immunity using inbred mice. Genetics. 2009;183(4):1535–44. doi: 10.1534/genetics.109.107540. [DOI] [PMC free article] [PubMed] [Google Scholar]
- 38.Bennett BJ, Farber CR, Orozco L, Kang HM, Ghazalpour A, Siemers N, et al. A high-resolution association mapping panel for the dissection of complex traits in mice. Genome Res. 2010;20(2):281–90. doi: 10.1101/gr.099234.109. [DOI] [PMC free article] [PubMed] [Google Scholar]
- 39.Bopp SE, Ramachandran V, Henson K, Luzader A, Lindstrom M, Spooner M, et al. Genome wide analysis of inbred mouse lines identifies a locus containing Ppar-gamma as contributing to enhanced malaria survival. PLoS One. 2010;5(5):e10903. doi: 10.1371/journal.pone.0010903. [DOI] [PMC free article] [PubMed] [Google Scholar]
- 40.Zimmer MI, Nguyen HP, Wang B, Xu H, Colmone A, Felio K, et al. Polymorphisms in CD1d affect antigen presentation and the activation of CD1d-restricted T cells. Proc Natl Acad Sci U S A. 2009;106(6):1909–14. doi: 10.1073/pnas.0808476106. [DOI] [PMC free article] [PubMed] [Google Scholar]
- 41.Fedeli M, Napolitano A, Wong MP, Marcais A, de Lalla C, Colucci F, et al. Dicer-dependent microRNA pathway controls invariant NKT cell development. J Immunol. 2009;183(4):2506–12. doi: 10.4049/jimmunol.0901361. [DOI] [PubMed] [Google Scholar]
- 42.Zhou L, Seo KH, He HZ, Pacholczyk R, Meng DM, Li CG, et al. Tie2cre-induced inactivation of the miRNA-processing enzyme Dicer disrupts invariant NKT cell development. Proc Natl Acad Sci U S A. 2009;106(25):10266–71. doi: 10.1073/pnas.0811119106. [DOI] [PMC free article] [PubMed] [Google Scholar]
- 43.Esteban LM, Tsoutsman T, Jordan MA, Roach D, Poulton LD, Brooks A, et al. Genetic control of NKT cell numbers maps to major diabetes and lupus loci. J Immunol. 2003;171(6):2873–8. doi: 10.4049/jimmunol.171.6.2873. [DOI] [PubMed] [Google Scholar]
- 44.Jordan MA, Fletcher JM, Jose R, Chowdhury S, Gerlach N, Allison J, et al. Role of SLAM in NKT Cell Development Revealed by Transgenic Complementation in NOD Mice. J Immunol. 2011;186(7):3953–65. doi: 10.4049/jimmunol.1003305. [DOI] [PubMed] [Google Scholar]
- 45.Jordan MA, Fletcher JM, Pellicci D, Baxter AG. Slamf1, the NKT cell control gene Nkt1. J Immunol. 2007;178(3):1618–27. doi: 10.4049/jimmunol.178.3.1618. [DOI] [PubMed] [Google Scholar]
- 46.Griewank K, Borowski C, Rietdijk S, Wang N, Julien A, Wei DG, et al. Homotypic interactions mediated by Slamf1 and Slamf6 receptors control NKT cell lineage development. Immunity. 2007;27(5):751–62. doi: 10.1016/j.immuni.2007.08.020. [DOI] [PMC free article] [PubMed] [Google Scholar]
- 47.Kang HM, Zaitlen NA, Wade CM, Kirby A, Heckerman D, Daly MJ, et al. Efficient control of population structure in model organism association mapping. Genetics. 2008;178(3):1709–23. doi: 10.1534/genetics.107.080101. [DOI] [PMC free article] [PubMed] [Google Scholar]
- 48.Yang H, Ding Y, Hutchins LN, Szatkiewicz J, Bell TA, Paigen BJ, et al. A customized and versatile high-density genotyping array for the mouse. Nat Methods. 2009;6(9):663–6. doi: 10.1038/nmeth.1359. [DOI] [PMC free article] [PubMed] [Google Scholar]