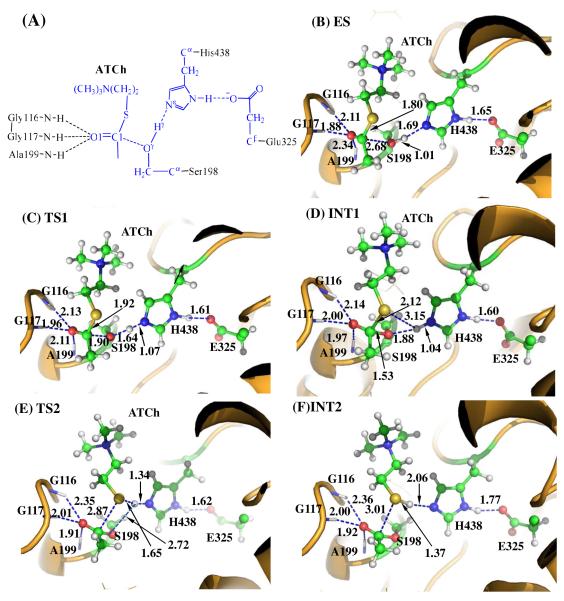
Figure 1.
Key states for the acylation reaction stage of BChE-catalyzed ATCh hydrolysis. The geometries were optimized at the QM/MM(B3LYP/6-31+G*:AMBER) level. The key distances in the figure are in Å. Carbon, oxygen, nitrogen, sulfur, and hydrogen atoms are colored in green, red, blue, yellow, and white, respectively. The backbone of the protein is rendered in orange. The QM atoms are represented as balls and sticks and the surrounding residues are rendered as sticks or lines. The figures below are represented using the same method.

