

Abstract
Goals
To define the influence of nonalcoholic fatty liver disease (NAFLD) and its associated comorbidities on liver transplant outcomes.
Background
NAFLD cirrhosis is an increasing indication for transplant. The transplant outcomes of NAFLD patients with metabolic syndrome comorbidities remain unclear.
Study
We examined a single center, retrospective cohort between 2004 and 2007 to determine transplant mortality for NAFLD and non-NAFLD patients accounting for the possible independent effects of diabetes, hypertension, obesity, and hyperlipidemia. The primary outcomes were 30-day, 1-year, and 3-year all-cause mortality. Cox proportional hazard ratios were determined controlling for various recipient and donor covariates.
Results
In our study, of 118 liver transplants, 18% were performed for NAFLD cirrhosis. Adjusted hazard ratios for death for NAFLD compared with non-NAFLD patients at 30 days, 1 year, and 3 years were 8.96 (1.06, 75.8), 1.49 (0.38, 5.81), and 1.05 (0.29, 3.78), respectively. Compared with nondiabetic patients, diabetic patients had hazard ratios at 30 days, 1 year, and 3 years of 2.02 (0.31, 12.9), 2.82 (0.94, 8.47), 3.58 (1.32, 9.71), respectively. Obesity, hypertension, and hyperlipidemia did not have a significant impact on posttransplant mortality.
Conclusions
We conclude that NAFLD increases 30-day transplant mortality whereas diabetes increases 3-year mortality. Future work should determine the strategies to decrease perioperative mortality among NAFLD patients and ways to improve long-term transplant survival among diabetics.
Keywords: NAFLD, NASH, liver transplant, outcomes, diabetes
The increasing number of nonalcoholic fatty liver disease (NAFLD) patients with liver failure may alter the practice and outcomes of liver transplant over the next 20 years during which NAFLD may become the leading indication for liver transplant.1 There are limited published data to document the postoperative course of patients transplanted for NAFLD. Malik et al,2 suggest an early increase in mortality among NAFLD patients, but longer term survival was similar to patients undergoing transplant for other indications. Other data and opinions on the impact of NAFLD are mixed.3,4 Historically, many cases of NAFLD cirrhosis may have been labeled as cryptogenic cirrhosis, and survival data for this entity are mixed as well.5,6
Comorbidities such as obesity, diabetes, and cardiovascular disease that are associated with NAFLD likely confer independent risk of poor outcome after transplant and confuse the issue of increased posttransplant mortality attributed to NAFLD. Some studies have demonstrated a detrimental impact of diabetes and coronary artery disease (CAD) on liver transplant outcomes, while the risk imposed by hypertension is equivocal.7,8 Morbid obesity [body mass index (BMI) ≥ 35] is associated with increased operative risk.9 However, the impact of these risks on posttransplant NAFLD patients is unknown.
We sought to determine whether NAFLD conveyed an increased risk of posttransplant mortality independent of the risk factors commonly associated with NAFLD patients, specifically obesity, diabetes, hypertension, and hyperlipidemia. We also examined graft loss between NAFLD and non-NAFLD patients, as we wondered whether NAFLD patients may have more atherosclerotic disease in the hepatic or celiac artery putting them at higher risk for thrombosis or stenosis.
METHODS
We performed a single center, retrospective cohort study. Consecutive adult (age ≥ 18) liver transplants performed at the University of North Carolina (UNC) Hospitals between March 27, 2004 and December 31, 2007 were identified via UNC’s transplant database, TransChart (TransChart, LLC, Dublin, OH). Retransplants were excluded. Further data were obtained via the United Network of Organ Sharing database and from electronic patient medical records where appropriate. Data collection was performed after approval from the UNC Institutional Review Board.
NAFLD was defined as biopsy proven NAFLD/nonalcoholic steatohepatitis (NASH) or cryptogenic cirrhosis plus at least 2 components of the metabolic syndrome (BMI >30, hypertension, diabetes, or hyperlipidemia; Fig. 1). Hypertension was defined as systolic blood pressure >140mm Hg or diastolic blood pressure >90mm Hg or taking an antihypertensive medication (excluding a non-selective β blocker). Diabetes was defined as random blood sugar >200 or using oral diabetic medication or insulin injections. Hyperlipidemia was defined as total cholesterol greater than 200, LDL cholesterol greater than 160 or taking a cholesterol lowering medication. CAD was defined as a documented history of CAD or a left heart catheterization with at least 1 lesion obstructing >50% of an epicardial blood vessel. Obesity was defined as BMI>30. BMI was treated as both a continuous variable and a categorical variable. All definitions were applied before transplant. Data on the presence of hepatocellular carcinoma (HCC) were collected as well.
FIGURE 1.

Selection of the NAFLD cohort. Risk factors for a clinical diagnosis of NAFLD defined as hypertension, hyperlipidemia, diabetes, and obesity. NAFLD indicates nonalcoholic fatty liver disease.
Bivariate analysis was used to compare patients with and without NAFLD and patients with and without diabetes, hypertension, hyperlipidemia, and obesity. χ2 tests were used for categorical variables and Student T test was used for continuous variables where appropriate.
Kaplan-Meier survival analysis was performed censoring patients at the time of death, time of graft failure, or end of study period to determine 30-day, 1-year, and 3-year patient and graft survivals. Multivariate analysis with Cox proportional hazards modeling was used to calculate hazard ratios adjusted for potential confounding factors. These included recipient race, sex, age, comorbidities, MELD score, warm and cold ischemia time, donor age, donation after cardiac death, and donor sex, after excluding interaction terms and colinearity among variables. Donor risk indices were determined as described by Feng et al.10 The main outcome was all-cause mortality. Results of the bivariate analyses were used to select candidate variables for the model. The model was reduced using a backwards elimination strategy, a priori retaining variables that were significant at a P<0.10 level or those thought to be clinically important. Patients with missing data were excluded from bivariate and multivariate analyses. All statistical analyses were performed with Stata version 9 (Statacorp, College Station, TX).
RESULTS
Study Population Characteristics
After excluding retransplants and patients under the age of 18, 118 transplants met the criteria for inclusion during the study time frame (Table 1). The mean age at transplant was 53±8.3; 70% of the population was male and 74% was white. NAFLD was the indication for 21 (18%) transplants. Among the patients without NAFLD, 25 (21%) had hepatitis C (HCV), another 16 (14%) had cirrhosis due to HCV and alcohol, 15 (13%) had cirrhosis due to alcohol alone, 8 (7%) were transplanted for hepatitis B, and 33 (28%) were transplanted for other indications including primary biliary cirrhosis, primary sclerosing cholangitis, and autoimmune hepatitis. The mean MELD score at transplant was 23.6±6.2. Thirty-three patients (28%) had diabetes. The majority of the donor population (61%) was female; the mean donor age was 36.2±15.3. The mean Donor Risk Index (DRI) was 1.333±0.309. Mean cold ischemia time was 420±117 minutes. Mean and median times to discharge after transplant were 23 and 13 days, respectively. These times were not significantly different between NAFLD and non-NAFLD patients (mean 20.9 vs. 23.5, respectively, P=0.669; median 13 for both, P=0.792). Posttransplant survival was 95% at 30 days, 87% at 1 year, and 82% at 3 years.
TABLE 1.
Characteristics of the Study Population
| Recipient characteristics | |
| Transplants, total | 118 |
| Mean age at transplant | 53.1±8.3 |
| n (%) male | 83 (70) |
| n (%) white | 87 (74) |
| Indications for transplant, n (%) | |
| NAFLD | 21 (18) |
| Non-NAFLD | 97 (82) |
| MELD at transplant | 23.6±6.2 |
| n with diabetes (%) | 33 (28) |
| n with hypertension (%) | 34 (29) |
| n with hyperlipidemia (%) | 15 (13) |
| n with coronary artery disease (%) | 5 (4) |
| n with hepatocellular carcinoma (%) | 31 (26) |
| Mean serum sodium | 136±5.3 |
| Mean creatinine | 1.47±1.0 |
| Mean body mass index | 28.8±4.6 |
| Donor characteristics | |
| Male donors, n (%) | 43 (39) |
| Donor age | 36.2±15.3 |
| Donor type, n (%) | |
| Deceased donor | 107 (91) |
| DCD | 10 (9) |
| Donor cause of death, n (%) | |
| Anoxia | 9 (9) |
| CVA | 41 (38) |
| Trauma | 56 (52) |
| Donor Risk Index | 1.333±0.309 |
| Operative characteristics | |
| Warm ischemia time, min | 40.5±11.2 |
| Cold ischemia time, min | 420±117 |
| Retransplants required, n (%) | 13 (11) |
| Survival | |
| Overall graft survival (%) | |
| 30 d | 92.4 |
| 1 y | 82.1 |
| 3 y | 74.3 |
| Overall patient survival (%) | |
| 30 d | 94.9 |
| 1 y | 87.1 |
| 3 y | 82.3 |
NAFLD indicates nonalcoholic fatty liver disease.
NAFLD and Effect on Survival
Bivariate analysis of the NAFLD and non-NAFLD populations is shown in Table 2; NAFLD patients were significantly older (57.9 y vs. 52.1 y, P=0.003), and had worse pretransplant renal function (serum creatinine 1.9 vs. 1.4, P=0.022). As would be expected by our definition of NAFLD cases, diabetes (62% vs. 21%, P<0.001) and hyperlipidemia (33% vs. 8%, P=0.002) were more prevalent compared with non-NAFLD patients. Hypertension and BMI were also more prevalent in the NAFLD cohort but the difference did not reach statistical significance. There were no differences in the donor or operative characteristics between these populations. Mean DRI for the NAFLD and non-NAFLD groups were 1.28 and 1.35, respectively, P=0.42.
TABLE 2.
Bivariate Analysis of Patients With and Without Nonalcoholic Fatty Liver Disease
| NAFLD (n=21) | Non-NAFLD (n=97) | P | |
|---|---|---|---|
| Recipient characteristics | |||
| Mean age at transplant, years | 57.9±6.2 | 52.1±8.3 | 0.003 |
| n (%) male | 12 (57) | 71 (73) | 0.144 |
| n (%) white | 17 (81) | 70 (72) | 0.407 |
| MELD | 23.4±6.8 | 23.6±6.15 | 0.881 |
| n with diabetes (%) | 13 (62) | 20 (21) | <0.001 |
| n with hypertension (%) | 9 (43) | 25 (26) | 0.117 |
| n with hyperlipidemia (%) | 7 (33) | 8 (8) | 0.002 |
| n with coronary artery disease (%) | 1 (5) | 4 (4) | 0.895 |
| n with hepatocellular carcinoma (%) | 4 (19) | 27 (28) | 0.407 |
| Mean body mass index | 30.2±4.2 | 28.6±4.7 | 0.156 |
| Mean serum sodium | 135±4 | 136±6 | 0.366 |
| Mean creatinine | 1.9±1.1 | 1.4±1.0 | 0.022 |
| Donor characteristics | |||
| Male donors, n (%) | 9 (47) | 34 (38) | 0.437 |
| Donor age | 35.4±15.3 | 36.4±15.4 | 0.798 |
| Donor type | |||
| Deceased donor | 19 (90) | 88 (92) | |
| DCD | 2 (10) | 8 (8) | 0.709 |
| Donor cause of death, n (%) | |||
| Anoxia | 0 (0) | 9 (11) | |
| CVA | 5 (26) | 36 (41) | |
| Trauma | 14 (74) | 42 (47) | 0.122 |
| Donor Risk Index | 1.280±0.396 | 1.345±0.288 | 0.417 |
| Operative characteristics | |||
| Warm ischemia time, min | 39.4±7.4 | 40.8±11.9 | 0.602 |
| Cold ischemia time, min | 414±111 | 422±119 | 0.774 |
| Required retransplant, n (%) | 3 (14) | 10 (10) | 0.598 |
| Days to discharge posttransplant | 20.9±18.6 | 23.5±24 | 0.669 |
| Survival | |||
| Graft survival, % | |||
| 30 d | 80.9 | 94.9 | 0.0266 |
| 1 y | 76.2 | 83.4 | 0.3285 |
| 3 y | 76.2 | 73.2 | 0.7761 |
| Patient survival, % | |||
| 30 d | 80.9 | 97.0 | 0.0014 |
| 1 y | 76.2 | 89.5 | 0.0632 |
| 3 y | 76.2 | 83.5 | 0.2352 |
| Patient cause of death, n (%) | |||
| Graft failure/1 liver disease* | 0 (0) | 2 (14) | |
| Infection/sepsis | 1 (20) | 1 (7) | |
| Cardiac | 1 (20) | 3 (21) | |
| Biliary complication | 0 (0) | 3 (21) | 0.577 |
| Other | 3 (60)* | 5 (36)† | |
Hepatic artery thrombosis ×2, multisystem organ failure.
Hepatocellular carcinoma, neuroendocrine tumor, graft versus host disease, trauma, multisystem organ failure.
NAFLD indicates nonalcoholic fatty liver disease.
The Kaplan-Meier survival curve for NAFLD and non-NAFLD patients is shown in Figure 2. Thirty-day survival for the NAFLD population was significantly worse compared with the same for non-NAFLD population (81% vs. 97%, P=0.001). Of the 4 NAFLD patients dying within 30 days, 2 died of hepatic artery thrombosis, 1 died of cardiac complications, and 1 died of multisystem organ failure. Of the 2 non-NAFLD patient dying within 30 days, 1 died of sepsis and 1 died of cardiac complications. One-year and 3-year survival for NAFLD patients was worse as well (76% vs. 90%, P=0.063 at 1 year, 76% vs. 84%, P=0.235 at 3 years). Graft survival followed a similar trend (Table 2). When survival among the non-NAFLD cohort was evaluated by etiology of disease, patients transplanted for hepatitis B had 100% 30-day survival, 88% 1-year survival, and 70% 3-year survival. Patients with HCV had 96%, 92%, and 87% 30-day, 1-year, and 3-year survival, respectively. HCV plus alcohol survival had 100%, 94%, and 80%; alcohol alone had 100%, 87%, and 87%; other indications for transplant had 97%, 87%, and 83% survival at 30 days, 1 year, and 3 years, respectively. There were no differences in causes of death between NAFLD and non-NAFLD patients.
FIGURE 2.

Kaplan-Meier survival curves for patients with and without NAFLD. Unadjusted P values for log-rank Kaplan-Meier curve censored at day 30 (P = 0.001), day 365 (P = 0.063), and day 1095 (P = 0.235). NAFLD indicates nonalcoholic fatty liver disease.
Unadjusted Cox proportional hazard modeling showed NAFLD patients had a 9.59 (P=0.009), 2.66 (P=0.074), and 1.84 (P=0.243) hazard of death at 30 days, 1 year, and 3 years, respectively compared with non-NAFLD patients. A fully adjusted model was created, adjusting for age, race, sex, diabetes, hypertension, hyperlipidemia, CAD, BMI, MELD score, HCC, and the components of DRI. This model was then reduced to adjust for diabetes, cold ischemia time, MELD score, and donor cause of death. The final, reduced model showed NAFLD patients had 8.96 (P=0.04), 1.49 (P=0.56), and 1.05 (P=0.94) hazard of death at 30 days, 1 year, and 3 years, respectively for NAFLD patients compared with non-NAFLD patients. The final, reduced model was unchanged from the fully adjusted model (Table 4). Using the individual components of MELD did not significantly change the model.
TABLE 4.
Adjusted Hazard Ratios for Graft Failure and Death
| Hazard Ratio (95% Confidence Interval)
|
||
|---|---|---|
| Graft Failure | Death | |
| Risk of graft failure and death, reduced model* | ||
| NAFLD | ||
| 30 d | 8.96 (1.06, 75.8) | 8.96 (1.06, 75.8) |
| 1 y | 1.49 (0.38, 5.81) | 1.49 (0.38, 5.81) |
| 3 y | 0.94 (0.27, 3.27) | 1.05 (0.29, 3.78) |
| Diabetes | ||
| 30 d | 2.02 (0.31, 12.9) | 2.02 (0.31, 12.9) |
| 1 y | 2.82 (0.94, 8.47) | 2.82 (0.94, 8.47) |
| 3 y | 2.51 (0.99, 6.37) | 3.58 (1.32, 9.71) |
Diabetes reduced model adjusted for cold ischemia time, donor cause of death, and MELD score.
The NAFLD reduced model was adjusted for diabetes, cold ischemia time, donor cause of death, and MELD score.
NAFLD indicates nonalcoholic fatty liver disease.
Diabetes and Effect on Survival
Bivariate analysis of the diabetic and nondiabetic populations is shown in Table 3 and demonstrated that the diabetic patients were significantly older (56.5 y vs. 51.8 y, P=0.005), more likely to have hypertension (46% vs. 22%, P=0.013), and more likely to have HCC (42% vs. 20%, P=0.003). There were no differences in the donor or operative characteristics between these populations. Mean DRI for the diabetic and nondiabetic groups were 1.27 and 1.35, respectively, P=0.21.
TABLE 3.
Bivariate Analysis of Patients With and Without Diabetes
| Diabetes (n=33) | No Diabetes (n=85) | P | |
|---|---|---|---|
| Recipient characteristics | |||
| Mean age at transplant | 56.5±8.8 | 51.8±5.5 | 0.005 |
| n (%) male | 23 (69.7) | 60 (70.6) | 0.92 |
| n (%) white | 28 (84.9) | 59 (69.4) | 0.09 |
| MELD | 22.3±5.3 | 24.1±6.5 | 0.16 |
| n with hypertension (%) | 15 (45.5) | 19 (22.3) | 0.013 |
| n with hyperlipidemia (%) | 7 (21.2) | 8 (9.4) | 0.08 |
| n with coronary artery disease (%) | 1 (3.0) | 4 (4.7) | 0.69 |
| n with hepatocellular carcinoma (%) | 14 (42.4) | 17 (20) | 0.013 |
| Mean body mass index | 30.9±4.2 | 28.1±4.6 | 0.0036 |
| Mean serum sodium | 136±4.9 | 136±5.5 | 0.91 |
| Mean creatinine | 1.4±0.8 | 1.5±1.1 | 0.65 |
| Donor characteristics | |||
| Male donors, n (%) | 10 (33.3) | 33 (41.8) | 0.42 |
| Donor age | 36.8±14.2 | 36.0±15.8 | 0.81 |
| Donor type | |||
| Deceased donor | 29 (89) | 78 (92) | 0.27 |
| DCD | 3 (10) | 7 (8) | |
| Donor cause of death, n (%) | |||
| Anoxia | 2 (7) | 7 (9) | 0.45 |
| CVA | 8 (28) | 33 (42) | |
| Trauma | 19 (64) | 37 (47) | |
| Donor Risk Index | 1.27±0.35 | 1.35±0.29 | 0.21 |
| Operative characteristics | |||
| Warm ischemia time, min | 39.7±6.1 | 40.9±12.6 | 0.60 |
| Cold ischemia time, min | 404±125 | 426±115 | 0.37 |
| Required retransplant, n (%) | 2 (6.1) | 11 (12.9) | 0.28 |
| Survival | |||
| Graft survival, % | |||
| 30 d | 90.9 | 92.9 | 0.7183 |
| 1 y | 78.2 | 83.5 | 0.5335 |
| 3 y | 56.3 | 80.4 | 0.0632 |
| Patient survival, % | |||
| 30 d | 90.1 | 96.5 | 0.2319 |
| 1 y | 78.2 | 90.4 | 0.0765 |
| 3 y | 63.3 | 88.9 | 0.0063 |
| Patient cause of death, n (%) | |||
| Graft failure/1 liver disease* | 2 (20) | 0 (0) | |
| Infection/sepsis | 2 (20) | 0 (0) | |
| Cardiac | 1 (10) | 3 (33) | 0.26 |
| Biliary complication | 1 (10) | 2 (22) | |
| Other | 4 (40)* | 4 (44)† | |
Hepatic artery thrombosis, multisystem organ failure, trauma, neuroendocrine tumor.
Hepatic artery thrombosis, hepatocellular carcinoma, graft versus host disease, multisystem organ failure.
The Kaplan-Meier survival curve for diabetic and nondiabetic patients is shown in Figure 3. Thirty-day and 1-year survival for the diabetic population was worse compared with the nondiabetic population (90% vs. 97%, P=0.232 at 30 d and 78% vs. 90%, P=0.077 at 1 y). Three-year survival for diabetic patients was significantly worse (63% vs. 89%, P=0.006). Graft survival followed a similar trend (Table 3). There were no significant differences in causes of death between diabetic and nondiabetic patients, although there were 2 deaths due to sepsis in the diabetic group versus none in the nondiabetic group.
FIGURE 3.
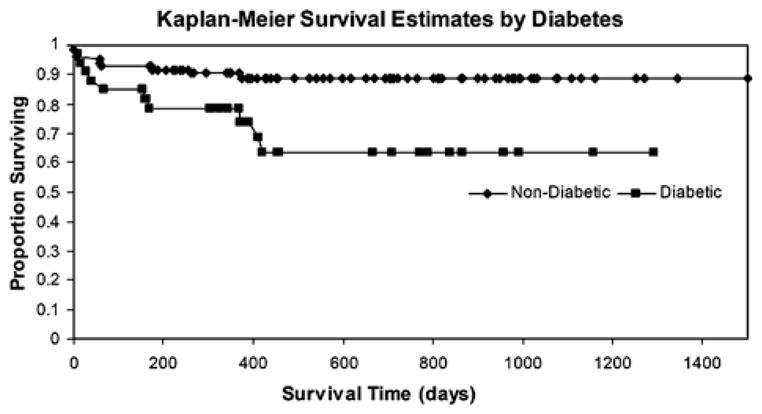
Kaplan-Meier survival curves for patients with and without diabetes. Unadjusted P values for log-rank Kaplan-Meier curve censored at day 30 (P=0.232), day 365 (P=0.076), and day 1095 (P=0.006).
Unadjusted Cox proportional hazard modeling showed diabetic patients had 2.56 (P=0.25), 2.43 (P=0.087), and 3.28 (P=0.010) hazard of death at 30 days, 1 year, and 3 years compared with nondiabetic patients. A fully adjusted model was created, adjusting for age, race, sex, NAFLD, HCV, hypertension, hyperlipidemia, CAD, BMI, MELD score, HCC, and the components of the DRI. This model was then reduced to adjust for cold ischemia time, MELD score, and donor cause of death. The final, reduced model showed diabetic patients had 2.02 (P=0.46), 2.82 (P=0.06), and 3.58 (P=0.01) hazard of death at 30 days, 1 year, and 3 years compared with nondiabetic patients. The final, reduced model was unchanged from the fully adjusted model (Table 4).
Hypertension, Hyperlipidemia, Obesity, CAD, and Effect on Survival
Within the study population, 29% had hypertension, 13% had hyperlipidemia, and 42% had a BMI of 30 or greater. These risk factors did not have a significant impact on posttransplant mortality. Only 5 patients were transplanted with documented CAD. All these 5 patients had at least 1 epicardial coronary vessel with a ≥50% lesion; however, none received a percutaneous coronary intervention or coronary artery bypass grafting before transplant. Cox modeling demonstrated increased hazard for death in patients with CAD at 30 days, 1 year, and 3 years, but the trend did not meet statistical significance.
DISCUSSION
NAFLD cirrhosis is a rapidly increasing indication for transplant. The posttransplant outcomes of NAFLD patients with metabolic syndrome comorbidities remain unclear. We sought to compare posttransplant mortality between NAFLD and non-NAFLD patients, and to determine the independent effects of diabetes, hypertension, obesity, and hyperlipidemia on posttransplant survival. We also examined graft survival between groups hypothesizing that NAFLD patients may have more atherosclerotic disease of the hepatic and celiac arteries putting them at increased risk of thrombosis or stenosis.
The main findings from this study are that NAFLD confers an independent risk of early mortality in the first 30 days after liver transplant. Diabetes mellitus is an independent risk factor for longer term posttransplant mortality. Hypertension, hyperlipidemia, and a BMI>30 do not independently contribute to posttransplant mortality. CAD likely confers an independent risk for posttransplant mortality, even in our highly selected population; however, the number of patients with CAD was too small to draw a firm conclusion.
The reasons for an increased 30-day mortality associated with NAFLD patients are difficult to discern as the absolute number of deaths in our NALFD cohort was small. None of the deaths within the study were attributed to intraoperative technical problems. There was 1 intraoperative cardiac arrest in the non-NAFLD cohort. The causes of death within the first 30 days in the NAFLD cohort included cardiac complications, hepatic artery thrombosis, and multisystem organ failure. Each of these etiologies may be linked to unrecognized atherosclerotic disease, either in the coronary arteries or in the peripheral circulation; a plausible explanation as NAFLD has been linked both independently and as an epiphenomenon to atherosclerotic disease11,12 Our medical chart review was unable to define cardiac disease as the only factor in this 30-day window of increased mortality risk, however. Likewise, interaction between NAFLD comorbidities (diabetes, obesity, hypertension, and hyperlipidemia) did not explain the increased mortality risk. Therefore, the reason for NAFLD to be associated with early posttransplant mortality, independent of typical comorbidities considered, remains unclear.
Only 1 other study has examined posttransplant outcomes specifically in NAFLD patients (2). Malik et al found a tendency for increased 30-day mortality and identified a subgroup of NAFLD patients that had increased overall mortality. Most of the deaths were within the first 50 days posttransplant similar to our overall cohort of NAFLD patients. They used a case-control design, histologic diagnosis of NAFLD only, and did not provide a multivariate analysis. Compared with PBC/PSC and HCV controls, NAFLD patients received livers from significantly older donors by 5.2 and 6.9 years, respectively. This difference could have contributed to the earlier deaths. Our study defined NAFLD based on broader clinical parameters and had the advantage of a cohort design with multivariate analysis. No differences in donor age or DRI were seen between the cohorts in our study.
The NAFLD cohort in our study consisted of patients with biopsy proven NASH and patients with cryptogenic cirrhosis plus at least 2 risk factors of the metabolic syndrome. Previous studies have documented high rates of diabetes and obesity among patients with cryptogenic cirrhosis and NASH.13,14 Other studies have concluded that many patients previously labeled as having cryptogenic cirrhosis probably had NAFLD cirrhosis based on clinical parameters.15 Therefore, we chose to use a clinical diagnosis of NAFLD cirrhosis in addition to a strict histologic one. In practice, histologic diagnosis of NAFD cirrhosis is difficult due to loss of fat as fibrosis progresses. We felt that a more inclusive NAFLD diagnosis would be more useful and relevant to clinical practice.
The classification of NAFLD patients was verified by chart review of all included patients; those found to have other diagnoses (sarcoidosis n=1, and methotrexate toxicity n=2) were excluded. None of the patients in our NAFLD cohort had serologic, genetic, or biochemical markers consistent with genetic disorders of the liver, viral hepatitis, or autoimmune hepatitis. None were thought to have had surreptitious alcohol use after extensive evaluation by out transplant psychologists who are employed solely by our transplant division and devote nearly 100% of their time to pretransplant evaluations. All explants are reviewed jointly by the liver histopathologists and clinical team in conference to check for potential missed diagnoses. Any such missed diagnoses are then immediately corrected in our transplant database. Although protocol biopsies were not performed after transplant, 9 of the 21 NAFLD patients underwent a liver biopsy for the indication of suspected rejection. All of these biopsies occurred between 3 months and 1 year posttransplant. Of the 9, 3 (33%) showed recurrence of NASH.
Diabetic patients had lower survival at each time point after liver transplant coming close to statistical significance at 1 year (HR 2.82, P=0.06) and reaching significance at 3 years (3.58, P=0.01). A nearly identical trend was seen for graft failure (Table 4). These poorer outcomes for diabetic patients have been previously reported.7,8,16 However, 2 of the prior studies did not account for any donor variables, whereas the third accounted for donor age and cold ischemia time only.7 All 3 studies were done in the pre- MELD era. Our study suggests that the effect of diabetes on posttransplant survival is independent of donor characteristics and persists in the MELD era.
Overall, there was no significant difference among causes of death between patients with and without diabetes; however, 2 patients with diabetes died of infectious complications versus none of the patients without diabetes. The persistently lower survival of patients with diabetes over time is not surprising considering the adverse effects of immunosuppressive regimens on the metabolic syndrome.17 Moreover, the presence of the metabolic syndrome has been independently linked to posttransplant fibrosis progression among HCV patients at more than 1-year posttransplant.18 This effect may hold true for non-HCV patients as well.
In summary, NAFLD is associated with early (30 d) posttransplant mortality while diabetes is an independent risk for longer term (3 y) mortality. Together, pretransplant diabetes and NAFLD have the potential to significantly erode posttransplant outcomes over the next decade as the proportion of NAFLD patients with advanced liver disease increases, thus adding support to Forman’s labeling the metabolic syndrome as the “the elephant in the room.”19 Future work must determine precise reasons and preventive measures for early mortality among NAFLD patients and later deaths in diabetics.
Acknowledgments
Supported, in part, by grants from the National Institutes of Health T32 DK07634 and P30 DK034987.
Footnotes
Conflicts of Interest: None.
References
- 1.Charlton M. Cirrhosis and liver failure in nonalcoholic fatty liver disease: molehill or mountain? Hepatology. 2008;47:1431–1433. doi: 10.1002/hep.22246. [DOI] [PMC free article] [PubMed] [Google Scholar]
- 2.Malik SM, deVera ME, Fontes P, et al. Outcome after liver transplantation for NASH cirrhosis. Am J Transplant. 2009;9:782–793. doi: 10.1111/j.1600-6143.2009.02590.x. [DOI] [PubMed] [Google Scholar]
- 3.Contos MJ, Cales W, Sterling RK, et al. Development of nonalcoholic fatty liver disease after orthotopic liver transplantation for cryptogenic cirrhosis. Liver Transpl. 2001;7:363–373. doi: 10.1053/jlts.2001.23011. [DOI] [PubMed] [Google Scholar]
- 4.Burke A, Lucey MR. Non-alcoholic fatty liver disease, nonalcoholic steatohepatitis and orthotopic liver transplantation. Am J Transplant. 2004;4:686–693. doi: 10.1111/j.1600-6143.2004.00432.x. [DOI] [PubMed] [Google Scholar]
- 5.Heneghan MA, Zolfino T, Muiesan P, et al. An evaluation of long-term outcomes after liver transplantation for cryptogenic cirrhosis. Liver Transpl. 2003;9:921–928. doi: 10.1053/jlts.2003.50165. [DOI] [PubMed] [Google Scholar]
- 6.Charlton MR, Kondo M, Roberts SK, et al. Liver transplantation for cryptogenic cirrhosis. Liver Transpl Surg. 1997;3:359–364. doi: 10.1002/lt.500030402. [DOI] [PubMed] [Google Scholar]
- 7.Yoo HY, Thuluvath PJ. The effect of insulin-dependent diabetes mellitus on outcome of liver transplantation. Transplantation. 2002;74:1007–1012. doi: 10.1097/00007890-200210150-00019. [DOI] [PubMed] [Google Scholar]
- 8.Shields PL, Tang H, Neuberger JM, et al. Poor outcome in patients with diabetes mellitus undergoing liver transplantation. Transplantation. 1999;68:530–535. doi: 10.1097/00007890-199908270-00015. [DOI] [PubMed] [Google Scholar]
- 9.Nair S, Verma S, Thuluvath PJ. Obesity and its effect on survival in patients undergoing orthotopic liver transplantation in the United States. Hepatology. 2002;35:105–109. doi: 10.1053/jhep.2002.30318. [DOI] [PubMed] [Google Scholar]
- 10.Feng S, Goodrich NP, Bragg-Gresham JL, et al. Characteristics associated with liver graft failure: the concept of a donor risk index. Am J Transplant. 2006;6:783–790. doi: 10.1111/j.1600-6143.2006.01242.x. [DOI] [PubMed] [Google Scholar]
- 11.Choi SY, Kim D, Kim HJ, et al. The relation between nonalcoholic fatty liver disease and the risk of coronary heart disease in Koreans. Am J Gastroenterol. 2009;104:1953–1960. doi: 10.1038/ajg.2009.238. [DOI] [PubMed] [Google Scholar]
- 12.McKimmie RL, Daniel KR, Carr JJ, et al. Hepatic steatosis and subclinical cardiovascular disease in a cohort enriched for type 2 diabetes: the Diabetes Heart Study. Am J Gastroenterol. 2008;103:3029–3035. doi: 10.1111/j.1572-0241.2008.02188.x. [DOI] [PMC free article] [PubMed] [Google Scholar]
- 13.Caldwell SH, Oelsner DH, Iezzoni JC, et al. Cryptogenic cirrhosis: clinical characterization and risk factors for under-lying disease. Hepatology. 1999;29:664–669. doi: 10.1002/hep.510290347. [DOI] [PubMed] [Google Scholar]
- 14.Poonawala A, Nair SP, Thuluvath PJ. Prevalence of obesity and diabetes in patients with cryptogenic cirrhosis: a case-control study. Hepatology. 2000;32:689–692. doi: 10.1053/jhep.2000.17894. [DOI] [PubMed] [Google Scholar]
- 15.Maheshwari A, Thuluvath PJ. Cryptogenic cirrhosis and NAFLD: are they related? Am J Gastroenterol. 2006;101:664–668. doi: 10.1111/j.1572-0241.2006.00478.x. [DOI] [PubMed] [Google Scholar]
- 16.John PR, Thuluvath PJ. Outcome of liver transplantation in patients with diabetes mellitus: a case-control study. Hepatology. 2001;34:889–895. doi: 10.1053/jhep.2001.29134. [DOI] [PubMed] [Google Scholar]
- 17.Montori VM, Basu A, Erwin PJ, et al. Posttransplantation diabetes: a systematic review of the literature. Diabetes Care. 2002;25:583–592. doi: 10.2337/diacare.25.3.583. [DOI] [PubMed] [Google Scholar]
- 18.Hanouneh IA, Feldstein AE, McCullough AJ, et al. The significance of metabolic syndrome in the setting of recurrent hepatitis C after liver transplantation. Liver Transpl. 2008;14:1287–1293. doi: 10.1002/lt.21524. [DOI] [PubMed] [Google Scholar]
- 19.Forman LM. Metabolic syndrome in liver transplantation: the elephant in the room. Liver Transpl. 2008;14:1245–1248. doi: 10.1002/lt.21591. [DOI] [PubMed] [Google Scholar]