

Abstract
This study examined the predictive validity of accelerometers (ACC) to estimate physical activity intensity (PAI) across age and differences in intensity predictions when expressed in relative and absolute PAI terms. Ninety adults categorized into 3 age groups (20–29, 40–49, and 60–69 yr) completed a treadmill calibration study with simultaneous ACC (7164 Actigraph) and oxygen-consumption assessment. Results revealed strong linear relations between ACC output and measured PAI (R2 = .62–.89) across age and similar ACC cut-point ranges across age delineating absolute PAI ranges compared with previous findings. Comparing measured metabolic equivalents (METs) with estimated METs derived from previously published regression equations revealed that age did not affect predictive validity of ACC estimates of absolute PAI. Comparing ACC output expressed in relative vs. absolute terms across age revealed substantial differences in PAI ACC count ranges. Further work is warranted to increase the applicability of ACC use relative to PAI differences associated with physiological changes with age.
Keywords: older adults, motion sensor, validity, physical activity assessment, METs
Statistics and trends describing relationships between physical activity and health and prevalence rates of physical activity have been based largely on self-report physical activity surveys and questionnaires because of their feasibility in large-scale studies. In the literature it has been established that self-report physical activity surveys and questionnaires can accurately account for vigorous activity (Ainsworth et al., 2000; Richardson, Ainsworth, Jacobs, & Leon, 2001; Strath, Bassett, & Swartz, 2004) but are unable to accurately quantify more ubiquitous activities typically classified as light- to moderate-intensity activities (Ainsworth et al., 2000; LaMonte & Ainsworth, 2001; Strath et al.) that occur throughout the day. As such, there is a strong need to explore other physical activity assessment devices that can accurately predict different levels of physical activity intensity (PAI). Numerous reviews have been published on the strengths and limitations of objective physical activity monitoring and, specifically, the use of accelerometers (Bassett, 2000; Chen & Bassett, 2005; Matthew, 2005; Westerterp, 1999). Overall, an accelerometer can assess the frequency, intensity, and duration of movement. An accelerometer “count” represents an intensity of movement over a user-specified period of time. Researchers have developed regression relationships between accelerometer counts and criterion assessments of physical activity to allow for estimates of physical-activity-related energy expenditure and time spent in various absolute intensities of physical activity. The regression “cut point” approach to delineate different absolute PAIs (i.e., <3, 3–6, and >6 metabolic equivalents [MET]; 1 MET = 3.5 ml O2 · kg−1 · min−1) is perhaps the most commonly employed method for using accelerometer data, with other analytical approaches also gaining in popularity (Crouter, Clowers, & Bassett, 2006).
Freedson, Melanson, and Sirard (1998) were one of the first groups to establish regression formulas relating accelerometer counts to measured energy expenditure. Their laboratory study evaluated 50 adults (mean age 24.8 ± 4.2 years) while they walked or ran on a treadmill at three different speeds (4.83, 6.44, and 9.66 km/hr [3.0, 4.0, and 6.0 miles/hr]) concurrent with the measurement of oxygen consumption. Results indicated a strong relationship between accelerometer counts and oxygen consumption (r = .88) and shared variance of R2 = .82. The authors developed accelerometer-count ranges for light, moderate, and vigorous PAI levels (≤1,951, 1,952–5,724, and ≥5,725, respectively). A number of follow-up studies from other groups have found comparable results from similar walking and running calibration studies, with shared variance values ranging from R2 = .59 to R2 = .89 and PAI demarcations ranging from 1,810 to 2,260 counts/min for the lower margin of moderate PAI and 5,659–6,893 counts/min for the lower margin of vigorous PAI (Brage, Wedderkopp, Franks, Andersen, & Froberg, 2003; Hendelman, Miller, Baggett, Debold, & Freedson, 2000; Leenders, Nelson, & Sherman, 2003; Nichols, Morgan, Chabot, Sallis, & Calfas, 2000; Yngve, Nilsson, Sjostrom, & Ekelund, 2003). Common to all these published calibration studies has been the use of young (mean age range 23–30 years old) apparently healthy men and women. However, multiple studies are employing these devices and these equation estimates in older samples (Copeland & Esliger, 2009; Davis & Fox, 2007; Fox, Stathi, McKenna, & Davis, 2007; Gerdhem, Dencker, Ringsberg, & Akesson, 2008), as well as across the life span (Metzger et al., 2008; Troiano et al., 2008), to describe physical activity patterns, with little evidence to support whether these equation estimates are appropriate to use in different age populations.
Another aspect common to published accelerometer calibration studies is the use of prediction formulas expressed in absolute PAI terms (i.e., METs to derive moderate- [3–6 METs] and vigorous-intensity activity [>6 METs]; Ainsworth et al., 1993; Pate et al., 1995). Although the utility of absolute PAI allows for comparisons of results across multiple studies, an essential component to summarize relevant literature findings, it may also produce erroneous results when classifying PAI across different age groups. For instance, an absolute 3-MET activity may constitute a light relative PAI for a 20-year-old but a vigorous relative PAI for a 60-year-old.
To date, there is a paucity of calibration studies that have examined the utility of accelerometers across different age ranges and, further, examined accelerometer output differences when expressed as an absolute versus relative PAI. Therefore, the primary purpose of this study was to explore the relationships between accelerometer counts and measured oxygen consumption across a heterogeneous group of adults across a wide range of ages. A secondary purpose was to examine whether differences were evident when expressing accelerometer results in absolute PAI compared with relative PAI across different age groups.
Methods
Participants
Ninety participants age 20–29 years (n = 30, mean age 24.6 ± 2.5 years), 40–49 years (n = 30, mean age 44.6 ± 2.8 years), and 60–69 years (n = 30, mean age 64.3 ± 2.9 years) were recruited via posted flyers and word of mouth from a large Mid-western urban community. Participants in this study were healthy, able-bodied men and women free of cardiovascular, pulmonary, or metabolic diseases or orthopedic conditions that may have impaired their ability to safely perform treadmill walking and/or running. Participants were informed of potential risks and benefits of participation and signed an informed-consent document approved by the university institutional review board before study commencement.
Demographic and Anthropometric Testing
Participants completed a standard health history questionnaire and were excluded from the study if they had any orthopedic conditions that impaired their ability to safely perform treadmill walking or running or reported having prior cardiovascular, pulmonary, or metabolic diseases. Height (cm) and body mass (kg) with no shoes and minimal clothing were measured with a calibrated stadiometer and physician’s scale (Detecto, Kansas City, MO) before an exercise testing session.
Submaximal Exercise Protocol
Before testing, participants were instructed to abstain from caffeine, stimulants, and exercise for at least 4 hr. Participants were fitted with a Polar (S610i, Polar Electro, Oy, Kempele, Finland) heart-rate monitor and transmitter band. An Actigraph 7164 accelerometer (Actigraph, LLC, Pensacola, FL) was fastened to an elastic belt and worn on the right anterior axillary line at waist level. Estimated maximal heart rate was calculated for each individual with the following equation: 208 – (0.7 × age) (Tanaka, Monahan, & Seals, 2001). Participants were familiarized with the treadmill (Trackmaster Treadmill, Newton, KS) before starting the test. Throughout the test expiratory gases were collected and analyzed by means of a computerized metabolic measurement system (TrueOne 2400, ParvoMedics, Sandy, UT). The submaximal exercise test was a continuous walking and/or running protocol consisting of 5-min stage durations. All participants began the continuous protocol at 3.22 km/hr (2.0 miles/hr), with subsequent increases in intensity to 4.02 km/hr (2.5 miles/hr), 4.83 km/hr (3.0 miles/hr), 5.63 km/hr (3.5 miles/hr), 6.44 km/hr (4.0 miles/hr), 9.66 km/hr (6.0 miles/hr), 11.3 km/hr (7.0 miles/hr), and 12.9 km/hr (8.0 miles/hr). Grade was held constant at 0% for the duration of the test. The test continued until the participant reached 85% of age-predicted maximal heart rate or indicated a desire to discontinue the test (American College of Sports Medicine, 2006).
Actigraph Accelerometer
PAI was recorded using an Actigraph 7164 accelerometer, a lightweight (42 g) and small (5.08 × 4.06 × 1.53 cm) lithium-battery-powered uniaxial accelerometer. It is capable of recording accelerations ranging from 0.05 to 2 G with frequencies of 0.25–2.5 Hz (Tryon & Williams, 1996). Accelerometers were initialized according to the manufacturer’s specifications approximately 1 hr before each participant trial. The accelerometers were set to record in 60-s epochs for the adult population in this study. Pre–post accelerometer calibrations were conducted via a Calibrator64 (Actigraph LLC, Pensacola FL), which revealed a response within ±5% in accordance with manufacturer specifications.
Indirect Calorimetry
Oxygen consumption was recorded in 1-min intervals using standard open-circuit indirect calorimetry techniques. A mouthpiece was connected to a Hans Rudolf 2700 two-way nonrebreathing valve (Kansas City, MO). The mouthpiece was connected to a flexible plastic tube in which expired air was directed to the metabolic measurement system. The system analyzed concentrations of oxygen and carbon dioxide and volume of ventilation. This metabolic measurement system has been shown to be valid across a wide range of exercise intensities (Bassett et al., 2001).
Data Analysis
Data from accelerometers were downloaded from a user interface via serial port and imported into a Microsoft Excel file. Minutes 4 and 5 of each stage were averaged to create a mean value to reflect counts per minute for each stage interval. Data collected from indirect calorimetry were analyzed by taking the mean of Minutes 4 and 5 of each stage to represent the oxygen cost of that particular stage. Results from the submaximal test were used to predict VO2max by using the extrapolation of heart-rate value to an age-predicted maximal heart rate (208 – [0.7 × age]; Tanaka et al., 2001). Metabolic equivalents (METs) of each stage of the treadmill protocol were calculated by dividing steady-state VO2 (ml · kg−1 · min−1) by 3.5 ml · kg−1 · min−1 to yield measured METs. Percent maximal oxygen uptake (VO2max) for each treadmill stage was also calculated by dividing the measured VO2 (ml · kg−1 · min−1) by the estimated VO2max value and multiplying by 100. Accelerometer cut points were calculated by rearranging the regression equations to solve for the lower and upper margins of absolute (3–6 METs; Ainsworth et al., 1993; Pate et al., 1995), and relative (45–59% VO2max; U.S. Department of Health and Human Services, 1996) moderate PAI. In addition, mean accelerometer counts per minute for each age group were inserted into three commonly used equations (Brage et al., 2003; Freedson et al., 1998; Yngve et al., 2003) to yield predicted METs for the treadmill walking at 3.22, 4.83, and 6.44 km/hr and running at 9.66 km/hr. These three prediction equations were chosen because they were developed via laboratory treadmill protocols with two walking speeds and at least one running speed. Brage et al.’s equation additionally used estimated fitness levels from each age group to compute estimated METs.
Descriptive statistics are expressed as M ± SD; all other data are reported as M ± SE. Pearson’s correlation coefficients were calculated to explore relationships between accelerometer counts per minute and measured VO2. Linear-regression analyses were performed to predict absolute and relative PAI from accelerometer counts per minute for all age groups. A mixed between-by-within analysis of variance was completed across age, equation, and speed at 3.22, 4.83, and 6.44 km/hr for all age groups and additionally for the 20- to 29-year and 40- to 49-year groups at 9.66 km/hr to detect differences among measured and predicted METs. There were only 3 participants from the 20- to 29-year age group, one from the 40- to 49-year age group, and none from the 60- to 69-year age group who completed the final stage of the treadmill test (12.9 km/hr), so that stage was removed from the analysis. In addition, only one 60- to 69-year participant was able to complete the 11.3-km/hr stage, so the older age group for that stage was also removed. All statistical analyses were carried out using SPSS 16.0 for Windows (SPSS, Chicago, IL) with significance set at p < .05.
Results
All participants (N = 90) completed the protocol designed for this study, 30 individuals in each of the following age categories: 20–29 years, 40–49 years, and 60–69 years. Of the 20- to 29-year, 40- to 49-year, and 60- to 69-year groups, 90%, 77%, and 53% reached 85% of their age-predicted maximal heart rate ± 10 beats/min, respectively. Reasons for not reaching the 85% heart-rate estimation included leg fatigue, shortness of breath, overall fatigue, and the inability or desire to run. Participant characteristics are depicted in Table 1. Mean estimated VO2max measured in this study revealed significant differences across age groups (p < .01), but measurements were within the 50th-percentile range of normative values for the age groups developed from population data (American College of Sports Medicine, 2006). There were no significant differences apparent for estimated VO2max between genders.
Table 1.
Descriptive Characteristics of the Participants
| Variable | Age Group, Years
|
||
|---|---|---|---|
| 20–29 (n = 30) | 40–49 (n = 30) | 60–69 (n = 30) | |
| Age (years)* | 24.6 ± 2.6 | 44.6 ± 2.8 | 64.3 ± 2.9 |
| Gender | |||
| men | n = 14 | n = 7 | n = 13 |
| women | n = 16 | n = 23 | n = 17 |
| Height (cm) | 172.4 ± 8.6 | 168.1 ± 9.8 | 168.3 ± 8.2 |
| Mass (kg) | 70.1 ± 12.2 | 72.1 ± 15.4 | 73.0 ± 14.5 |
| VO2max (ml · kg−1 · min−1)* | 40.6 ± 6.5 | 36.0 ± 7.9 | 30.1 ± 7.5 |
Note. Values are M ± SD, N = 90. VO2max = estimated maximal oxygen consumption.
All groups significantly different, p < .01.
On examination of the relationship between accelerometer counts and measured VO2 for each age group, results showed significant positive correlations across all speeds, with r = .94 for the 20- to 29-year group, r = .89 for the 40- to 49-year group, and r = .79 for the 60- to 69-year group (all significant at p < .001). When correlations were established combining all groups together (N = 90), the correlation coefficient was r = .90 (p < .001), indicating a strong relationship between accelerometer counts and measured VO2 values during walking and running.
Within each age category (n = 30), linear regression was performed to predict PAI (absolute intensity [METs] and relative intensity [percentage of VO2max]) from accelerometer counts. Two prediction equations (one absolute and one relative intensity) were created for each age group (20–29, 40–49, and 60–69 years); thus, six prediction equations were developed in total. Corresponding cut points highlighting absolute moderate PAI (3–6 METs; Table 2) and relative moderate PAI (45–59% VO2max) were developed for each age category (Table 3).
Table 2.
Previously Published and Newly Developed Absolute Physical-Activity-Intensity Prediction Equations and Cut Points
| Reference | Prediction Equation
|
Cut Points
|
|||||
|---|---|---|---|---|---|---|---|
| Intercept | Slope | R2 | SEE | Inactive/Lighta | Moderateb | Vigorousc | |
| Brage et al., 2003, 23–30 years, N = 12 | 2.886 | .0007429 | .89 | 0.91 | 0–1,809 | 1,810–5,849 | ≥5,850 |
| Freedson et al., 1998, mean age 23 years, N = 50 | 1.439 | .000795 | .82 | 1.12 | 0–1,951 | 1,952–5,724 | ≥5,725 |
| Yngve et al., 2003, mean age 23 years, N = 28 | 1.136 | .0008249 | .85 | 1.14 | 0–2,259 | 2,260–5,895 | ≥5,896 |
| Current study, 20–29 years, n = 30 | 1.495 | .0008151 | .89 | 0.92 | 0–1,845 | 1,846–5,527 | ≥5,528 |
| Current study, 40–49 years, n = 30 | 1.399 | .0007453 | .79 | 1.05 | 0–2,147 | 2,148–6,173 | ≥6,174 |
| Current study, 60–69 years, n = 30 | 1.973 | .0006560 | .62 | 0.98 | 0–1,565 | 1,566–6,139 | ≥6,140 |
| Current study, 20–69 years, N = 90 | 1.532 | .0007695 | .81 | 1.00 | 0–1,907 | 1,908–5,806 | ≥5,807 |
Note. SEE = standard error of the estimate.
<3.0 metabolic equivalents (METs).
3.0–6.0 METs.
≥6.0 METs.
Table 3.
Newly Developed Relative (%VO2max) Physical-Activity-Intensity Prediction Equations and Cut Points
| Reference | Prediction Equation
|
Cut Points
|
|||||
|---|---|---|---|---|---|---|---|
| Intercept | Slope | R2 | SEE | Inactive/Lighta | Moderateb | Vigorousc | |
| Current study, 20–29 years, n = 30 | 16.066 | .0063268 | .78 | 10.5 | 0–4,572 | 4,573–6,786 | ≥6,787 |
| Current study, 40–49 years, n = 30 | 18.508 | .0060310 | .66 | 11.7 | 0–4,392 | 4,393–6,714 | ≥6,715 |
| Current study, 60–69 years, n = 30 | 29.238 | .0055366 | .43 | 11.6 | 0–2,846 | 2,847–5,376 | ≥5,377 |
Note. SEE = standard error of the estimate.
0–44% VO2max.
45–59% VO2max.
≥60% VO2max.
Data from this study showed a strong linear relationship between accelerometer output and measured METs across all three age groups (R2 = .62–.89). Results expressed relative to percent VO2max revealed a range in the strength of relationship between accelerometer output and percent maximal capacity across each group, with the 60- to 69-year group showing the weakest relationship (R2 = .45), followed by the 40- to 49-year group (R2 = .66) and the 20- to 29-year group (R2 = .78).
Figure 1 depicts the median and interquartile range for counts per minute recorded for each speed by age group. Results generally showed no differences in counts per minute across age groups across speed, with the only notable difference being between the 60- to 69-year group and 20- to 29 and 40- to 49-year groups at 9.66 km/hr (p < .05).
Figure 1.
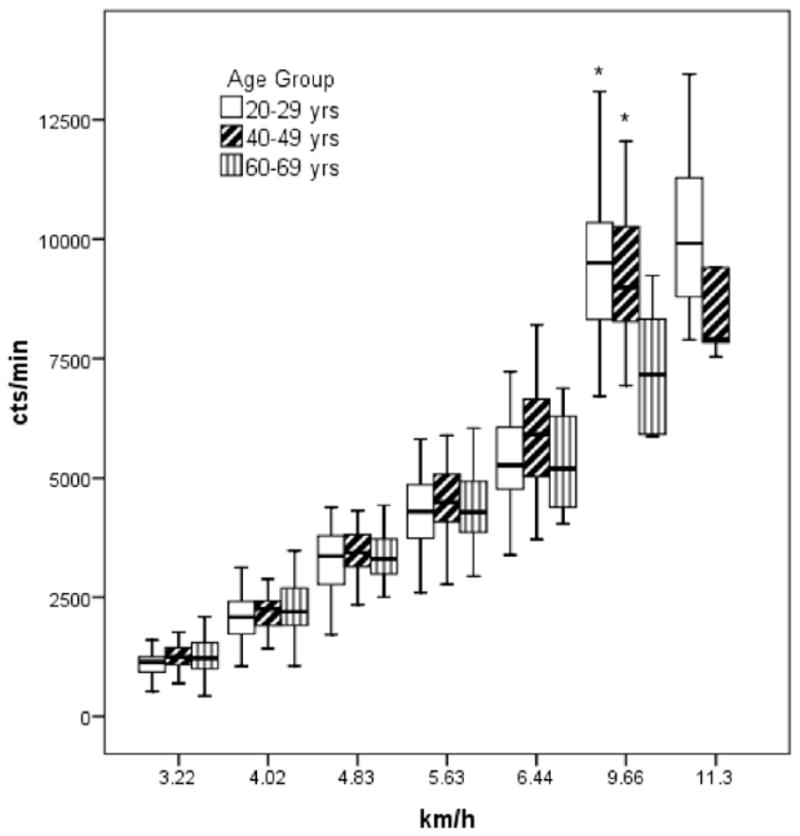
Box plot summarizing medians, 25th and 75th percentiles, and range of accelerometer counts per minute across speed by age group. *Statistically different from 60- to 69-year group, p < .05. Note. The 60- to 69-year group was omitted from 11.3 km/hr because only 1 participant finished that speed.
ANOVA revealed significant differences for measured METs across age groups for selected speeds. Significant differences were also seen across predicted values derived from published equations for most speeds for referent measured values within each age group. Measured and predicted absolute MET values, as well as significant differences, are depicted in Table 4.
Table 4.
Measured and Predicted Physical Activity Intensity Expressed in Metabolic Equivalents (M ± SD) Across Walking and Running Speeds
| Age group | Measured | Brage et al., 2003 | Freedson et al., 1998 | Yngve et al., 2003 |
|---|---|---|---|---|
| 20–29 years (n = 30) | ||||
| 3.22 km/hr | 2.9 ± 0.30 | 2.9 ± 0.70 | 2.4 ± 0.26a | 2.1 ± 0.27a |
| 4.83 km/hr | 3.8 ± 0.38 | 4.5 ± 0.47a | 4.0 ± 0.50 | 3.8 ± 0.52 |
| 6.44 km/hr | 5.3 ± 0.48 | 6.0 ± 0.65a | 5.7 ± 0.70a | 5.6 ± 0.72 |
| 9.66 km/hr (n = 27) | 9.5 ± 0.82 | 9.1 ± 1.20a | 9.0 ± 1.29a | 9.0 ± 1.34a |
| 40–49 years (n = 28) | ||||
| 3.22 km/hr | 2.7 ± 0.24b | 3.1 ± 0.23a | 2.4 ± 0.21a | 2.2 ± 0.22a |
| 4.83 km/hr | 3.5 ± 0.28b | 4.7 ± 0.47a | 4.2 ± 0.46a | 4.0 ± 0.47a |
| 6.44 km/hr | 5.1 ± 0.49 | 6.5 ± 0.89a | 6.1 ± 0.89a | 5.8 ± 0.93a |
| 9.66 km/hr (n = 21) | 9.0 ± 0.67b | 9.0 ± 1.11 | 8.8 ± 1.18 | 9.0 ± 1.23 |
| 60–69 years (n = 22) | ||||
| 3.22 km/hr | 3.0 ± 0.34c | 3.2 ± 0.45a | 2.4 ± 0.46a | 2.2 ± 0.48a |
| 4.83 km/hr | 3.8 ± 0.42c | 4.8 ± 0.72a | 4.1 ± 0.74a | 3.9 ± 0.77 |
| 6.44 km/hr | 5.7 ± 0.55c | 6.3 ± 0.10a | 5.8 ± 1.0 | 5.6 ± 1.10 |
Equation estimate significantly different than measured METs within age, within speed, p < .05.
Significantly different from 20- to 29-year group across age within speed, p < .05.
Significantly different from 40- to 49-year group across age within speed, p < .05.
Discussion
The ability to accurately assess physical activity is central to clarify the full nature of the relationship between physical activity and health. The last few years have seen the development and implementation of objective monitoring techniques to study physical activity behavior, with the use of accelerometry substantially growing in popularity. Subsequently, numerous accelerometer regression equations and a multitude of accelerometer cut points delineating PAI have been created (Brage et al., 2003; Freedson et al., 1998; Hendelman et al., 2000; Leenders et al., 2003; Nichols et al., 2000; Swartz et al., 2000; Yngve et al., 2003). This has created some uncertainty in the field as to which equation should be used or adopted. Furthermore, when different equations are used to predict PAI from accelerometer output across different studies, it becomes difficult to draw conclusions from data sets or compare results (Matthew, 2005). This is further complicated by the fact that the currently available regression-derived accelerometer cut points demarcating PAI levels were largely drawn from calibration studies involving walking and running activities in young populations. Irrespective of this calibration limitation, accelerometers are being used to assess physical activity behavior in a variety of populations, including the elderly (Copeland & Esliger, 2009; Davis & Fox, 2007; Fox et al., 2007; Gerdhem et al., 2008). The current study set out to extend findings to address the ability of accelerometer to assess PAI across a broader age group using the same laboratory walking and running speeds employed in prior calibration studies with young adults.
The principal finding from this study was that there were no differences in mean accelerometer counts per minute by age group for each speed between 3.22 and 6.44 km/hr. At 9.66 km/hr the 60- to 69-year group mean was significantly different from the 20- to 29 and 40- to 49-year group means (p < .05), but this may have been the result of a factor of sample size, with only 7 older adults able to complete this treadmill stage. The corresponding absolute moderate-PAI cut points calculated from these data for individual age groups and the whole group combined are in general agreement with the current literature. For instance, Freedson et al. (1998) reported a range of 1,952–5,724 counts/min for moderate PAI in a sample of 50 individuals with a mean age of 24 years. Brage et al. (2003), in a sample of 12 men 23–30 years of age, reported ranges of 1,810–5,849 counts/min from walking and running calibrations. Yngve et al. (2003) also reported moderate-PAI count ranges of 2,260–5,896 in a sample of 28 participants averaging 24 years of age. Overall findings from the current study suggest strong similarities between moderate absolute PAI accelerometer ranges irrespective of age.
We further compared METs across published equations by predicting absolute PAI with the mean accelerometer counts per minute from selected stages in the current study. Even though there were significant differences in measured MET values across age groups within the same speed, differences were relatively small. The predictive validity of all published regression equations was significantly different from measured MET values within the same speed across different age groups, with under- and overpredictions ranging in error from 8% to 34%. New data from the current study found no directionality in the percentage differences from measured absolute PAI across published equation with increasing age. Collectively, results finding strong similarities in moderate-PAI accelerometer cut-point ranges and no directionality in error based on age lend to the fact that employing previously published regression formulas is acceptable for different age groups when employing them to derive moderate absolute PAI lev The current study also set out to examine differences in predicting PAI from accelerometer counts when data are expressed relative to individuals’ maximal aerobic capacity, rather than using absolute PAI levels. Absolute PAI can be quantified by METs. Moderate PAI is equivalent to 3–6 METs in absolute terms; however, as the population ages, VO2max decreases (Fitzgerald, Tanaka, Tran, & Seals, 1997; Foster, Hume, Dickinson, Chatfield, & Byrnes, 1986; Hagberg, 1987; Proctor, Sinning, Walro, Sieck, & Lemon, 1995; Sallis, 2000; Tanaka & Seals, 1997). As such, with increasing age, an activity at a given absolute intensity (MET) requires a greater percentage of VO2max (relative intensity). Typically, PAI is prescribed in relation to an individual’s cardiorespiratory fitness as percentage of maximal heart rate or of VO2max. Epidemiological studies and much of the physical activity literature use absolute physical activity terms to relate to all-cause mortality (Blair et al., 1989; Hakim et al., 1998; Lee, Hsieh, & Paffenbarger, 1995; Paffenbarger, Hyde, Wing, & Hsieh, 1986), but interventions typically use relative terms to assess specific outcomes. On examination of the current data expressed in relative terms, clear, significant differences arise. Specifically, results showed substantial differences in relative moderate PAI between old (60–69 years) and young (20–29 years) groups (2,847–5,376 vs. 4,573–6,786 counts/min, respectively). Interpretation of the data from the current study would therefore suggest that 3,000 counts/min would represent a light PAI for a 20- or 40-year-old but a moderate PAI for a 60-year-old. Moreover, 5,500 counts/min would represent a moderate PAI for a 20- or 40-year-old, similar to the absolute cut points discussed previously, but a vigorous PAI for a 60-year-old. Mean accelerometer data from Stage 5 (6.44 km/hr) were 5,440 counts/min for the 60- to 69-year group, and 23 of the 30 individuals in that age group terminated the protocol after that stage, thus suggesting that this older sample’s fitness level would not permit most individual intensities registering at 6,000 counts/min or above. This new information regarding differences in age groups is evidence that using an absolute 3- to 6-MET moderate-PAI approach may not be the most accurate option when examining physical activity behavior or assessing physical activity outcomes using accelerometry in samples varying in age from young to old.
The current study is not without limitations. Two estimates were implemented during the testing protocol. The submaximal exercise test was used to create an estimate of each individual’s VO2max capacity. The weaker reported relationships between accelerometer counts per minute for relative PAI than for absolute PAI may be a function of using an estimated VO2max rather than a measured VO2max. In addition, even though oxygen consumption was measured in ml · kg−1 · min−1, resting metabolic rate was not measured, and measured oxygen consumption was divided by a constant 3.5 ml · kg−1 · min−1 to derive metabolic equivalents. Nevertheless, these limitations do not affect the evident relationship shown across age groups, because the same limitation applies to all age groups studied. Furthermore, the weaker relationships shown for the older age group between accelerometer counts and measured oxygen consumption, confirming previous study results (Brandon, Ross, Sanford, & Lloyd, 2004; Fehling, Smith, Warner, & Dalsky, 1999; Nichols, Patterson, & Early, 1992), may have been a function of biomechanical differences in gait associated with aging. Further study of the use of accelerometers for individuals with functional and mobility limitations is warranted. Overall study results are limited to apparently healthy adults with no prior orthopedic, cardiovascular, or metabolic disease.
The use of currently published accelerometer regression equations to demarcate absolute PAI levels does not appear to be affected with variations in age ranging from 20 to 69 years. The current study’s regressed activity counts to absolute PAI (1,908–5,806 counts/min) classifications for moderate PAI were very similar to previously published and used values such as those of Freedson et al. (1998; 1,952–5,724 counts/min). This information reinforces the idea that there is no need to recreate different cut points based on age when interested in accelerometer-derived absolute PAI measures. However, when results are expressed relative to an individual’s maximal PAI level (aerobic fitness), large differences appear. Expressing PAI via accelerometer in relative terms may better define the dose response of physical activity associated with health relationships across the life span and provide more accurate estimates of physical activity behavior in different age populations to account for age-associated differences in PAI. Future studies should explore alternative efforts to improve accelerometer PAI predictions relative to individual age or fitness level.
Acknowledgments
This work was partially supported by a University of Wisconsin–Milwaukee College of Health Sciences graduate student research grant and a Career Development Award from the National Institute on Aging (5K01AG025962).
References
- Ainsworth BE, Bassett DR, Jr, Strath SJ, Swartz AM, O’Brien WL, Thompson RW, et al. Comparison of three methods for measuring the time spent in physical activity. Medicine and Science in Sports and Exercise. 2000;32(9 Suppl):S457–S464. doi: 10.1097/00005768-200009001-00004. [DOI] [PubMed] [Google Scholar]
- Ainsworth BE, Haskell WL, Leon AS, Jacobs DR, Jr, Montoye HJ, Sallis JF, et al. Compendium of physical activities: Classification of energy costs of human physical activities. Medicine and Science in Sports and Exercise. 1993;25(1):71–80. doi: 10.1249/00005768-199301000-00011. [DOI] [PubMed] [Google Scholar]
- American College of Sports Medicine. ACSM’s guidelines for exercise testing and prescription. 7. Philadelphia: Lippincott Williams & Wilkins; 2006. [Google Scholar]
- Bassett DR, Jr, Howley ET, Thompson DL, King GA, Strath SJ, McLaughlin JE, et al. Validity of inspiratory and expiratory methods of measuring gas exchange with a computerized system. Journal of Applied Physiology. 2001;91(1):218–224. doi: 10.1152/jappl.2001.91.1.218. [DOI] [PubMed] [Google Scholar]
- Bassett DR., Jr Validity and reliability issues in objective monitoring of physical activity. Research Quarterly for Exercise and Sport. 2000;71(2, Suppl):S30–S36. [PubMed] [Google Scholar]
- Blair SN, Kohl HW, III, Paffenbarger RS, Jr, Clark DG, Cooper KH, Gibbons LW. Physical fitness and all-cause mortality. A prospective study of healthy men and women. Journal of the American Medical Association. 1989;262(17):2395–2401. doi: 10.1001/jama.262.17.2395. [DOI] [PubMed] [Google Scholar]
- Brage S, Wedderkopp N, Franks PW, Andersen LB, Froberg K. Reexamination of validity and reliability of the CSA monitor in walking and running. Medicine and Science in Sports and Exercise. 2003;35(8):1447–1454. doi: 10.1249/01.MSS.0000079078.62035.EC. [DOI] [PubMed] [Google Scholar]
- Brandon LJ, Ross DA, Sanford JA, Lloyd A. Predicting oxygen uptake in older adults using lower-limb accelerometer measures. Journal of Rehabilitation Research and Development. 2004;41(6A):861–870. doi: 10.1682/jrrd.2003.12.0176. [DOI] [PubMed] [Google Scholar]
- Chen KY, Bassett DR., Jr The technology of accelerometry-based activity monitors: Current and future. Medicine and Science in Sports and Exercise. 2005;37(11, Suppl):S490–S500. doi: 10.1249/01.mss.0000185571.49104.82. [DOI] [PubMed] [Google Scholar]
- Copeland JL, Esliger DW. Accelerometer assessment of physical activity in active, healthy older adults. Journal of Aging and Physical Activity. 2009;17(1):17–30. doi: 10.1123/japa.17.1.17. [DOI] [PubMed] [Google Scholar]
- Crouter SE, Clowers KG, Bassett DR., Jr A novel method for using accelerometer data to predict energy expenditure. Journal of Applied Physiology. 2006;100(4):1324–1331. doi: 10.1152/japplphysiol.00818.2005. [DOI] [PubMed] [Google Scholar]
- Davis MG, Fox KR. Physical activity patterns assessed by accelerometry in older people. European Journal of Applied Physiology. 2007;100(5):581–589. doi: 10.1007/s00421-006-0320-8. [DOI] [PubMed] [Google Scholar]
- Fehling PC, Smith DL, Warner SE, Dalsky GP. Comparison of accelerometers with oxygen consumption in older adults during exercise. Medicine and Science in Sports and Exercise. 1999;31(1):171–175. doi: 10.1097/00005768-199901000-00026. [DOI] [PubMed] [Google Scholar]
- Fitzgerald MD, Tanaka H, Tran ZV, Seals DR. Age-related declines in maximal aerobic capacity in regularly exercising vs. sedentary women: A meta-analysis. Journal of Applied Physiology. 1997;83(1):160–165. doi: 10.1152/jappl.1997.83.1.160. [DOI] [PubMed] [Google Scholar]
- Foster VL, Hume GJ, Dickinson AL, Chatfield SJ, Byrnes WC. The reproducibility of VO2max, ventilatory, and lactate thresholds in elderly women. Medicine and Science in Sports and Exercise. 1986;18(4):425–430. [PubMed] [Google Scholar]
- Fox KR, Stathi A, McKenna J, Davis MG. Physical activity and mental well-being in older people participating in the Better Ageing Project. European Journal of Applied Physiology. 2007;100(5):591–602. doi: 10.1007/s00421-007-0392-0. [DOI] [PubMed] [Google Scholar]
- Freedson PS, Melanson E, Sirard J. Calibration of the Computer Science and Applications, Inc. accelerometer. Medicine and Science in Sports and Exercise. 1998;30(5):777–781. doi: 10.1097/00005768-199805000-00021. [DOI] [PubMed] [Google Scholar]
- Gerdhem P, Dencker M, Ringsberg K, Akesson K. Accelerometer-measured daily physical activity among octogenarians: Results and associations to other indices of physical performance and bone density. European Journal of Applied Physiology. 2008;102(2):173–180. doi: 10.1007/s00421-007-0571-z. [DOI] [PubMed] [Google Scholar]
- Hagberg JM. Effect of training on the decline of VO2max with aging. Federation Proceedings. 1987;46(5):1830–1833. [PubMed] [Google Scholar]
- Hakim AA, Petrovitch H, Burchfiel CM, Ross GW, Rodriguez BL, White LR, et al. Effects of walking on mortality among nonsmoking retired men. The New England Journal of Medicine. 1998;338(2):94–99. doi: 10.1056/NEJM199801083380204. [DOI] [PubMed] [Google Scholar]
- Hendelman D, Miller K, Baggett C, Debold E, Freedson P. Validity of accelerometry for the assessment of moderate intensity physical activity in the field. Medicine and Science in Sports and Exercise. 2000;32(9, Suppl):S442–S449. doi: 10.1097/00005768-200009001-00002. [DOI] [PubMed] [Google Scholar]
- LaMonte MJ, Ainsworth BE. Quantifying energy expenditure and physical activity in the context of dose response. Medicine and Science in Sports and Exercise. 2001;33(6 Suppl):S370–378. S419–S420. doi: 10.1097/00005768-200106001-00006. [DOI] [PubMed] [Google Scholar]
- Lee IM, Hsieh CC, Paffenbarger RS., Jr Exercise intensity and longevity in men. The Harvard Alumni Health Study. Journal of the American Medical Association. 1995;273(15):1179–1184. [PubMed] [Google Scholar]
- Leenders NY, Nelson TE, Sherman WM. Ability of different physical activity monitors to detect movement during treadmill walking. International Journal of Sports Medicine. 2003;24(1):43–50. doi: 10.1055/s-2003-37196. [DOI] [PubMed] [Google Scholar]
- Matthew CE. Calibration of accelerometer output for adults. Medicine and Science in Sports and Exercise. 2005;37(11, Suppl):S512–S522. doi: 10.1249/01.mss.0000185659.11982.3d. [DOI] [PubMed] [Google Scholar]
- Metzger JS, Catellier DJ, Evenson KR, Treuth MS, Rosamond WD, Siega-Riz AM. Patterns of objectively measured physical activity in the United States. Medicine and Science in Sports and Exercise. 2008;40(4):630–638. doi: 10.1249/MSS.0b013e3181620ebc. [DOI] [PubMed] [Google Scholar]
- Nichols JF, Morgan CG, Chabot LE, Sallis JF, Calfas KJ. Assessment of physical activity with the Computer Science and Applications, Inc., accelerometer: Laboratory versus field validation. Research Quarterly for Exercise and Sport. 2000;71(1):36–43. doi: 10.1080/02701367.2000.10608878. [DOI] [PubMed] [Google Scholar]
- Nichols JF, Patterson P, Early T. A validation of a physical activity monitor for young and older adults. Canadian Journal of Sport Sciences. 1992;17(4):299–303. [PubMed] [Google Scholar]
- Paffenbarger RS, Jr, Hyde RT, Wing AL, Hsieh CC. Physical activity, all-cause mortality, and longevity of college alumni. The New England Journal of Medicine. 1986;314(10):605–613. doi: 10.1056/NEJM198603063141003. [DOI] [PubMed] [Google Scholar]
- Pate RR, Pratt M, Blair SN, Haskell WL, Macera CA, Bouchard C, et al. Physical activity and public health. A recommendation from the Centers for Disease Control and Prevention and the American College of Sports Medicine. Journal of the American Medical Association. 1995;273(5):402–407. doi: 10.1001/jama.273.5.402. [DOI] [PubMed] [Google Scholar]
- Proctor DN, Sinning WE, Walro JM, Sieck GC, Lemon PW. Oxidative capacity of human muscle fiber types: Effects of age and training status. Journal of Applied Physiology. 1995;78(6):2033–2038. doi: 10.1152/jappl.1995.78.6.2033. [DOI] [PubMed] [Google Scholar]
- Richardson MT, Ainsworth BE, Jacobs DR, Leon AS. Validation of the Stanford 7-day recall to assess habitual physical activity. Annals of Epidemiology. 2001;11(2):145–153. doi: 10.1016/s1047-2797(00)00190-3. [DOI] [PubMed] [Google Scholar]
- Sallis JF. Age-related decline in physical activity: A synthesis of human and animal studies. Medicine and Science in Sports and Exercise. 2000;32(9):1598–1600. doi: 10.1097/00005768-200009000-00012. [DOI] [PubMed] [Google Scholar]
- Strath SJ, Bassett DR, Jr, Swartz AM. Comparison of the college alumnus questionnaire physical activity index with objective monitoring. Annals of Epidemiology. 2004;14(6):409–415. doi: 10.1016/j.annepidem.2003.07.001. [DOI] [PubMed] [Google Scholar]
- Swartz AM, Strath SJ, Bassett DR, Jr, O’Brien WL, King GA, Ainsworth BE. Estimation of energy expenditure using CSA accelerometers at hip and wrist sites. Medicine and Science in Sports and Exercise. 2000;32(9 Suppl):S450–S456. doi: 10.1097/00005768-200009001-00003. [DOI] [PubMed] [Google Scholar]
- Tanaka H, Monahan KD, Seals DR. Age-predicted maximal heart rate revisited. Journal of the American College of Cardiology. 2001;37(1):153–156. doi: 10.1016/s0735-1097(00)01054-8. [DOI] [PubMed] [Google Scholar]
- Tanaka H, Seals DR. Age and gender interactions in physiological functional capacity: Insight from swimming performance. Journal of Applied Physiology. 1997;82(3):846–851. doi: 10.1152/jappl.1997.82.3.846. [DOI] [PubMed] [Google Scholar]
- Troiano RP, Berrigan D, Dodd KW, Masse LC, Tilert T, McDowell M. Physical activity in the United States measured by accelerometer. Medicine and Science in Sports and Exercise. 2008;40(1):181–188. doi: 10.1249/mss.0b013e31815a51b3. [DOI] [PubMed] [Google Scholar]
- Tryon WW, Williams R. Fully proportional actigraphy: A new instrument. Behavior Research Methods, Instruments, & Computers. 1996;28(3):392–403. [Google Scholar]
- U.S. Department of Health and Human Services. Physical activity and health: A report of the Surgeon General. Atlanta, GA: U.S. Department of Health and Human Services, Centers for Disease Control and Prevention, National Center for Chronic Disease Prevention and Health Promotion; 1996. [Google Scholar]
- Westerterp KR. Physical activity assessment with accelerometers. International Journal of Obesity and Related Metabolic Disorders. 1999;23(Suppl 3):S45–S49. doi: 10.1038/sj.ijo.0800883. [DOI] [PubMed] [Google Scholar]
- Yngve A, Nilsson A, Sjostrom M, Ekelund U. Effect of monitor placement and of activity setting on the MTI accelerometer output. Medicine and Science in Sports and Exercise. 2003;35(2):320–326. doi: 10.1249/01.MSS.0000048829.75758.A0. [DOI] [PubMed] [Google Scholar]