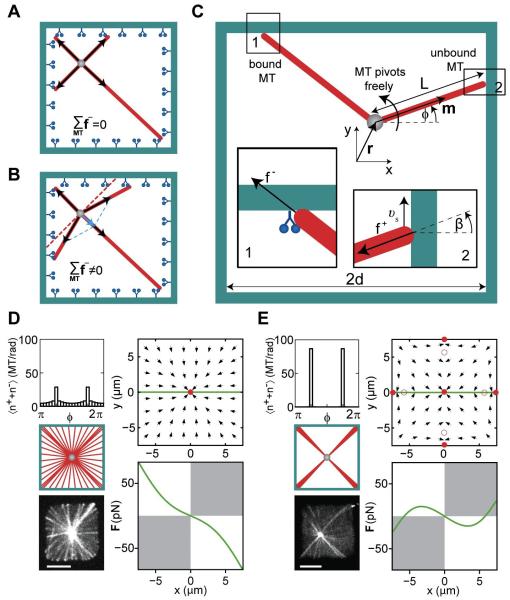
Figure 6. Theory of aster positioning.
Cartoon showing the net pulling force without (A) and with MT slipping (B). (C) Schematic representation of a MT organizing center at r=(x,y) in a confining geometry. The MT orientation is described by the angle φ, the MT length is denoted by L. Inset 1 shows a MT under pulling force f−. Inset 2 shows a MT under pushing force f+, which slips along the wall with velocity νs. The angle between the MT orientation and the normal to the boundary is β. (D,E) Angular MT distributions and the corresponding force direction fields for a MT organizing center in a chamber with (D; kb=0.02 s−1) and without dynein (E; kb =0 s−1). Full and hollow red circles show the stable and unstable force-balanced states, and the green line indicates the positions for which the forces are shown below. White quadrants indicate where the force is centering. Other parameters (see Box 1) are kcat = 10−4 s−1, koff = 10−3 s−1, = 5 pN, ζ = 5·10−5 N·s/m, κ = 3.3·10−23 Nm2, M=50. For comparison, images of a MT aster in a microfabricated chamber with (D), and without dynein (E) are shown. Scalebars indicate 5 μm.

