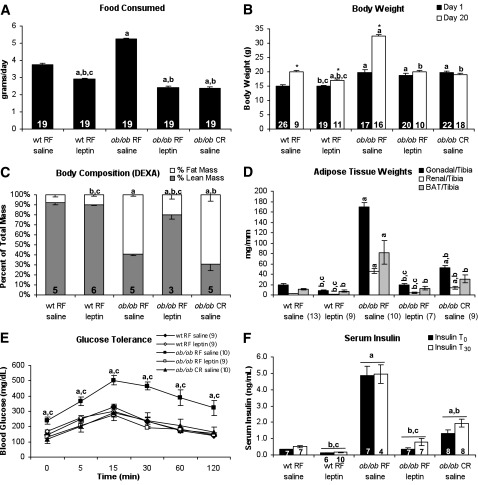
FIG. 1.
Altered body composition but normal glucose tolerance in caloric-restricted (CR) ob/ob mice. Average daily food intake (A), body weight (B), body composition (C), and adipose tissue weight (D) of ob/ob mice are shown. E: GTT performed on mice during 3rd week of treatment after 6 h of fasting. F: Serum insulin levels collected before and 30 min after glucose injection. Numbers of animals are shown in each figure. RF, random fed. aP < 0.05 vs. wt RF saline; bP < 0.05 vs. ob/ob RF saline; cP < 0.05 vs. ob/ob CR saline; *P < 0.05 vs. basal conditions of same treatment group. DEXA, dual-energy X-ray absorptiometry; RF, random fed; wt, wild type.

