Abstract
OBJECTIVE
cAMP is a critical messenger for insulin and glucagon secretion from pancreatic β- and α-cells, respectively. Dispersed β-cells show cAMP oscillations, but the signaling kinetics in cells within intact islets of Langerhans is unknown.
RESEARCH DESIGN AND METHODS
The subplasma-membrane cAMP concentration ([cAMP]pm) was recorded in α- and β-cells in the mantle of intact mouse pancreatic islets using total internal reflection microscopy and a fluorescent translocation biosensor. Cell identification was based on the opposite effects of adrenaline on cAMP in α- and β-cells.
RESULTS
In islets exposed to 3 mmol/L glucose, [cAMP]pm was low and stable. Glucagon and glucagon-like peptide-1(7-36)-amide (GLP-1) induced dose-dependent elevation of [cAMP]pm, often with oscillations synchronized among β-cells. Whereas glucagon also induced [cAMP]pm oscillations in most α-cells, <20% of the α-cells responded to GLP-1. Elevation of the glucose concentration to 11–30 mmol/L in the absence of hormones induced slow [cAMP]pm oscillations in both α- and β-cells. These cAMP oscillations were coordinated with those of the cytoplasmic Ca2+ concentration ([Ca2+]i) in the β-cells but not caused by the changes in [Ca2+]i. The transmembrane adenylyl cyclase (AC) inhibitor 2′5′-dideoxyadenosine suppressed the glucose- and hormone-induced [cAMP]pm elevations, whereas the preferential inhibitors of soluble AC, KH7, and 1,3,5(10)-estratrien-2,3,17-β-triol perturbed cell metabolism and lacked effect, respectively.
CONCLUSIONS
Oscillatory [cAMP]pm signaling in secretagogue-stimulated β-cells is maintained within intact islets and depends on transmembrane AC activity. The discovery of glucose- and glucagon-induced [cAMP]pm oscillations in α-cells indicates the involvement of cAMP in the regulation of pulsatile glucagon secretion.
Cyclic AMP and Ca2+ are key messengers in the regulation of insulin and glucagon secretion from pancreatic β- and α-cells, respectively, by nutrients, hormones, and neural factors. Glucose stimulation of insulin secretion involves uptake and metabolism of the sugar in the β-cells, closure of ATP-sensitive K+ channels, and depolarization-induced Ca2+ entry generating oscillations of the cytoplasmic Ca2+ concentration ([Ca2+]i) that trigger periodic exocytosis of secretory granules (1,2). This process is amplified by mechanism(s) acting distal to the elevation of Ca2+ (3). cAMP promotes exocytosis by facilitating the generation of Ca2+ signals (4,5), by sensitizing the secretory machinery to Ca2+ (4,6), and by stimulating mobilization and priming of granules via protein kinase A– and Epac-dependent pathways (7,8).
Measurements of the cAMP concentration beneath the plasma membrane ([cAMP]pm) in individual INS-1 β-cells showed that glucagon-like peptide-1(7-36)-amide (GLP-1) induces [cAMP]pm elevation, often manifested as oscillations (9). Glucose has been regarded to only modestly raise islet cAMP, supposedly by amplifying the effect of glucagon (10), but single-cell cAMP recordings have recently shown that glucose alone induces marked elevation of cAMP in MIN6 β-cells (11,12) and primary mouse β-cells (12,13). Although one study reported that the glucose-induced cAMP response depends on elevation of [Ca2+]i (11), other studies show only partial or no Ca2+-dependence of the cAMP signal (12,13). Like hormone stimulation, glucose induces oscillations of [cAMP]pm, and coordination of the [cAMP]pm and [Ca2+]i elevations generates pulsatile insulin release (12,14).
There are 10 isoforms of cAMP-generating adenylyl cyclases (ACs) with different regulatory properties, nine of which are transmembrane (tm) proteins stimulated by Gαs and the plant diterpene forskolin. Such tmACs mediate the cAMP-elevating action of glucagon and incretin hormones (15). β-cells express multiple tmACs (16), and the Ca2+-stimulated AC8 has been proposed to be particularly important for integrating hormone- and depolarization-evoked signals (17). Soluble AC (sAC) is the only isoform that lacks transmembrane domains. It is insensitive to forskolin and G-proteins but stimulated by bicarbonate (18) and Ca2+ (19). Although sAC was first found in the testis, it also seems to be expressed in other tissues and was recently proposed to be involved in glucose-induced cAMP production in insulin-secreting cells (20).
Like insulin secretion, exocytosis of glucagon from the α-cells is triggered by an increase of [Ca2+]i (21). Glucagon release is stimulated by absence of glucose and is maximally inhibited when the sugar concentration approaches the threshold for stimulation of insulin secretion (22). Under hypoglycemic conditions, glucagon secretion is also stimulated by adrenaline, which raises [Ca2+]i and [cAMP]pm via α1- and β-adrenergic mechanisms (23,24). There are fundamentally different ideas about the mechanisms underlying glucose inhibition of glucagon secretion, including paracrine influences from β- and δ-cells (25–29) and direct actions of glucose on the α-cells, resulting in depolarization- (30) or hyperpolarization-mediated (22) inhibition of exocytosis. Apart from the inhibitory effect of glucose, we observed that very high glucose concentrations unexpectedly stimulate glucagon secretion (31). The stimulatory component may be important under physiological conditions because the hormone is released in pulses from rat (32) and human (33) islets. Glucose thus causes alternating periods of stimulation and inhibition resulting in time-average reduction of glucagon secretion. Ca2+ is probably not the only messenger in glucose-regulated glucagon release (29). Like for insulin secretion, cAMP is believed to promote glucagon release by enhancing intracellular Ca2+ mobilization, Ca2+ influx through the plasma membrane, and mobilization of secretory granules (23,24,34,35). However, it has also been suggested that cAMP-mediated reduction of N-type Ca2+ currents can explain the inhibitory effect of GLP-1 on glucagon secretion (36).
Until now, nothing was known about cAMP kinetics in α-cells and all information on primary β-cells was based on studies of dispersed islet cells. However, as a result of gap junctional coupling and paracrine influences, the electrophysiological characteristics and [Ca2+]i signaling in intact islets differ considerably from those in dispersed β-cells (2). Therefore, the aim of the current study was to clarify how glucose, glucagon, and GLP-1 affect cAMP signaling in α- and β-cells within intact islets of Langerhans.
RESEARCH DESIGN AND METHODS
Adrenaline, glucagon, GLP-1, 2′5′-dideoxyadenosine (DDA), EGTA, poly-l-lysine, 3-isobutylmethylxanthine (IBMX), somatostatin, and HEPES were from Sigma. Catechol estrogen (CE) [1,3,5(10)-estratrien-2,3,17-β-triol] for AC inhibition and the inactive control compound 1,3,5(10)-estratrien-3,17-β-triol were from Makaira Limited (London, U.K.). KH7 was a gift from Drs. J. Buck and L. Levin, Weill Medical College of Cornell University, New York, NY. The acetoxymethyl esters of the Ca2+ indicators Fura-PE3 and Fura Red were obtained from TEFLabs (Austin, TX) and Invitrogen, respectively. Adenoviruses expressing a fluorescent cAMP biosensor have previously been described (12).
Islet isolation, cell culture, and virus infection.
Islets of Langerhans were isolated from C57BL6J mice as previously described (22). The Uppsala ethics committee approved all animal experimental procedures. When the pancreas was excised, the lower duodenal part was omitted to reduce contribution of islets with cells producing pancreatic polypeptide (37). After isolation, the islets were cultured for 1–4 days in RPMI-1640 medium containing 5.5 mmol/L glucose, 10% fetal calf serum, 100 μg/mL penicillin, and 100 μg/mL streptomycin at 37°C in an atmosphere of 5% CO2 in humidified air. Some experiments were performed on single cells prepared by shaking the freshly isolated islets in a Ca2+-deficient medium followed by attachment to coverslips during 2–5 days of culture. If not otherwise stated, data were obtained with cells from at least three independent islet isolations. Where indicated, experiments were performed on insulin-secreting MIN6 β-cells cultured as previously described (12). For [cAMP]pm measurements, the islets or cells were infected with cAMP biosensor-encoding adenoviruses using 105 fluorescence forming units (FFU)/islet or 60 FFU/cell as previously described (12). It was verified that the virus infection did not affect the islet [Ca2+]i response to glucose stimulation.
Measurements of [Ca2+]i and [cAMP]pm.
The islets or cells were transferred to a buffer containing (in mmol/L) 125 NaCl, 4.8 KCl, 1.3 CaCl2, 1.2 MgCl2, 3 glucose, and 25 HEPES (pH adjusted to 7.40 with NaOH) and incubated for 30 min at 37°C. In some experiments, this medium was supplemented with 20 mmol/L NaHCO3 after equimolar reduction of NaCl. For Ca2+ recordings, the cells were preincubated in the presence of 1 μmol/L of the acetoxymethyl ester of Fura-PE3 and islets with 10 μmol/L of the acetoxymethyl ester of Fura Red, respectively. Immediately after preincubation, the islets were applied onto a poly-l-lysine–coated 25-mm coverslip and allowed to attach. [Ca2+]i imaging with Fura-PE3 was performed at 37°C with an epifluorescence microscope setup as previously described (5). Measurements of the cytoplasmic Ca2+ concentration beneath the plasma membrane ([Ca2+]pm) were made with Fura Red in a total internal reflection fluorescence (TIRF) setup consisting of an Eclipse Ti microscope with a 60× 1.45 NA-objective (Nikon), using 488 nm excitation with fluorescence detection at >630 nm. Using the same TIRF system, [cAMP]pm was measured in intact islets or cells expressing the cAMP translocation biosensor as previously described (12). Image pairs were acquired every 5 s using a back-illuminated EMCCD camera (DU-887; Andor Technology, Belfast, Northern Ireland) controlled by MetaFluor software (Molecular Devices, Downingtown, PA). The cAMP concentration was expressed as the background-corrected cyan fluorescent protein–to–yellow fluorescent protein (CFP-to-YFP) ratio. The basal ratio was normalized to unity for compensation for the variability in expression levels.
Immunostaining.
Individual cells in the experimental chamber were identified by immunostaining for insulin or glucagon. Following the fluorescence recordings, the cells were rinsed with 25, 50, and 75% ethanol and eventually fixed in 95% ethanol for 5 min. After sequential rinsing with 3% H2O2 and Tris buffer (0.05 mol/L, pH 7.4), serum-free protein block (DAKO) was added to reduce background staining. Polyclonal rabbit anti-glucagon or guinea pig anti-insulin (1:100; DAKO) was added after 10 min and allowed to incubate for 30 min. After rinsing with Tris buffer, the MACH 3 rabbit probe alkaline phosphatase polymer kit (Biocare Medical, Concord, CA) was used for visualization according to the manufacturer’s instructions. The reaction was stopped by addition of Tris buffer. After rinsing with distilled water, cell nuclei were stained with hematoxylin (Histolab) for 0.5–2 min.
Glucose oxidation.
Triplicate vials, each containing 104 MIN6 β-cells and Krebs-Ringer bicarbonate–HEPES buffer (100 μL) supplemented with 3.3 mmol/L (94 GBq/mol) or 11.1 mmol/L (28 GBq/mol) D-[U-14C]glucose, were incubated with or without test compounds for 90 min at 37°C under an atmosphere of 95/5% O2/CO2 during slow shaking. Metabolism was then stopped by addition of 17 μmol/L antimycin A (Sigma-Aldrich) in ethanol. The generated 14CO2 was trapped in 250 μL hyamine 10× (Perkin-Elmer) during incubation at 37°C for 2 h as previously described (38). Radioactivity was measured in a liquid scintillation counter after addition of 5 mL Ultima Gold scintillation fluid (Perkin-Elmer).
Image and statistical analysis.
Image analysis was made using the MetaFluor or ImageJ (W.S. Rasband, National Institutes of Health, http://rsb.info.nih.gov/ij) software. [cAMP]pm and [Ca2+]i response magnitudes were calculated from time-average data obtained before and during the stimulation period. Data are presented as means ± SEM. Statistical comparisons were assessed with Student t test.
RESULTS
Adrenaline has opposite effects on [cAMP]pm in α- and β-cells.
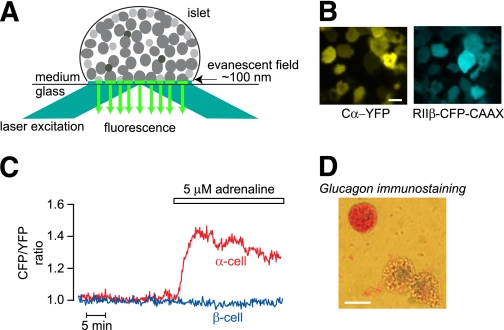
Figure 1A illustrates TIRF measurements on peripheral mouse islet cells expressing the cAMP biosensor, and Fig. 1B shows TIRF images of the fluorescence-labeled subunits of the cAMP indicator. The CFP-to-YFP ratio was usually stable in peripheral islet cells exposed to 3 mmol/L glucose (Fig. 1C). Cell size and adrenaline responses have previously been used to discriminate between α- and β-cells because only the relatively small α-cells expressing α1- and β-adrenoceptors (24) respond with intracellular mobilization of Ca2+ (39). Because the β-adrenoceptors mediate cAMP elevation in α-cells and the larger β-cells express cAMP-lowering α2-adrenoceptors (40), we tested whether the cAMP response to adrenaline could be used for cell identification. This was indeed the case, and all of 25 cells with small TIRF footprints that responded to adrenaline with [cAMP]pm elevation stained positively for glucagon. In contrast, all of 30 cells with large footprint and negative adrenaline response were insulin positive. Figure 1C and D shows that an immune-identified α-cell responded to adrenaline with elevation of [cAMP]pm, whereas a β-cell (immunostaining not shown) did not respond under these conditions with basal [cAMP]pm levels. The [cAMP]pm-lowering effect of adrenaline on β-cells became apparent under conditions where the levels of cAMP were elevated (Fig. 2A and D).
FIG. 1.
TIRF imaging of intact pancreatic islets shows that adrenaline induces differential effects on [cAMP]pm in α- and β-cells. A: Principle for TIRF imaging of an intact pancreatic islet attached to a coverslip. Reflection of the laser excitation light at the coverglass-medium interface generates an evanescent field within an ∼100 nm zone above the interface, which will excite fluorescent molecules near the plasma membrane of the various islet cells that adhere to the coverslip. B: TIRF microscopy images of a mouse pancreatic islet expressing the cAMP translocation biosensor composed of a PKA catalytic Cα subunit fused to YFP (Cα-YFP) and a truncated PKA regulatory RIIβ subunit fused to a membrane-anchored CFP (RIIβ-CFP-CAAX). C: TIRF microscopy recordings of [cAMP]pm in isolated immunoidentified α- and β-cells exposed to 3 mmol/L glucose and 5 μmol/L adrenaline. Adrenaline increases [cAMP]pm in the α-cell but does not affect basal [cAMP]pm in the β-cell. D: Immunostaining of dispersed islet cells showing that a small cell responding to adrenaline with [cAMP]pm elevation in panel C is a glucagon-positive α-cell. Scale bars, 10 μm. (A high-quality digital representation of this figure is available in the online issue.)
FIG. 2.
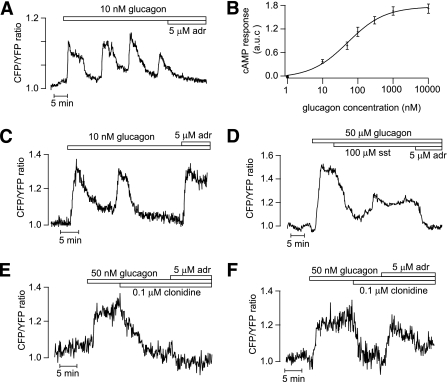
Glucagon triggers [cAMP]pm oscillations in islet α- and β-cells. TIRF microscopy recordings of [cAMP]pm in individual cells within an intact mouse pancreatic islet exposed to 3 mmol/L glucose. A: Oscillations of [cAMP]pm induced by 10 nmol/L glucagon in a β-cell identified by the [cAMP]pm-lowering effect of adrenaline (adr). B: Concentration-dependence of the glucagon-induced time-average [cAMP]pm elevation in islet β-cells. Means ± SEM for 3–12 cells at each concentration. C: [cAMP]pm oscillations induced by 10 nmol/L glucagon in an islet α-cell identified by the [cAMP]pm-elevating effect of adrenaline. D: Suppression of glucagon-induced [cAMP]pm elevation in an adrenaline-identified β-cell exposed to 100 nmol/L somatostatin (sst). E and F: Effect of 0.1 μmol/L clonidine on [cAMP]pm elevation induced by 50 nmol/L glucagon in a β-cell (E) and α-cell (F) identified by their responses to adrenaline.
Glucagon and GLP-1 trigger oscillations of [cAMP]pm in pancreatic islet cells.
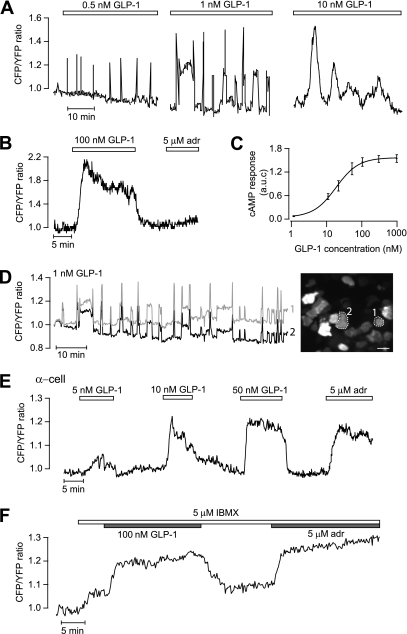
When mouse islets were exposed to glucagon in the presence of 3 mmol/L glucose, there was a prompt increase in [cAMP]pm with sustained elevation or oscillations in β-cells (36 of 41 [Fig. 2A]) and α-cells (5 of 8 [Fig. 2C]). In β-cells, the integrated response was half-maximal and maximal at 80 and 1,000 nmol/L glucagon, respectively (Fig. 2B). Somatostatin suppressed the glucagon-induced [cAMP]pm elevation in both β-cells (Fig. 2D) and α-cells (data not shown). Similar responses were seen with the α2-adrenoceptor agonist clonidine, which lowered [cAMP]pm in all of 11 β-cells (Fig. 2E) and 6 of 8 α-cells (Fig. 2F), indicating that both cell types express α2-receptors. However, adrenaline still caused elevation of [cAMP]pm in the α-cells, consistent with domination of β-adrenoceptors in this cell type (40). At concentrations of 0.5–10 nmol/L, GLP-1 induced [cAMP]pm oscillations in β-cells (Fig. 3A and D). The oscillatory pattern varied between different cells with frequencies ranging from 0.18 to 2.1 min−1 and amplitudes from 0.06 to 1.5 normalized ratio units. The amplitude and duration of individual oscillations tended to increase with GLP-1 concentration, as illustrated in Fig. 3A. High concentrations of GLP-1 (>50 nmol/L) induced prompt and sustained [cAMP]pm elevation in β-cells (19 of 23) that rapidly reversed upon omission of the peptide (Fig. 3B). Figure 3C shows the concentration dependence of the integrated [cAMP]pm response to GLP-1, with half-maximal and maximal effects at 30 and 300 nmol/L, respectively. The [cAMP]pm oscillations induced by GLP-1 were strikingly well synchronized among β-cells in the islet even between those lacking direct contact (Fig. 3D). Only occasional α-cells responded to GLP-1 with elevation of [cAMP]pm (5 of 48), and Fig. 3E shows a graded response to 5–50 nmol/L GLP-1 in one of these α-cells identified with adrenaline. To investigate whether the lack of response in many α-cells was because cAMP did not increase above the detection threshold, we exposed the cells to 5 μmol/L IBMX, which is at the border to give a detectable increase of [cAMP]pm. Of 21 adrenaline-identified α-cells, 10 responded to 5 μmol/L IBMX. Only two of those plus two of the IBMX-unresponsive α-cells reacted to 100 nmol/L GLP-1, and the [cAMP]pm increase was of a magnitude similar to that induced by adrenaline (Fig. 3F).
FIG. 3.
GLP-1 triggers [cAMP]pm oscillations that are synchronized between islet β-cells. TIRF microscopy recordings of [cAMP]pm in individual cells within an intact mouse pancreatic islet exposed to 3 mmol/L glucose. A: [cAMP]pm oscillations in a β-cell exposed to increasing concentrations of GLP-1 (the trace was interrupted between changes in GLP-1 concentration). The amplitude and duration of individual oscillations tended to increase with the GLP-1 concentration. B: Stable and reversible [cAMP]pm elevation in response to 100 nmol/L GLP-1 in a β-cell identified by the lack of adrenaline (adr) effect. C: Dose dependence of the GLP-1 induced time-average [cAMP]pm elevation in islet β-cells. Means ± SEM for 4–9 cells at each concentration. D: [cAMP]pm oscillations induced by 1 nmol/L GLP-1 are synchronized between β-cells lacking apparent direct contact. The recordings are from the two cells in the TIRF image encircled with broken lines. Scale bar, 10 μm. E: Example of a rare α-cell with dose-dependent [cAMP]pm elevations in response to GLP-1. F: GLP-1 response in an adrenaline-identified α-cell exposed to 5 μmol/L IBMX. (A high-quality digital representation of this figure is available in the online issue.)
Glucose triggers oscillations of [cAMP]pm in mouse islet β-cells.
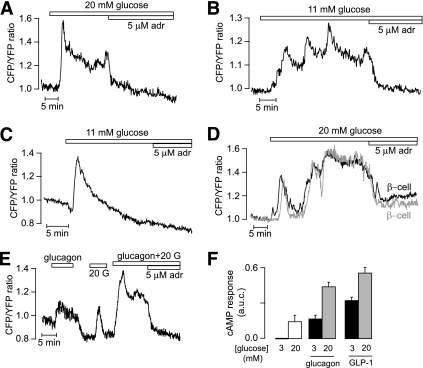
When the glucose concentration was elevated from 3 to 11, 20, or 30 mmol/L, most islet β-cells responded with a pronounced rise of [cAMP]pm followed by a stable plateau (16 of 41) or slow oscillations with frequencies in the 0.05–0.4/min range and amplitudes of 0.05–0.6 ratio units (21 of 41) (Fig. 4A and B). The remaining cells showed a single [cAMP]pm peak followed by return to the baseline (not shown). As previously described in isolated β-cells (12), the glucose-induced elevation of [cAMP]pm was preceded by a small reduction in many cells. This phenomenon is illustrated in Fig. 4C. Figure 4A–D also shows that adrenaline abolished the glucose-induced elevation of [cAMP]pm. Like the GLP-1–triggered oscillations of [cAMP]pm, those induced by glucose were often synchronized among β-cells within an islet (Fig. 4D). The glucose and hormone effects were additive, and the [cAMP]pm elevation induced by a combination of 20 mmol/L glucose and 10 nmol/L glucagon or 100 nmol/L GLP-1 was larger than the effect of either stimulus alone (Fig. 4E and F).
FIG. 4.
Glucose induces [cAMP]pm oscillations in islet β-cells. TIRF microscopy recordings of [cAMP]pm in individual cells within an intact mouse pancreatic islet. A and B: Stable elevation (A) and oscillations (B) of [cAMP]pm in response to a step increase of the glucose concentration from 3 to 11 or 20 mmol/L in β-cells identified by the [cAMP]pm-lowering effect of adrenaline (adr). C: [cAMP]pm recording showing that the initial glucose-induced [cAMP]pm elevation in β-cells is preceded by a slight lowering. D: Synchronization of the glucose-induced [cAMP]pm oscillations in two islet β-cells lacking apparent direct contact. E: Additive effect of 10 nmol/L glucagon and 20 mmol/L glucose (20 G) on [cAMP]pm in an islet β-cell. F: Means ± SEM for the average increases of [cAMP]pm induced by 20 mmol/L glucose alone and in combination with 10 nmol/L glucagon or 100 nmol/L GLP-1.
Ca2+ is not essential for glucose-induced [cAMP]pm oscillations.
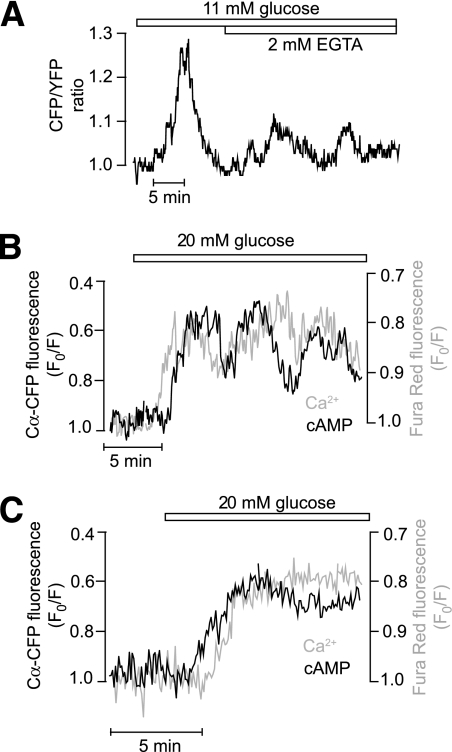
The amplitudes of the [cAMP]pm oscillations were significantly suppressed, but the oscillations often persisted after removal of Ca2+ and addition of 2 mmol/L EGTA to prevent changes in [Ca2+]i (4 of 6 cells) (Fig. 5A). The [Ca2+]i response of intact islets differs from that of isolated cells in displaying a pattern of rapid (2–4/min) regular oscillations that depends not only on Ca2+ influx but also on release from intracellular stores (2). Corresponding rapid oscillations of [cAMP]pm were never observed, even after elevating the extracellular Ca2+ concentration from 1.3 to 2.6 mmol/L (data not shown), which typically promotes the appearance of the fast Ca2+ pattern. Simultaneous measurements of [cAMP]pm and [Ca2+]pm in islet β-cells loaded with the fluorescent indicator Fura Red demonstrated that [cAMP]pm and [Ca2+]pm elevations were synchronized (Fig. 5B), but the temporal relationship of the initial glucose-induced [cAMP]pm and [Ca2+]pm elevations varied with [cAMP]pm, sometimes increasing before (Fig. 5C) and sometimes after (Fig. 5B) [Ca2+]pm. Together, these findings indicate that Ca2+ amplifies the [cAMP]pm response but that [Ca2+]i oscillations are not essential for glucose-induced oscillations of [cAMP]pm.
FIG. 5.
Glucose-induced [cAMP]pm oscillations in islet β-cells are not strictly dependent on Ca2+. A: TIRF microscopy recording from a mouse islet β-cell showing that glucose-induced [cAMP]pm oscillations persist in Ca2+-deficient medium containing 2 mmol/L EGTA. B and C: Simultaneous recordings of [cAMP]pm (black trace) and [Ca2+]pm (gray trace) in islet β-cells following a step increase of the glucose concentration from 3 to 20 mmol/L. Cells typically exhibited coordinated oscillations of the two messengers (B). [Ca2+]pm sometimes increased before (B) and sometimes after (C) [cAMP]pm. Islets expressing a modified cAMP sensor based on Cα-CFP translocation and nonfluorescent RIIβ-CAAX were loaded with the Ca2+ indicator Fura Red. The fluorescence traces have been inverted to show increase of [cAMP]pm and [Ca2+]pm as upward deflections.
Transmembrane ACs mediate cAMP formation in MIN6 and islet β-cells.
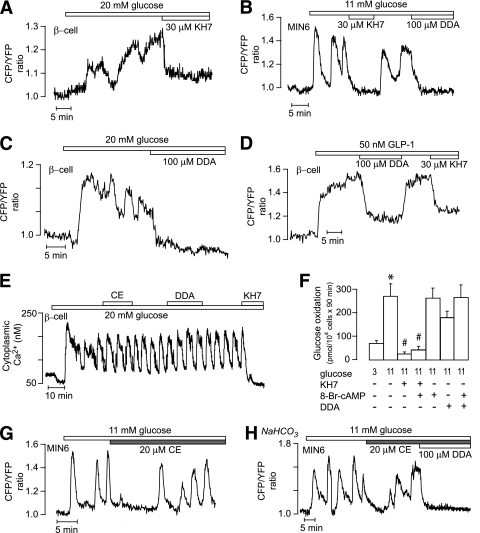
In both β-cells within islets (n = 4) (Fig. 6A) and MIN6 β-cells (n = 37) (Fig. 6B), the glucose-induced [cAMP]pm oscillations were completely inhibited by 30 μmol/L KH7, which has been described as a specific sAC inhibitor (41). Similar inhibition was obtained with 100 μmol/L of the tmAC inhibitor DDA in clonal (Fig. 6B) and primary (n = 5) (Fig. 6C) β-cells. Also, the [cAMP]pm elevation stimulated by 50 nmol/L GLP-1 was inhibited by both DDA and KH7 (n = 12) (Fig. 6D). However, whereas DDA was without effect on glucose-induced [Ca2+]i oscillations, KH7 completely abolished this response (n = 8) (Fig. 6E), indicating that the compound might interfere with upstream effects in glucose stimulus-secretion coupling. Indeed, KH7 (30 μmol/L) markedly suppressed glucose oxidation in MIN6 cells. This effect could not be attributed to lowering of cAMP because the effect was not reversed by addition of 10 mmol/L of the membrane-permeable analog 8-Br-cAMP. In contrast, a slight tendency of DDA to inhibit glucose oxidation was completely reversed by 8-Br-cAMP (Fig. 6F).
FIG. 6.
Glucose-induced [cAMP]pm formation in MIN6 and islet β-cells is mediated by transmembrane adenylyl cyclases. A–C: TIRF recordings from mouse islet β-cells (A and C) and a MIN6 cell (B) showing inhibition of glucose-induced [cAMP]pm oscillations by 30 μmol/L KH7 (A and B) and 100 μmol/L DDA (B and C). D: TIRF recording from an islet β-cell showing that 100 μmol/L DDA and 30 μmol/L KH7 suppresses the [cAMP]pm response to 50 nmol/L GLP-1. E: Epifluorescence recording of [Ca2+]i in a single mouse β-cell showing that oscillations triggered by 20 mmol/L glucose are unaffected by 20 μmol/L of the catechol estrogen compound [1,3,5(10)-estratrien-2,3,17 β-triol] (CE) and 100 μmol/L DDA but suppressed by 30 μmol/L KH7. F: Glucose oxidation in MIN6 β-cells exposed to 3 or 11 mmol/L glucose in the absence or presence of 30 μmol/L KH7, 10 mmol/L 8-Br-cAMP, and 100 μmol/L DDA. Means ± SEM for five experiments. *P < 0.001 for difference between 3 and 11 mmol/L glucose. #P < 0.001 for difference from 11 mmol/L glucose. G: TIRF recording from a single MIN6 β-cell showing the effect of 20 μmol/L CE on [cAMP]pm oscillations induced by 11 mmol/L glucose. H: TIRF recording of glucose-induced [cAMP]pm oscillations in a single MIN6 β-cell maintained in HCO3−-buffered medium and exposed to 20 μmol/L CE and 100 μmol/L DDA.
CE is an alternative inhibitor of sAC (42), and this compound was without effect on glucose-induced [Ca2+]i oscillations (Fig. 6E). In 60% of the MIN6 β-cells, CE caused temporary interruption of the [cAMP]pm oscillations, but after a few minutes, there were [cAMP]pm oscillations indistinguishable from those under control conditions (Fig. 6G). The interruption probably was not mediated by changes in cAMP, given that it was observed also with the inactive control compound 1,3,5(10)-estratrien-3,17-β-triol (data not shown). Similar results were obtained when the experiments were performed in medium containing 20 mmol/L NaHCO3, which promotes sAC activity (Fig. 6H).
Glucose-induced [cAMP]pm oscillations in α-cells.
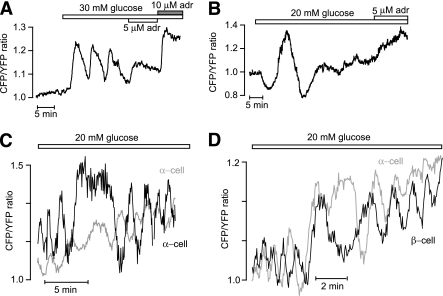
In the presence of 3–7 mmol/L glucose, [cAMP]pm was low and stable in α-cells identified by the adrenaline-induced [cAMP]pm elevation. However, like in β-cells, 11–30 mmol/L glucose triggered [cAMP]pm oscillations in many α-cells (3 of 11 at 11 mmol/L, 13 of 28 at 20 mmol/L, and 8 of 17 at 30 mmol/L glucose) (Fig. 7A). In some α-cells, the nadirs and peaks of the oscillations reflected inhibition and stimulation, respectively, in relation to the baseline (Fig. 7B). In the few islets that permitted analysis of the phase relationship of [cAMP]pm oscillations between different α-cells (n = 1) and between α-cells and β-cells (n = 4), there was no apparent synchronization of the oscillations (Fig. 7C and D).
FIG. 7.
Glucose stimulates [cAMP]pm oscillations in islet α-cells. TIRF microscopy recordings of [cAMP]pm in individual cells within intact mouse pancreatic islets. A: Oscillations of [cAMP]pm in response to a step increase of the glucose concentration from 3 to 30 mmol/L in an islet α-cell identified by [cAMP]pm elevation in response to adrenaline (adr). B: Example of an islet α-cell responding to a step increase of the glucose concentration from 3 to 20 mmol/L with [cAMP]pm oscillations showing both stimulatory and inhibitory components. C and D: Glucose-induced [cAMP]pm oscillations recorded from two individual α-cells (C) and one α- and one β-cell (D) within the same islet.
DISCUSSION
The current study uses a TIRF microscopy approach to investigate cAMP signaling in intact pancreatic islets. The method images the plasma membrane and submembrane cytoplasm of the different types of cells in the islet mantle in direct contact with the coverslip. Although innervation and normal microcirculation is lacking, the preparation allows analysis of cAMP signaling in cells able to interact within the micro-organ. Unfortunately, immunostaining could not be used to identify particular cells within an islet after the TIRF recording because the islets already detach from the coverslip during attempted fixation. Free islet cells attach more firmly, and it became apparent that immune-identified α- and β-cells displayed distinct [cAMP]pm responses to adrenaline, reflecting differences in adrenoceptor expression (40), and these responses were used for identification of the two cell types in the islet. Islets were isolated only from the parts of the pancreas where PP-cells are scarce (37), and it seems unlikely that δ-cells responding to adrenergic receptor activation with lowering of [cAMP]pm incorrectly have been taken for β-cells. The δ-cells are much less abundant and smaller than the β-cells. Small cells and cells with small footprints were not taken as β-cells irrespective of response.
As expected, glucagon and GLP-1 evoked cAMP signaling in the islets. However, whereas GLP-1 triggered [cAMP]pm oscillations in most β-cells, only occasional α-cells responded to the hormone with elevation of [cAMP]pm. It has been controversial whether GLP-1 receptors are present in α-cells. Some studies of rat α-cells have failed to demonstrate GLP-1 receptor expression (43,44) while others have shown that GLP-1 increases the cAMP content (35) and exocytosis (35,45). The present data from mouse α-cells is in line with observations that GLP-1 receptors are expressed only in a small subpopulation of rat (44) and mouse (36) α-cells. It is well accepted that GLP-1 is an inhibitor of glucagon secretion, but the underlying signaling is unclear. It was recently suggested that very small cAMP elevations inhibit glucagon secretion by a protein kinase A (PKA)-dependent mechanism (36). However, from the present data, GLP-1 inhibition of glucagon secretion seems to involve mechanisms other than changes of [cAMP]pm.
Glucagon elicited [cAMP]pm oscillations in most α- and β-cells. Given that cAMP is a positive modulator of glucagon secretion (23,24,34,35), our observations support a positive autocrine feedback effect of the hormone. The reason for the absence of [cAMP]pm oscillations in low glucose when glucagon secretion is stimulated is currently unknown. In islet β-cells, the cAMP responses to glucagon and GLP-1 were significantly enhanced by high glucose, as expected from earlier biochemical studies (17). Glucose alone also induced pronounced changes in [cAMP]pm, reminiscent of those of [Ca2+]i, with an initial lowering followed by a prominent rise. This rise may reflect both direct effects of glucose on the β-cell and an early peak of glucagon secretion within the islet (32,33). The period of the subsequent oscillations was usually several minutes, as in isolated cells (12), and faster oscillations typical for islet recordings of membrane potential and [Ca2+]i were not observed. Because Ca2+ is known to increase islet cAMP via Ca2+/calmodulin-sensitive ACs (17), it seems possible that the changes of [cAMP]pm are driven by those of [Ca2+]i (46). However, like in isolated β-cells (12), [cAMP]pm oscillations in intact islets often persisted when glucose-stimulated Ca2+ entry was prevented, and the cAMP signal sometimes preceded that of Ca2+ during the initial glucose-induced response. Comparable findings were reported using transgenic mouse islets expressing another cAMP sensor, with glucose-induced stable cAMP elevation preceding the increase of [Ca2+]i and persisting in the absence of extracellular Ca2+ (13). There are mutual interactions between cAMP and Ca2+, and both signals depend on intracellular ATP (12). ATP concentrations are in turn affected by Ca2+, and interestingly, oscillations in β-cell metabolism (47) show a Ca2+ dependence reminiscent of that of the presently observed cAMP oscillations. In light of these interactions, it is not surprising that there are slight variations in timing between the Ca2+ and cAMP signals.
Because the tmACs expressed in islets have in vitro Km values for ATP in the submillimolar range (48), it is not clear how they would be regulated by the approximately 10-fold higher concentrations of ATP in the cytoplasm. We now considered the possibility that glucose stimulates cAMP formation via sAC, which is regulated by bicarbonate, Ca2+, and millimolar concentrations of ATP (18,19,49) and which was recently proposed to be present in insulin-secreting cells (20). However, the small molecule inhibitor KH7 that is often used to define sAC activity (20,41) showed deleterious effects on β-cell metabolism, limiting its usefulness for studies of sAC in intact cells. The less selective sAC inhibitor CE failed to provide evidence that sAC mediates glucose-induced cAMP formation in the subplasma membrane space of insulin-secreting cells. Future studies will have to clarify which particular isoforms of tmACs sense changes in β-cell metabolism and how the additive effects of glucose and hormones on [cAMP]pm are mediated. Interestingly, although glucose is an inhibitor of glucagon secretion and cAMP stimulates exocytosis, glucose also triggered cAMP oscillations in α-cells. However, glucose-inhibited glucagon secretion is pulsatile, and the reduced time-average secretion in both rat (32) and human (33) islets is composed of alternating periods of inhibition and stimulation. The present findings are consistent with cAMP being involved in the stimulatory component, perhaps also explaining how very high glucose concentrations can paradoxically increase glucagon release (31).
Pulsatile hormone secretion from the intact islet obviously requires synchronization of the secretory activity among the cells within the islet. Functional coupling was indeed observed in GLP-1–stimulated β-cells, but the underlying mechanism is unknown. However, gap junction–mediated diffusional exchange and electrical coupling and the stimulatory action of Ca2+ on cAMP formation are factors favoring cAMP signal propagation and synchronization between cells within functional islet subdomains. The synchronization was less striking during glucose stimulation, possibly because paracrine influences become perturbed by insufficient exchange of superfusion medium around the islet cells adhering to the coverslip. Not only do glucose and glucagon independently evoke [cAMP]pm oscillations in α- and β-cells, but somatostatin, whose secretion is stimulated by glucose and glucagon (50), suppresses cAMP levels in these cells. In summary, we found that the cAMP signaling properties of isolated β-cells are maintained when they are located within the intact pancreatic islet. Moreover, we discovered that glucose and glucagon induce [cAMP]pm oscillations in α-cells. Clarification of the temporal relationship of cAMP signaling in α- and β-cells will help to explain the generation of antisynchronous pulses of insulin and glucagon underlying the 20- to 100-fold changes in insulin-to-glucagon ratio (33) that determine glucose homeostasis in the liver.
ACKNOWLEDGMENTS
This work was supported by a European Foundation for the Study of Diabetes/MSD grant as well as by grants from the Family Ernfors Foundation, the Magnus Bergvall’s Foundation, the Swedish Diabetes Association, and the Swedish Research Council (67X-14643, 67P-21262, and 12X-6240). This work was also supported by a grant from the Novo Nordisk Foundation.
No other potential conflicts of interest relevant to this article were reported.
G.T. performed all of the experiments, analyzed data, and reviewed and edited the manuscript. S.S. contributed to glucose oxidation experiments and discussion of results and reviewed and edited the manuscript. E.G. contributed to discussion of results and reviewed and edited the manuscript. A.T. contributed to discussion and wrote the manuscript.
The authors thank Drs. Jochen Buck and Lonnie Levin (Department of Pharmacology, Weill Medical College, Cornell University, Ithaca, New York) for the gift of KH7 and Jun-Ichi Miyazaki (Division of Stem Cell Regulation Research, Osaka University Medical School, Osaka) for MIN6 β-cells. The authors are indebted to Ing-Marie Mörsare, Ing-Britt Hallgren, and Heléne Dansk (Department of Medical Cell Biology, Uppsala University, Uppsala, Sweden) for skillful technical assistance.
REFERENCES
- 1.Ashcroft FM, Rorsman P. Electrophysiology of the pancreatic β-cell. Prog Biophys Mol Biol 1989;54:87–143 [DOI] [PubMed] [Google Scholar]
- 2.Tengholm A, Gylfe E. Oscillatory control of insulin secretion. Mol Cell Endocrinol 2009;297:58–72 [DOI] [PubMed] [Google Scholar]
- 3.Henquin JC. Regulation of insulin secretion: a matter of phase control and amplitude modulation. Diabetologia 2009;52:739–751 [DOI] [PubMed] [Google Scholar]
- 4.Ammälä C, Ashcroft FM, Rorsman P. Calcium-independent potentiation of insulin release by cyclic AMP in single β-cells. Nature 1993;363:356–358 [DOI] [PubMed] [Google Scholar]
- 5.Dyachok O, Gylfe E. Ca2+-induced Ca2+ release via inositol 1,4,5-trisphosphate receptors is amplified by protein kinase A and triggers exocytosis in pancreatic β-cells. J Biol Chem 2004;279:45455–45461 [DOI] [PubMed] [Google Scholar]
- 6.Gillis KD, Misler S. Enhancers of cytosolic cAMP augment depolarization-induced exocytosis from pancreatic B-cells: evidence for effects distal to Ca2+ entry. Pflugers Arch 1993;424:195–197 [DOI] [PubMed] [Google Scholar]
- 7.Renström E, Eliasson L, Rorsman P. Protein kinase A-dependent and -independent stimulation of exocytosis by cAMP in mouse pancreatic B-cells. J Physiol 1997;502:105–118 [DOI] [PMC free article] [PubMed] [Google Scholar]
- 8.Ozaki N, Shibasaki T, Kashima Y, et al. cAMP-GEFII is a direct target of cAMP in regulated exocytosis. Nat Cell Biol 2000;2:805–811 [DOI] [PubMed] [Google Scholar]
- 9.Dyachok O, Isakov Y, Sågetorp J, Tengholm A. Oscillations of cyclic AMP in hormone-stimulated insulin-secreting β-cells. Nature 2006;439:349–352 [DOI] [PubMed] [Google Scholar]
- 10.Schuit FC, Pipeleers DG. Regulation of adenosine 3′,5′-monophosphate levels in the pancreatic B cell. Endocrinology 1985;117:834–840 [DOI] [PubMed] [Google Scholar]
- 11.Landa LR, Jr, Harbeck M, Kaihara K, et al. Interplay of Ca2+ and cAMP signaling in the insulin-secreting MIN6 β-cell line. J Biol Chem 2005;280:31294–31302 [DOI] [PMC free article] [PubMed] [Google Scholar]
- 12.Dyachok O, Idevall-Hagren O, Sågetorp J, et al. Glucose-induced cyclic AMP oscillations regulate pulsatile insulin secretion. Cell Metab 2008;8:26–37 [DOI] [PubMed] [Google Scholar]
- 13.Kim JW, Roberts CD, Berg SA, Caicedo A, Roper SD, Chaudhari N. Imaging cyclic AMP changes in pancreatic islets of transgenic reporter mice. PLoS ONE 2008;3:e2127. [DOI] [PMC free article] [PubMed] [Google Scholar]
- 14.Idevall-Hagren O, Barg S, Gylfe E, Tengholm A. cAMP mediators of pulsatile insulin secretion from glucose-stimulated single β-cells. J Biol Chem 2010;285:23007–23018 [DOI] [PMC free article] [PubMed] [Google Scholar]
- 15.Drucker DJ. The biology of incretin hormones. Cell Metab 2006;3:153–165 [DOI] [PubMed] [Google Scholar]
- 16.Leech CA, Castonguay MA, Habener JF. Expression of adenylyl cyclase subtypes in pancreatic β-cells. Biochem Biophys Res Commun 1999;254:703–706 [DOI] [PubMed] [Google Scholar]
- 17.Delmeire D, Flamez D, Hinke SA, Cali JJ, Pipeleers D, Schuit F. Type VIII adenylyl cyclase in rat beta cells: coincidence signal detector/generator for glucose and GLP-1. Diabetologia 2003;46:1383–1393 [DOI] [PubMed] [Google Scholar]
- 18.Chen Y, Cann MJ, Litvin TN, et al. Soluble adenylyl cyclase as an evolutionarily conserved bicarbonate sensor. Science 2000;289:625–628 [DOI] [PubMed] [Google Scholar]
- 19.Jaiswal BS, Conti M. Calcium regulation of the soluble adenylyl cyclase expressed in mammalian spermatozoa. Proc Natl Acad Sci USA 2003;100:10676–10681 [DOI] [PMC free article] [PubMed] [Google Scholar]
- 20.Ramos LS, Zippin JH, Kamenetsky M, Buck J, Levin LR. Glucose and GLP-1 stimulate cAMP production via distinct adenylyl cyclases in INS-1E insulinoma cells. J Gen Physiol 2008;132:329–338 [DOI] [PMC free article] [PubMed] [Google Scholar]
- 21.Barg S, Galvanovskis J, Göpel SO, Rorsman P, Eliasson L. Tight coupling between electrical activity and exocytosis in mouse glucagon-secreting α-cells. Diabetes 2000;49:1500–1510 [DOI] [PubMed] [Google Scholar]
- 22.Vieira E, Salehi A, Gylfe E. Glucose inhibits glucagon secretion by a direct effect on mouse pancreatic alpha cells. Diabetologia 2007;50:370–379 [DOI] [PubMed] [Google Scholar]
- 23.Johansson H, Gylfe E, Hellman B. Cyclic AMP raises cytoplasmic calcium in pancreatic α2-cells by mobilizing calcium incorporated in response to glucose. Cell Calcium 1989;10:205–211 [DOI] [PubMed] [Google Scholar]
- 24.Vieira E, Liu YJ, Gylfe E. Involvement of α1 and β-adrenoceptors in adrenaline stimulation of the glucagon-secreting mouse α-cell. Naunyn Schmiedebergs Arch Pharmacol 2004;369:179–183 [DOI] [PubMed] [Google Scholar]
- 25.Ravier MA, Rutter GA. Glucose or insulin, but not zinc ions, inhibit glucagon secretion from mouse pancreatic α-cells. Diabetes 2005;54:1789–1797 [DOI] [PubMed] [Google Scholar]
- 26.Starke A, Imamura T, Unger RH. Relationship of glucagon suppression by insulin and somatostatin to the ambient glucose concentration. J Clin Invest 1987;79:20–24 [DOI] [PMC free article] [PubMed] [Google Scholar]
- 27.Wendt A, Birnir B, Buschard K, et al. Glucose inhibition of glucagon secretion from rat α-cells is mediated by GABA released from neighboring β-cells. Diabetes 2004;53:1038–1045 [DOI] [PubMed] [Google Scholar]
- 28.Ishihara H, Maechler P, Gjinovci A, Herrera PL, Wollheim CB. Islet β-cell secretion determines glucagon release from neighbouring α-cells. Nat Cell Biol 2003;5:330–335 [DOI] [PubMed] [Google Scholar]
- 29.Le Marchand SJ, Piston DW. Glucose suppression of glucagon secretion: metabolic and calcium responses from α-cells in intact mouse pancreatic islets. J Biol Chem 2010;285:14389–14398 [DOI] [PMC free article] [PubMed] [Google Scholar]
- 30.Göpel SO, Kanno T, Barg S, Weng XG, Gromada J, Rorsman P. Regulation of glucagon release in mouse α-cells by KATP channels and inactivation of TTX-sensitive Na+ channels. J Physiol 2000;528:509–520 [DOI] [PMC free article] [PubMed] [Google Scholar]
- 31.Salehi A, Vieira E, Gylfe E. Paradoxical stimulation of glucagon secretion by high glucose concentrations. Diabetes 2006;55:2318–2323 [DOI] [PubMed] [Google Scholar]
- 32.Grapengiesser E, Salehi A, Qader SS, Hellman B. Glucose induces glucagon release pulses antisynchronous with insulin and sensitive to purinoceptor inhibition. Endocrinology 2006;147:3472–3477 [DOI] [PubMed] [Google Scholar]
- 33.Hellman B, Salehi A, Gylfe E, Dansk H, Grapengiesser E. Glucose generates coincident insulin and somatostatin pulses and antisynchronous glucagon pulses from human pancreatic islets. Endocrinology 2009;150:5334–5340 [DOI] [PubMed] [Google Scholar]
- 34.Gromada J, Bokvist K, Ding WG, et al. Adrenaline stimulates glucagon secretion in pancreatic A-cells by increasing the Ca2+ current and the number of granules close to the L-type Ca2+ channels. J Gen Physiol 1997;110:217–228 [DOI] [PMC free article] [PubMed] [Google Scholar]
- 35.Ma X, Zhang Y, Gromada J, et al. Glucagon stimulates exocytosis in mouse and rat pancreatic α-cells by binding to glucagon receptors. Mol Endocrinol 2005;19:198–212 [DOI] [PubMed] [Google Scholar]
- 36.De Marinis YZ, Salehi A, Ward CE, et al. GLP-1 inhibits and adrenaline stimulates glucagon release by differential modulation of N- and L-type Ca2+ channel-dependent exocytosis. Cell Metab 2010;11:543–553 [DOI] [PMC free article] [PubMed] [Google Scholar]
- 37.Liu YJ, Hellman B, Gylfe E. Ca2+ signaling in mouse pancreatic polypeptide cells. Endocrinology 1999;140:5524–5529 [DOI] [PubMed] [Google Scholar]
- 38.Andersson A, Sandler S. Viability tests of cryopreserved endocrine pancreatic cells. Cryobiology 1983;20:161–168 [DOI] [PubMed] [Google Scholar]
- 39.Liu YJ, Vieira E, Gylfe E. A store-operated mechanism determines the activity of the electrically excitable glucagon-secreting pancreatic α-cell. Cell Calcium 2004;35:357–365 [DOI] [PubMed] [Google Scholar]
- 40.Schuit FC, Pipeleers DG. Differences in adrenergic recognition by pancreatic A and B cells. Science 1986;232:875–877 [DOI] [PubMed] [Google Scholar]
- 41.Hess KC, Jones BH, Marquez B, et al. The “soluble” adenylyl cyclase in sperm mediates multiple signaling events required for fertilization. Dev Cell 2005;9:249–259 [DOI] [PMC free article] [PubMed] [Google Scholar]
- 42.Braun T. Inhibition of the soluble form of testis adenylate cyclase by catechol estrogens and other catechols. Proc Soc Exp Biol Med 1990;194:58–63 [DOI] [PubMed] [Google Scholar]
- 43.Franklin I, Gromada J, Gjinovci A, Theander S, Wollheim CB. β-cell secretory products activate α-cell ATP-dependent potassium channels to inhibit glucagon release. Diabetes 2005;54:1808–1815 [DOI] [PubMed] [Google Scholar]
- 44.Heller RS, Kieffer TJ, Habener JF. Insulinotropic glucagon-like peptide I receptor expression in glucagon-producing alpha-cells of the rat endocrine pancreas. Diabetes 1997;46:785–791 [DOI] [PubMed] [Google Scholar]
- 45.Ding WG, Renström E, Rorsman P, Buschard K, Gromada J. Glucagon-like peptide I and glucose-dependent insulinotropic polypeptide stimulate Ca2+-induced secretion in rat alpha-cells by a protein kinase A-mediated mechanism. Diabetes 1997;46:792–800 [DOI] [PubMed] [Google Scholar]
- 46.Fridlyand LE, Harbeck MC, Roe MW, Philipson LH. Regulation of cAMP dynamics by Ca2+ and G protein-coupled receptors in the pancreatic β-cell: a computational approach. Am J Physiol Cell Physiol 2007;293:C1924–C1933 [DOI] [PubMed] [Google Scholar]
- 47.Merrins MJ, Fendler B, Zhang M, Sherman A, Bertram R, Satin LS. Metabolic oscillations in pancreatic islets depend on the intracellular Ca2+ level but not Ca2+ oscillations. Biophys J 2010;99:76–84 [DOI] [PMC free article] [PubMed] [Google Scholar]
- 48.Davis B, Lazarus NR. Insulin release from mouse islets. Effect of glucose and hormones on adenylate cyclase. Biochem J 1972;129:373–379 [DOI] [PMC free article] [PubMed] [Google Scholar]
- 49.Litvin TN, Kamenetsky M, Zarifyan A, Buck J, Levin LR. Kinetic properties of “soluble” adenylyl cyclase. Synergism between calcium and bicarbonate. J Biol Chem 2003;278:15922–15926 [DOI] [PubMed] [Google Scholar]
- 50.Weir GC, Samols E, Day JA, Jr, Patel YC. Glucose and glucagon stimulate the secretion of somatostatin from the perfused canine pancreas. Metabolism 1978;27(Suppl. 1):1223–1226 [DOI] [PubMed] [Google Scholar]


