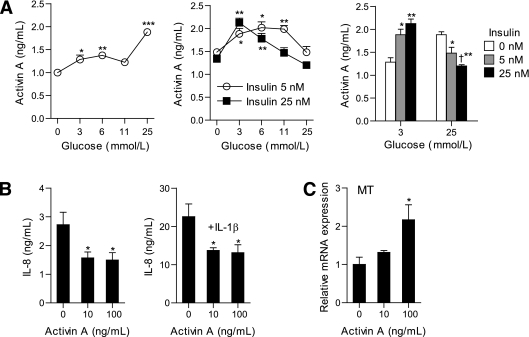
FIG. 4.
Interaction between activin A and endothelial cells.A: The effect of various concentrations of glucose, insulin, or a combination thereof on activin A levels in HUVEC supernatants after culturing for 48 h as assessed by EIA measurements. Data are mean ± SEM (n = 4). *P < 0.05, **P < 0.01, and ***P < 0.001 vs. no glucose (two left panels). *P < 0.05 and **P < 0.01 vs. no insulin. †P < 0.05 vs. 5 nmol/L insulin (right panel). The effect of different concentrations of activin A on the spontaneous and IL-1β–stimulated (5 ng/mL) release of IL-8 (B) and the unstimulated expression of metallothionein (C) after culturing for 24 and 4 h, respectively. IL-8 was measured by EIA, and metallothionein was assessed by RT-PCR in relation to the control gene β-actin. Data are mean ± SEM (n = 5). *P < 0.05 vs. unstimulated (or IL-1β–stimulated) cells. MT, metallothionein.

