Abstract
Purpose: A recently completed Phase I clinical trial combined concurrent Mitomycin-C chemotherapy with deep regional heating using BSD-2000 Sigma-Ellipse applicator (BSD Corporation, Salt Lake City, UT, U.S.A.) for the treatment of nonmuscle invasive bladder cancer. This work presents a new treatment planning approach, and demonstrates potential impact of this approach on improvement of treatment quality.
Methods: This study retrospectively analyzes a subset of five patients on the trial. For each treatment, expert operators selected “clinical-optimal” settings based on simple model calculation on the BSD-2000 control console. Computed tomography (CT) scans acquired prior to treatment were segmented to create finite element patient models for retrospective simulations with Sigma-HyperPlan (Dr. Sennewald Medizintechnik GmbH, Munchen, Germany). Since Sigma-HyperPlan does not account for the convective nature of heat transfer within a fluid filled bladder, an effective thermal conductivity for bladder was introduced. This effective thermal conductivity value was determined by comparing simulation results with clinical measurements of bladder and rectum temperatures. Regions of predicted high temperature in normal tissues were compared with patient complaints during treatment. Treatment results using “computed-optimal” settings from the planning system were compared with clinical results using clinical-optimal settings to evaluate potential of treatment improvement by reducing hot spot volume.
Results: For all five patients, retrospective treatment planning indicated improved matches between simulated and measured bladder temperatures with increasing effective thermal conductivity. The differences were mostly within 1.3 °C when using an effective thermal conductivity value above 10 W/K/m. Changes in effective bladder thermal conductivity affected surrounding normal tissues within a distance of ∼1.5 cm from the bladder wall. Rectal temperature differences between simulation and measurement were large due to sensitivity to the sampling locations in rectum. The predicted bladder T90 correlated well with single-point bladder temperature measurement. Hot spot locations predicted by the simulation agreed qualitatively with patient complaints during treatment. Furthermore, comparison between the temperature distributions with clinical and computed-optimal settings demonstrated that the computed-optimal settings resulted in substantially reduced hot spot volumes.
Conclusions: Determination of an effective thermal conductivity value for fluid filled bladder was essential for matching simulation and treatment temperatures. Prospectively planning patients using the effective thermal conductivity determined in this work can potentially improve treatment efficacy (compared to manual operator adjustments) by potentially lower discomfort from reduced hot spots in normal tissue.
Keywords: treatment planning, deep regional hyperthermia, bladder cancer, effective thermal conductivity, optimization
INTRODUCTION
Transurethral resection of bladder tumors (TURBT) is the primary treatment option for nonmuscle invasive bladder cancer.1, 2, 3 Intravesical chemotherapy or immunotherapy with bacillus Calmette-Guerin is a popular adjuvant treatment following TURBT to reduce tumor progression and recurrence.1, 2 However, patients undergoing standard treatment suffer from a high rate of recurrence.2, 3, 4 Compared to chemotherapy alone, both progression and recurrence of bladder carcinoma were better controlled by using a combination of heat and chemotherapy.2, 4 The rationale behind this could be the increased rate of drug uptake due to increased permeability of the tumor cell membrane with heating.5 Therapeutic heating of the anticancer agent can be accomplished by intracavitary irrigation with warmed saline (43–45 °C)6 or by delivering a properly focused power deposition pattern using ultrasound7 or electromagnetic (EM) waves, which penetrates heat further into and around the bladder wall than heated saline irrigation.1, 5, 8
Treatment planning based on both specific absorption rate (SAR) and temperature-based optimization has been used to provide better targeted heating in various sites.9, 10, 11 Treatment planning that enhances the ability to focus heat at the bladder has also been reported. For example, van Dijk et al.12 showed increased bladder SAR using treatment planning to optimize the SAR distribution in a selected two-dimensional plane. However, the treatment planning software developed by van Dijk et al.,12 also used by Rietbroek et al.,13 restricted optimization to a single plane. It was not possible with this planning method to evaluate the treatment using three dimensional (3D) treatment statistics of the target temperatures or hot spot occurrences in normal tissues.
This study qualitatively and quantitatively assesses, in five bladder patients, the utility of treatment planning for EM heating with a commercial radiofrequency phased array applicator with four twin-dipole antennas (Sigma-Ellipse, BSD Corporation, Salt Lake City, UT, U.S.A.). Actual treatments used expert operator input with patient verbal feedback to steer heating toward the bladder. Guidance was provided by the simple computer model available on the control console (2D, elliptical, homogeneous muscle-equivalent model) and intracavitary temperature probes inserted in the bladder and rectum. For comparison, computed tomography (CT)-based treatment planning simulations were carried out retrospectively using the Sigma-HyperPlan® system (Dr Sennewald Medizintechnik GmbH, Munchen, Germany). By matching simulation results to temperatures measured during clinical treatments, an effective thermal conductivity14, 15, 16, 17, 18, 19, 20, 21, 22, 23 was determined for the fluid filled bladder. This effective bladder thermal conductivity mimics the combined convective/conductive heat transfer from the spatially nonuniform heating in the anticancer drug/urine mixture in bladder. Effects and physical implications of varying the effective bladder thermal conductivity are demonstrated by target treatment statistics such as maximum, minimum, median temperatures, T90, as well as spatial temperature distribution profiles across the bladder and surrounding tissue region. The potential to improve treatment delivery by employing treatment planning with an effective bladder thermal conductivity was investigated.
METHODS AND MATERIALS
Hyperthermia treatment procedure
Eligible patients were enrolled on an Institutional Review Board (IRB) approved Phase I clinical trial for heating in combination with intravesical Mitomycin-C chemotherapy (MMC; Kyowa Hakko Kogyo Co. Ltd., Tokyo, Japan). A CT scan (GE Healthcare, Milwaukee, WI) was performed for each patient prior to the first thermochemotherapy treatment for the purpose of patient treatment positioning, bladder Foley and rectal catheters (for temperature measurement) localization, and planning for clinical study. The origin of the CT scan, i.e., the CT zero plane, was marked on the anterior and lateral surfaces of the patient body. Subsequently, the geometric center of the bladder was determined and the shift from the CT zero plane recorded and also marked on skin on the anterior and lateral surfaces. Patient dimensions in the anterior–posterior and lateral directions were recorded.
The BSD-2000 deep hyperthermia system (BSD Medical Corporation, Salt Lake, UT, USA) includes a control console with software to help users determine initial applicator settings that are subsequently manually adjusted during treatment based on feedback from intracavitary and surface temperature probes, and patient comments. The software assumes a homogeneous muscle-equivalent “generic patient” two-dimensional model with elliptical shape specified by the operator to match the measured patient cross-section dimensions. Users assign a focal position within the model corresponding to the approximate bladder location and the software determines the corresponding amplitudes and phases of the four antenna pairs to focus SAR at that position. A simulated SAR plot for the central cross-section is then displayed on the treatment planning screen. The user can adjust the four magnitudes, phases, and frequencies until the resulting SAR pattern is satisfactory. Multiple possible treatment plans can be established prior to treatment and saved in the setup file for possible use, and each preplan can be modified in real time during treatment.
The Sigma-Ellipse applicator has four twin-dipole antennas arranged on an elliptical Plexiglas shell. The applicator includes a flexible coupling bolus, which is filled with distilled water at approximately 25 °C for impedance match of the EM waves and for thermal cooling of the skin. The paired-antennas are driven with independent power and phase adjustments from four amplifier channels (operating frequency: 80–120 MHz). The five patients were treated primarily at 90 MHz, though frequencies were varied between 85 and 100 MHz during treatment for improved patient comfort or improved differential heating of bladder over rectum or abdominal tissue.
In preparation for treatment, temperature probes (high resistance lead thermistors, BSD Medical Corporation) were placed in the bladder Foley and in two rectal catheters, one fixed at the tip of a catheter and the second pulled by the BSD thermal mapping motor at 1 cm increments along the other rectal catheter at 5-min intervals. The bladder Foley and rectal catheters have high contrast with surrounding tissues on the CT images; consequently, locations of the temperature probes in the bladder/rectum were easily determined. Additional temperature probes of the same type were used to monitor oral (core) temperature and skin temperatures near the spine and on the abdomen, buttocks, and upper inner thigh locations. The precision and accuracy of the high resistance lead thermistor probes was ±0.1 °C and ±0.25 °C, respectively. After positioning the patient inside the applicator, placing all temperature probes and filling the water bolus, prewarmed MMC was instilled into the bladder. RF power was turned on using the pretreatment plan settings from the 2D BSD computer model and then adjusted by the experienced user (“clinical-optimal” settings) with feedback from temperature probes and patient comments. The Foley temperature sensor was the sole measure of intrabladder (fluid inside the bladder) temperature and was used to control overall power, aiming for bladder temperatures in the range 42 ± 2 °C for the 1 h treatment. During treatment, system frequency, total power as well as applicator magnitude and phase settings (phase adjustments were the majority) were adjusted based on patient discomfort indications and temperatures recorded via the thermal probes. The bladder with MMC solution was heated to a temperature above 40 °C for at least 40 min (but with the total time of RF power limited to a maximum of 60 min). The protocol required that RF power be halted after 15–20 min above 40 °C and water drained from the bolus so the patient could move left-to-right to allow the drug to bathe all surfaces of the bladder. Power was off for approximately 5 min before refilling the bolus and resuming RF heating. In general, the bladder/MMC temperature remained above 40 °C throughout this short interruption in power. RF power was turned off after either 60 min above 40 °C in the bladder target, or 60 min of total RF power-on time. At the end of treatment, the solution was left inside the bladder until temperature dropped below 40 °C, generally within 10 min of power off.
Retrospective treatment planning
Sigma-HyperPlan is a commercial software product used for hyperthermia treatment planning24, 25, 26 built on the modular platform Amira (Visage Image, Inc., San Diego, CA, USA), which includes algorithms for medical image processing, geometric modeling, and graphic display. The calculation engine in Sigma-Hyperplan uses finite element (FE) or finite-difference time-domain (FDTD) methods to solve Maxwell’s equations on tetrahedral grids generated from segmented tissues on CT or MR image data. The temperature distribution within the grid is then calculated by solving the bioheat transfer equation with the FE method. After completion of electrical field and temperature calculations, SAR-based or temperature-based optimizations can be carried out to obtain the optimal applicator magnitude and phase settings.
Retrospective treatment planning consisted of the following aspects (in a chronicle order in treatment planning with Sigma-Hyperplan): (a) detailed segmentation of the patient model from the initial CT scan series, (b) patient positioning within the BSD-2000 applicator in Sigma-HyperPlan, (c) assignment of realistic tissue dielectric/thermal properties, (d) modeling effective bladder thermal conductivity to account for convective/conductive effects in the drug/urine mixture, (e) computation of net RF power input to each antenna feed point, and (f) location of temperature measurement points corresponding to clinical configuration. These aspects are covered in the following sections.
Detailed segmentation
Patient CT images were imported and segmented in Sigma-Hyperplan. Three tissue types, including muscle, fat and bone were first automatically contoured with standard threshold levels for these three tissues and were then manually refined for patient model reconstruction. The bladder was manually segmented and was named “target” for treatment and muscle and fat tissues surrounding the bladder were well differentiated in the contouring. The bladder wall was the target site in the hyperthermia treatment. However, since the bladder wall is only a few millimeters thick when filled with fluid, it was not segmented and modeled in the treatment planning. Rather, the whole bladder was considered as target. During treatment, as the bladder fluid temperature increased, the temperature of the bladder wall was assumed to equilibrate with the adjacent fluid due to heat conduction and convection, especially in the steady state condition. Hereafter, “bladder” refers to the bladder fluid content.
Patient positioning
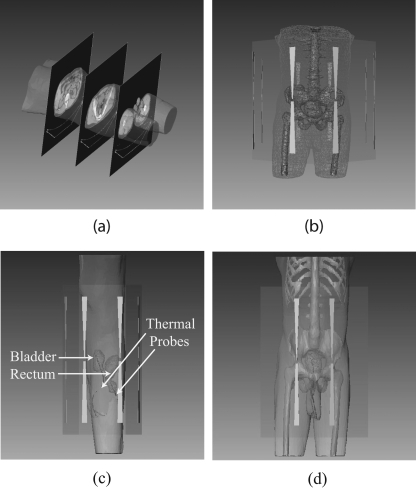
The BSD2000 external applicator position relative to the patient model was set according to the clinical setup at treatment. The center of the bladder was aligned with the center of antenna pairs in the longitudinal direction; the distance between the anterior flat surface of the applicator and patient chest wall was set at 6 cm. The patient model was centered in the lateral and A-P directions. A water bolus (used for impedance matching and skin cooling during the treatment) was simulated between the patient body model and applicator. Unstructured three dimensional tetrahedral meshes for FE simulations were created for the patient, water bolus, applicator, and surrounding air (a total of 78 000–112 000 tetrahedrons, depending on the patient size). A typical patient model within the BSD2000 Sigma-Ellipse applicator is shown in Fig. 1.
Figure 1.
(a) CT images of a patient and the reconstructed (transparent) patient model. (b) Patient model inside the BSD-2000 Sigma-Ellipse applicator showing the body outlines, bones, and bladder. (c), (d) Illustration of bladder (target) and rectum and the temperature probes inside them.
Tissue dielectric/thermal/blood properties
The dielectric properties (relative permittivity and conductivity, at a frequency of 90 MHz) and thermal properties (specific heat and thermal conductivity) used for muscle, fat, and bone27, 28, 29, 30, 31 are shown in Table TABLE I.. Bladder fluid dielectric properties were obtained from measurement of MMC/urine mixture after the treatment. Samples of MMC/urine mixture were collected in containers and measured with a high temperature impedance probe (Model 85070C, HP/Agilent Corp, Santa Clara CA) in conjunction with a microwave vector network analyzer (Model E5071C, Agilent Corp, Santa Clara CA). The measured dielectric property values at 90 MHz were assigned as bladder dielectric properties. The specific heat of the bladder content was assumed equal to that of water.
TABLE I.
Tissue properties used in simulation.
| Tissue type | Density (kg/m3) | Relative permittivity | Conductivity (S/m) | Specific heat (J/kg/K) | Thermal conductivity (W/K/m) |
|---|---|---|---|---|---|
| Muscle | 1060 | 67.2 | 0.79 | 3600 | 0.50 |
| Fat | 900 | 6.2 | 0.04 | 2430 | 0.21 |
| Bone | 1600 | 15.6 | 0.06 | 1300 | 0.436 |
| Bladder | 1000 | 81.8 | 1.81 | 4181 | keff |
| Material type | |||||
| Air | 1.025 | 1 | 0 | 1005 | 0.026 |
| Plastic | 1200 | 2.8 | 0 | 1050 | 0.24 |
| Water bolus | 1000 | 78.4 | 0.004 | 4181 | 0.642 |
Aside from conduction, heat is removed via blood perfusion, assumed to be at a relatively constant incoming temperature of 37 °C. Heat dissipation via perfusion is dependent on blood density32 (1060 kg/m3), blood specific heat33 (3600 J/kg/K), and flow rate. Flow rate was assumed to be temperature-independent but tissue-dependent (Table TABLE II.).33 Temperature dependent flow rate changes were not modeled due to the lack of definitive models in literature.
TABLE II.
Constant tissue blood perfusions.
| Tissue type | Blood perfusion (ml/100 g/min) |
|---|---|
| Muscle | 12.4 |
| Fat | 3.4 |
| Bone | 1.9 |
Effective bladder thermal conductivity
During hyperthermia treatment of nonmuscle invasive bladder cancer treatment, convection inside the bladder due to nonuniform heating of the MMC/urine mixture is combined with conduction through the bladder wall. Since it is complicated to directly model this combined convective/conductive phenomenon, an effective bladder thermal conductivity was introduced in the planning. In essence, this parameter lumped together conduction and convection effects. This approach has been widely used in combining the effect of conduction and convection in small and large blood vessels (14–23) including the effect of heat transfer through thin vessel walls, similar to the thermal dynamics in bladder.
For heat transfer of human tissues with blood flow, the Pennes bioheat equation is well established34
| (1) |
where ρ, C, and k are the density (), the specific heat [], and the thermal conductivity of the tissue [], while , , and are tissue volumetric perfusion rate [], blood specific heat and blood temperature. Q is the volumetric heat production () by external heating and metabolism, and in hyperthermia, metabolism is negligible. It should be noted that k is the commonly accepted thermal conductivity for all tissues except the bladder, where is used instead.
Net RF power at antenna feed points
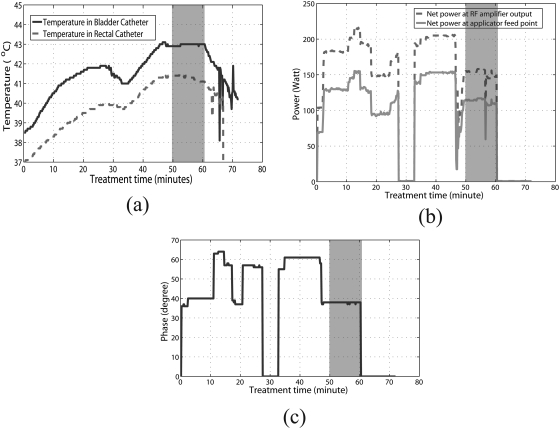
The antenna settings entered manually into the control program by the operator during treatment were the magnitudes and phases at the RF amplifier output. Losses incurred during transmission through the cables connecting the amplifiers to the RF feed point on each antenna, as well as reflected power, result in an overall reduction in actual power delivered to the dipole antenna feedpoints inside the applicator. To obtain the net input power at the feed points, treatment history data were used to extract treatment time, temperatures measured from all probes at various locations, powers (forward, reflected, and averaged) and phases in each channel at the RF amplifier output (Fig. 2). The net power at the feed point for each antenna was computed as: , where PN, PF, and PR are the net, forward, and reflected powers measured at the amplifier, and is the measured cable attenuation using port extension mode in a microwave vector network analyzer (Model E5071C, Agilent Corp, Santa Clara CA).
Figure 2.
(a) Measured bladder (solid line) and rectal (dashed line) temperatures as a function of time in the thermochemotherapy treatment. (b) Net power at the RF amplifier output (dashed line), net power at the applicator feed point (solid line), and (c) phase information as a function of treatment time. Note that (b) and (c) are for just one of the four antennas of the applicator.
To compare the measured and simulated temperatures, the net input power and phase at each channel of the applicator during treatment were input to the Hyperplan planning system (both input power and phase are crucial to steering the heat focus). Since the SigmaHyperplan 2.0 treatment planning system was only capable of steady state computation, a time period was chosen during treatment where the measured temperatures were relatively steady (the shaded grey region in Fig. 2).
Temperature measurement locations
During treatment, temperatures inside the bladder and rectum were measured via temperature probes inserted in catheters. The probe locations were determined from patient CT images. Two measurement points, i.e., one inside the bladder and another inside the rectum, were obtained from either axial or sagittal planes in Sigma-Hyperplan to obtain calculated temperatures at locations corresponding to the CT locations.
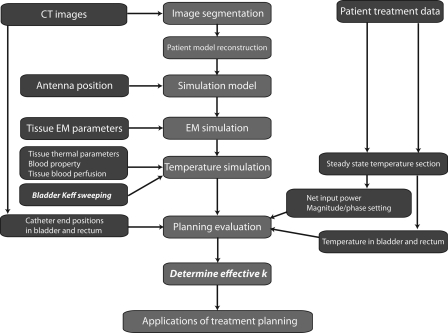
The procedure for retrospective treatment planning is illustrated in Fig. 3. The main work flow in the treatment planning, denoted by red boxes in the center column, was composed of image segmentation, patient model construction, simulation model construction, EM field simulation, temperature simulation, planning evaluation, and determination of bladder effective thermal conductivity. The CT images, hyperthermia treatment data, and patient model parameters in blue boxes in the left and right columns were used as inputs during various stages of the planning.
Figure 3.
The procedure of the retrospective treatment planning for nonmuscle invasive bladder cancer treatment: the middle column is the main procedure in the planning, and the left and right columns are inputs to the treatment planning.
For the temperature simulation, the effective thermal conductivity of bladder was varied from the thermal conductivity of a typical fluid, 0.642 W/K/m (no convection), to a value as large as 100 W/K/m (high conduction and convection). Differences between the bladder and rectum temperatures predicted from the planning and measured during treatment were calculated and analyzed as a function of . To understand the impact of on the bladder and surrounding normal tissues, spatial temperature profiles with various values were plotted. In addition, patient treatment statistics, such as maximum, minimum, median temperatures, and T90 were studied as a function of varying .
Another area that allowed correlation between simulation and measurement was related to patient pain complaints. These complaints were mostly due to higher temperature (“hot spots”) occurring in regions other than the target. For each patient treatment, regions of “hot spot” occurrences predicted by the planning were compared with patient complaints during treatment.
Assessment of treatment planning utility in nonmuscle invasive bladder cancer treatment
The clinical-optimal settings were a result of guidance provided by the BSD-2000 control computer model together with feedback from the patient and the rectal/bladder temperature probes, which allowed the expert medical physicist operator to adjust the settings. “Computed-optimal” settings were retrospectively calculated in Sigma-Hyperplan, to assess the potential improvement over the clinical settings. A user-specified objective function that defined the optimal goal of treatment was used in Sigma-Hyperplan
Objective:
| (2) |
Free variables
Constraints
where T is the temperature at spatial location ri,j,k, indices i, j, and k are node indices along the x, y, and z direction, and w is the weight of the penalty term; w = 1 was assigned.24, 25 This objective function was designed to drive the target (bladder content) temperatures above 43 °C and to restrict normal tissue temperatures below 42 °C. The free variables were the amplitudes () and phases () for the four antenna pairs of the applicator. Additional temperature constraints on the maximal allowable temperature in a specified tissue were also imposed: 44 °C for all tissue, except 45 °C for bladder.
The computed-optimal settings, while not capable of real-time adjustment, can potentially better reduce surrounding normal tissue heating by virtue of being able to model the patient tissue distribution in three-dimensions. To assess this potential, we compared the “hot spot” volumes from the clinical-optimal and the computed-optimal settings.
RESULTS
Determination of
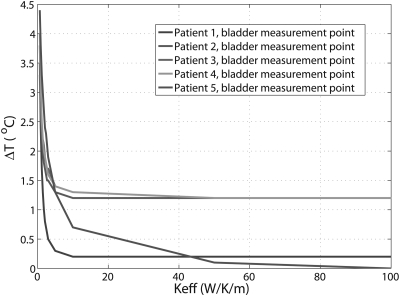
For the five patient treatments, differences between the predicted and measured temperatures inside the bladder as a function of are plotted in Fig. 4. It can be seen that temperature differences between the predicted and measured temperatures decrease with increasing . For larger than 10 W/K/m, the temperature differences reached an asymptote in four patients. For all the patients, the temperature differences were within 1.3 °C at and were within 1.2 °C at above 50 W/K/m.
Figure 4.
Differences between predicted and measured temperature in bladder as function of the effective thermal conductivity. The curves of patient 3 and patient overlap for most Keff values in the figure.
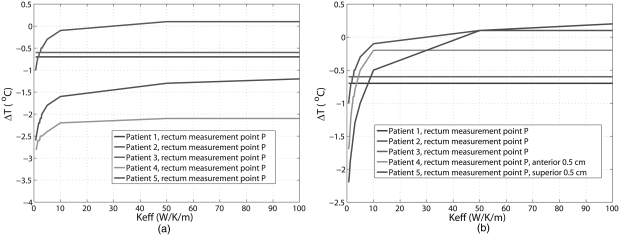
The differences between predicted and measured temperatures inside the rectum are shown in Fig. 5a. Unlike the results for bladder, temperature differences were quite large. However, if the sampling points in rectum were moved closer to the bladder in the simulation (0.5 cm anterior for patient 4 and 0.5 cm superior for patient 5), the results were substantially improved: at larger than 10 W/K/m, the temperature differences were between −0.7 °C and 0.2 °C, as shown in Fig. 5b.
Figure 5.
Differences between predicted and measured temperatures in rectum as function of the effective thermal conductivity: (a) at the original measurement points in rectum and (b) at points 0.5 cm away form the original measurement points for patient 4 and patient 5.
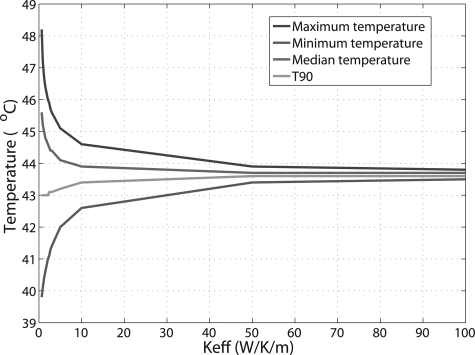
Patient treatment temperature statistics for the target, including the maximum, minimum, median temperatures, as well as T90 were also calculated as a function of . As the general trend of the curves for these parameters was similar among the patients, only the results from patient 3 are shown (Fig. 6). With increasing , the bladder temperature distribution tended to be become more homogeneous. The difference between maximum and minimum temperatures decreased to ∼0.5 °C at , and ∼0.3 °C at . It is impressive that T90, defined as the temperature value exceeded in 90% of the target volume, changed very slightly with increasing : from 43 °C at to 43.4 °C at and 43.6 °C at or above.
Figure 6.
Target treatment temperature statistics as function of for one patient, including maximum, minimum, median temperatures, and T90, defined as the temperature value exceeded in 90% of the target volume.
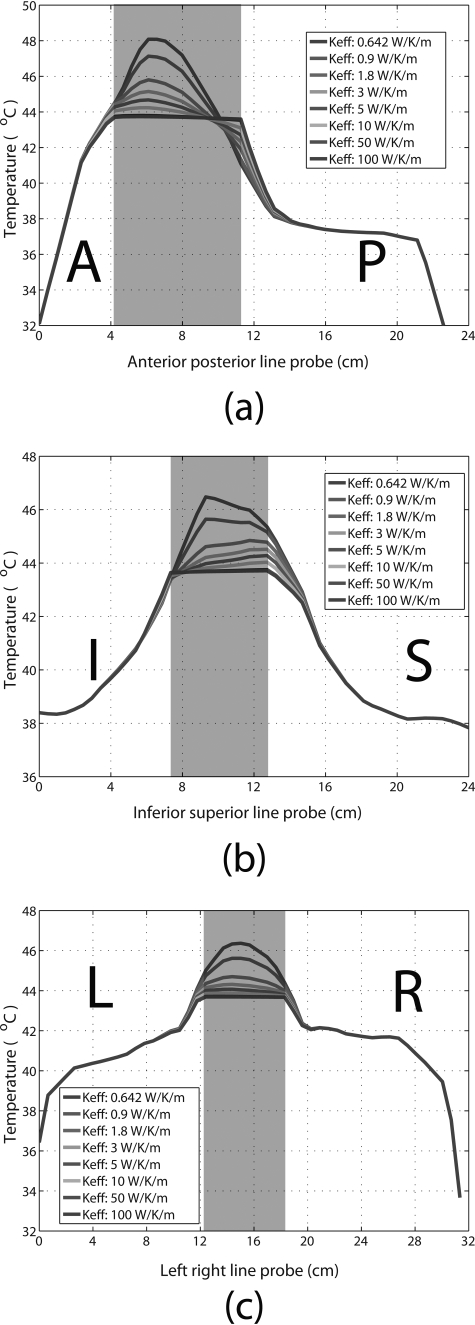
Spatial temperature distribution along the anterior– posterior, inferior–superior, and left–right directions across the bladder are plotted in Fig. 7. The shaded region represents the bladder, with normal tissue on either side. Eight temperature profile curves for varying are plotted, showing that the temperature distribution inside the bladder becomes more uniform with increasing (for , the temperature distribution was relatively homogeneous). Increasing also affected temperature distribution in the surrounding tissues, but to a much smaller extent than bladder and within a range of approximately 1.5 cm from the bladder wall. Beyond this range, varying had a negligible effect on the temperature distribution in the surrounding tissues. Based on these results, the clinically relevant range was estimated to be from 10 to 50 W/K/m.
Figure 7.
Temperature distribution profiles across the bladder and surrounding tissues in the (a) anterior–posterior, (b) inferior–superior, and (c) left–right directions, with various bladder values used for in the planning. The shaded regions represent the bladder. (A = anterior, P = posterior, I = inferior, S = superior, L = left, and R = right).
Clinical-optimal settings simulated in Sigma-HyperPlan
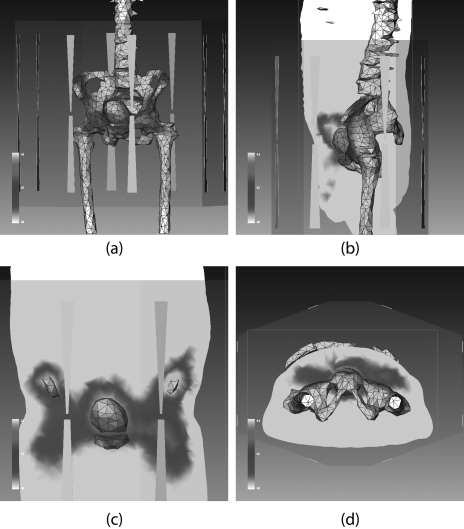
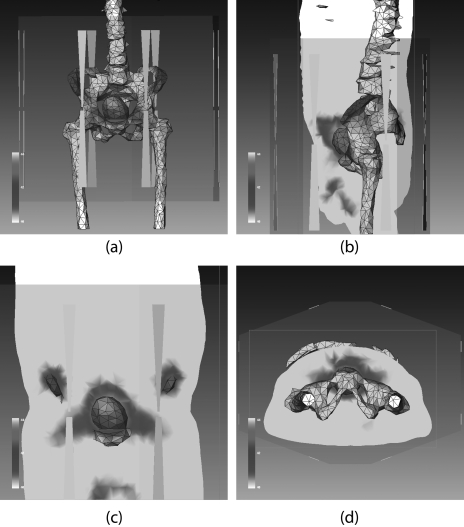
Figure 8 shows the three dimensional temperature distribution inside one patient model (patient 3) using the clinical-optimal settings. The bladder appears to be well heated. For all five patients, the measured temperatures in the treatment were also compared with the target T90 values, as listed in Table TABLE III.. The uncertainties for the measurement were ±0.25 °C, as mentioned previously. The calculated temperature uncertainties resulted from many factors in the simulation, including assigned tissue parameters, patient positioning, and temperature probe localization errors in the model, and simulation parameters, etc., and were not investigated in this paper. Not considering the measured and simulated temperature uncertainties, the differences between T90s and the measured temperatures were within 1.4 °C, and there was a very slight change of T90 when was increased from 10 to 50 W/K/m. Except for one patient (patient 5), the predicted T90 for the bladder target was larger than the measured temperature.
Figure 8.
Demonstration of Sigma-HyperPlan simulated temperature distributions in one patient (patient 3) when the clinical setting was used: (a) three dimensional temperature distribution superimposed on the anatomy showing location of bladder and bones. Temperature distributions on the sagittal plane, coronal plane, and axial plane are illustrated in (b), (c), and (d), respectively.
TABLE III.
Comparison of bladder temperatures measured during treatment with predicted T90 values using keff = 10 W/K/m or 50 W/K/m.
| Patient number | Measured temperature in bladder (±0.25 °C) | T90 (°C) | |
|---|---|---|---|
| keff = 10 W/K/m | keff = 50 W/K/m | ||
| Patient 1 | 42.9 | 43.1 | 43.1 |
| Patient 2 | 41.7 | 42.9 | 43.1 |
| Patient 3 | 42.6 | 43.4 | 43.6 |
| Patient 4 | 43.0 | 43.9 | 44.1 |
| Patient 5 | 42.5 | 42.1 | 42.3 |
For all five patients, the predicted hot spot locations were compared to patient complaints during treatment (summarized in Table TABLE IV.). It should be mentioned here that patient complaints may not be reported exclusively during the steady state period in which we chose to do retrospective planning, but we still see a general qualitative agreement.
TABLE IV.
Comparisons between hot spot locations predicted by planning (in normal tissues where temperature is larger than 42 °C when T90 = 43 °C of the target is achieved) and patient complaints.
| Patient number | Hot spot locations from treatment planning | Patient complaint locations |
|---|---|---|
| 1 | Small volumes in lower anterior pelvic bone (pubic bone) | No complaints |
| 2 | Superior and anterior part of lateral pelvic bones, lower anterior pelvic bone (pubic bone) | Anterior pelvic discomfort |
| 3 | Superior and anterior lateral pelvic bones, lower anterior pelvic bone, and fat anterior–superior to the bladder | Anterior pelvic discomfort (pubic bone level) and fat |
| 4 | Lateral pelvic bones, fat, and muscle anterior to femur heads | Some pelvic discomfort (not major) complaints |
| 5 | Superior lateral pelvic bone, lower anterior pelvic bone (pubic bone), fat, and muscle anterior to femur heads | pubic bone and fat |
Potential treatment quality improvement
Temperature distributions obtained with the computed and clinical-optimal settings were compared in two aspects (Table TABLE V.): (1) total net input power required to achieve the bladder target treatment T90 = 43 °C; and (2) “hot spot” volume (the volume of normal tissues at T > 42 °C, in cc) when the target treatment T90 = 43 °C. It should be noted that the total net input power for the computed-optimal setting was obtained by minimizing the objective function J in the optimization and then scaling the amplitudes up/down to yield a T90 = 43 °C. Compared with the treatment using clinical settings, the “hot spot” volumes were generally lower with the computed-optimal settings. As an example, for patient 3, the “hot spot” volume was reduced to about one third that for the treatment with clinical settings. The computed-optimal temperature distribution for patient 3 is illustrated in Fig. 9. Compared to the temperature distribution with the clinical settings in Fig. 8, “hot spots” in the vicinity of the lateral pelvic bones are substantially reduced, as well as a reduction in the hot regions anterior and superior to the bladder. Treatment planning helped improve quality of treatment for four out of the five targets in all patients and was almost the same for the other target. Overall, the computed-optimal settings show promise in potentially reducing patient discomfort by lowering hot spot volumes.
TABLE V.
Comparison between treatments with the clinical and the computed-optimal settings to achieve the treatment goal of T90 = 43 °C. The net power is the power required to achieve T90 = 43 °C, and hot spot volume is calculated as normal tissue volume >42 °C. Patient weights and the planned bladder volumes were also listed in the table.
| Patient No. | Weight(kg)/bladder volume(cc) | Clinical setting | Computed-optimal setting | ||
|---|---|---|---|---|---|
| Net power (W) | Hot spot (cc) | Net power (W) | Hot spot (cc) | ||
| Patient 1 | 69.5/172.8 | 245 | 124 | 250 | 127 |
| Patient 2 | 76.9/152.6 | 345 | 557 | 467 | 239 |
| Patient 3 | 90.7/156.7 | 359 | 745 | 359 | 270 |
| Patient 4 | 73.2/140.6 | 407 | 1015 | 312 | 119 |
| Patient 5 | 80.1/135.8 | 433 | 1430 | 393 | 368 |
Figure 9.
Sigma-HyperPlan simulated temperature distribution in patient 3 (same as in Fig. 8) when the computed-optimal setting is used: (a) three dimensional temperature distribution in bladder and pelvic bones. Temperature distributions on the sagittal, coronal, and axial planes are illustrated in (b), (c), and (d), respectively. Comparing against Fig. 8, the hot spots are substantially reduced with the computed-optimal setting.
DISCUSSION
Due to the small size of bladder relative to the patient, the RF loading of the patient in the Sigma applicator is similar regardless of bladder volume. Thus, treatment plans were performed on the average size bladder as scanned in the initial patient workup. Because of the linearly increasing bladder volume, a variation in actual power deposition into the bladder during the course of treatment is expected, but is accommodated by varying overall applicator power to maintain appropriate temperature rise in bladder. The simulations of this study are intended not to predict actual heating rate in bladder but rather to assist the operator in determining appropriate relative phase of the antennas to steer the power deposition pattern into the region of the variable size bladder, so that heating is well focused to the target and away from surrounding normal tissues.
The effective bladder thermal conductivity is a convenient parameter that seeks to mimic the combined effect of convection and conduction within the bladder/bladder wall. This study found that the simulated and measured bladder temperatures best matched for a large bladder effective thermal conductivity (10–50 W/K/m). The physical implication of large effective bladder thermal conductivity is that the heat is quickly conducted within the bladder, and more quickly conducted away at the interfaces between the bladder and the surrounding tissues. As a result, temperatures were more spatially uniform inside the bladder, and temperature differences between the surrounding tissues and bladder wall were decreased in the steady state, as shown in Fig. 7.
In the current heat transfer model, a single effective thermal conductivity was used to model both the fluid convection inside and heat conduction through the wall. Ideally, heat flow in the bladder would be most accurately characterized by separate convection (bladder fluid) and conduction (bladder wall) terms. Due to the complexity involved in such a model, we chose to use a single effective thermal conductivity parameter. While the effective thermal conductivity model has typically been used to model perfused tissue, it appears from this work that this approach can be used to improve the modeling of large fluid filled, heated organs.
The differences between predicted and measured temperatures in the rectum were large, compared to the bladder temperature difference. However, a small shift in expected location of the rectal temperature sensors reduced the temperature differences greatly. This high temperature sensitivity is because the anterior and superior segment of the rectum sits in a high temperature gradient region, implying that probes in this region can potentially have large temperature measurement uncertainties. Moreover, a shift like the one considered is possible as the rectal probe can move from CT-imaging to treatment.
Retrospective treatment planning (simulation) was used to evaluate the treatment with clinical manual settings. First, the simulation with clinical settings was shown to heat the bladder well and a good correlation was found between the calculated T90 and the single point of temperature measurement inside the bladder. Second, the location of the “hot spots” in the simulation coincided with patient reports of pain. Simulations indicate that treatment results may be improved using the computed-optimal settings obtained from treatment planning. The same target treatment can be attained with a substantial reduction of “hot spot” volumes in surrounding normal tissues. In the future, we plan to confirm this result in actual patient treatments based on prospective computed-optimal settings.
One challenge of implementing the computed-optimal settings from the treatment planning system in real treatments is that the HyperPlan calculated optimal settings assume they will be applied at the feed point of each antenna. Currently, power magnitude and phase are monitored and controlled by the BSD 2000 control system only at the RF amplifier output ports. With a control system that can deliver accurate net input power, both in magnitude and phase, or alternatively with further investigation of appropriate scaling between HyperPlan calculated phase/amplitudes and approximate phase/amplitudes necessary at the amplifier outputs, there is potential to realize the optimal setting from treatment planning and thus to provide improved quality hyperthermia treatments.
The process of bladder treatment planning is amenable to implementation within the clinical workflow. Using the effective bladder thermal conductivity and CT scans acquired prior to treatment, treatment plans may be generated using the Sigma Hyperplan system. The amplitude and phase settings may then be fine-tuned during treatment to further improve heat focusing or reduce patient pain. This approach has potential to not only provide improved bladder heating with lower power input but also reduces the time taken by the operator to “search” for effective settings.
CONCLUSIONS
The use of an effective thermal conductivity for bladder was shown to be an effective way of mimicking the combined convective/conductive heat transfer inside the bladder and at interfaces between the bladder and surrounding tissues. Compared to manual experienced operator based treatment settings, pretreatment planning for RF phased array thermochemotherapy of nonmuscle invasive bladder cancer with Sigma-HyperPlan shows promise for reducing patient discomfort by lowering hot spot volumes in normal tissues while effectively localizing heat in bladder.
ACKNOWLEDGMENTS
The authors gratefully acknowledge HyperPlan software from Dr. Sennewald Medizintechnik GmbH and software support from Steffen Eisenhardt. The authors appreciate the technical assistance in Avizo® from Jean-Luc Garnier, Mike Marsh, Emmet Ludington, and Shawn Zhang. This study was supported by NIH grant NCI P01—CA042745-23.
References
- Colombo R., Lev A., Da Pozzo L. F., Freschi M., Gallus G., and Rigatti P., “A new approach using local combined microwave hyperthermia and chemotherapy in superficial transitional bladder-carcinoma treatment,” J. Urol. 153, 959–963 (1995). 10.1016/S0022-5347(01)67613-4 [DOI] [PubMed] [Google Scholar]
- Moskovitz B., Meyer G., Kravtzov A., Gross M., Kastin A., Biton K., and Nativ O., “Thermo-chemotherapy for intermediate or high-risk recurrent superficial bladder cancer patients,” Ann. Oncol. 16, 585–589 (2005). 10.1093/annonc/mdi124 [DOI] [PubMed] [Google Scholar]
- McKiernan J. M., Masson P., Murphy A. M., Goetzl M., Olsson C. A., Petrylak D. P., Desai M., and Benson M. C., “Phase I trial of intravesical docetaxel in the management of superficial bladder cancer refractory to standard intravesical therapy,” J. Clin. Oncol. 24, 3075–3080 (2006). 10.1200/JCO.2005.03.1161 [DOI] [PubMed] [Google Scholar]
- Colombo R., Da Pozzo L. F., Lev A., Freschi M., Gallus G., and Rigatti P., “Neoadjuvant combined microwave induced local hyperthermia and topical chemotherapy versus chemotherapy alone for superficial bladder cancer,” J. Urol. 155, 1227–1232 (1996). 10.1016/S0022-5347(01)66225-6 [DOI] [PubMed] [Google Scholar]
- Gofrit O. N., Shapiro A., Pode D., Sidi A., Nativ O., Leib Z., Witjes J. A., van der Heijden A. G., Naspro R., and Colombo R., “Combined local bladder hyperthermia and intravesical chemotherapy for the treatment of high-grade superficial bladder cancer,” Urology 63, 466–471 (2004). 10.1016/j.urology.2003.10.036 [DOI] [PubMed] [Google Scholar]
- Hall R. R., Schade R. O. K., and Swinney J., “Effects of hyperthermia on bladder cancer,” Br. Med. J. 2, 593–594 (1974). 10.1136/bmj.2.5919.593 [DOI] [PMC free article] [PubMed] [Google Scholar]
- Longo F. W., Tomashefsky P., Rivin B. D., and Tannenbaum M., “Interaction of ultrasonic hyperthermia with 2 alkylating-agents in a murine bladder-tumor,” Cancer Res. 43, 3231–3235 (1983). [PubMed] [Google Scholar]
- Mauroy B., Bonnal J. L., Prevost B., Chive M., Lhotellier V., Sozanski J. P., Vanseymortier L., and Stefaniak X., “Preliminary results of a study of the synergy of microwave hyperthermia/intravesical chemotherapy in the prevention of recurrent superficial bladder tumours,” Prog. Urol. 9, 69–80 (1999). [PubMed] [Google Scholar]
- Li Z., Vogel M., Maccarini P. F., Stakhursky V., Soher B. J., Craciunescu O. I., Das S., Arabe O. A., Joines W. T., and Stauffer P. R., “Improved hyperthermia treatment control using SAR/temperature simulation and PRFS magnetic resonance thermal imaging,” Int. J. Hyperthermia 27, 86–99 (2011). 10.3109/02656736.2010.501509 [DOI] [PMC free article] [PubMed] [Google Scholar]
- Chen X., Diederich C. J., Wootton J. H., Pouliot J., and Hsu I. C., “Optimisation-based thermal treatment planning for catheter-based ultrasound hyperthermia,” Int. J. Hyperthermia 26, 39–55 (2010). 10.3109/02656730903341332 [DOI] [PubMed] [Google Scholar]
- de Greef M., Kok H. P., Correia D., Bel A., and Crezee J., “Optimization in hyperthermia treatment planning: The impact of tissue perfusion uncertainty,” Med. Phys. 37, 4540–4550 (2010). 10.1118/1.3462561 [DOI] [PubMed] [Google Scholar]
- van Dijk J. D. P., Schneider C., van Os R., Blank L. E. C. M., and Gonzalez D. G., “Results of deep body hyperthermia with large waveguide radiators,” in Consensus on Hyperthermia for the 1990s, edited by Bicher H. I., McLaren J. R., and Pigliucci G. M. (Springer, New York, 1991), pp. 315–319. [Google Scholar]
- Rietbroek R. C., Bakker P. J. M., Schilthuis M. S., Postma A. J., Vording P., Gonzalez D. G., Kurth K. H., Bakker A. J., and Veenhof C. H. N., “Feasibility, toxicity, and preliminary results of weekly loco-regional hyperthermia and cisplatin in patients with previously irradiated recurrent cervical carcinoma or locally advanced bladder cancer,” Int. J. Radiat. Oncol., Biol., Phys. 34, 887–893 (1996). 10.1016/0360-3016(95)02152-3 [DOI] [PubMed] [Google Scholar]
- Chen M. M. and Holmes K. R., “Microvascular contributions in tissue heat transfer,” Ann. N.Y. Acad. Sci. 335, 137–151 (1980). 10.1111/j.1749-6632.1980.tb50742.x [DOI] [PubMed] [Google Scholar]
- Lagendijk J. J. W., “A new theory to calculate temperature distributions in tissues, or why the ‘bioheat transfer’ equation does not work,” in Hyperthermic Oncology, edited by Overgaard J. (Taylor & Francis, London, 1984), pp. 507–510. [Google Scholar]
- Lagendijk J. J. W. and Mooibroek J., “Hyperthermia treatment planning,” Recent Results Cancer Res. 101, 119–131 (1986). 10.1007/978-3-642-82530-9_16 [DOI] [PubMed] [Google Scholar]
- Weinbaum S. and Jiji L. M., “A new simplified bioheat equation for the effect of blood flow on local average tissue temperature,” ASME J. Biomech. Eng. 107, 131–139 (1985). 10.1115/1.3138533 [DOI] [PubMed] [Google Scholar]
- Baish J. W., Foster K. R., and Ayyaswamy P. S., “Heat transport mechanisms in vascular tissues: A model comparison,” ASME J. Biomech. Eng. 108, 324–331 (1986). 10.1115/1.3138623 [DOI] [PubMed] [Google Scholar]
- Baish J. W., Ayyaswamy P. S., and Foster K. R., “Perfused phantom models of microwave irradiated tissue,” ASME J. Biomech. Eng. 108, 239–245 (1986). 10.1115/1.3138609 [DOI] [PubMed] [Google Scholar]
- Charny C. K., Weinbaum S., and Levin R. L., “An evaluation of the Weinbaum-Jiji bioheat equation for normal and hyperthermic conditions,” ASME J. Biomech. Eng. 112, 80–87 (1990). 10.1115/1.2891130 [DOI] [PubMed] [Google Scholar]
- Lagendijk J. J. W., “Report of the subgroup on thermal modelling,” COMAC-BME Workshop on Modelling and Planning in Hyperthermia (Lagonissi, 1990);; Lagendijk J. J. W., COMAC-BME Hyperthermia Bull. Vol. 4, 47–49 (1990). [Google Scholar]
- Crezee J., Mooibroek J., Lagendijk J. J., and van Leeuwen G. M., “The theoretical and experimental evaluation of the heat balance in perfused tissue,” Phys. Med. Biol. 39, 813–832 (1994). 10.1088/0031-9155/39/5/003 [DOI] [PubMed] [Google Scholar]
- Van der Koijk J. F., Crezee J., Van Leeuwen G. M. J., Battermann J. J., and Lagendijk J. J. W., “Dose uniformity in MECS interstitial hyperthermia: The impact of longitudinal control in model anatomies,” Phys. Med. Biol. 41, 429–444 (1996). 10.1088/0031-9155/41/3/007 [DOI] [PubMed] [Google Scholar]
- Gellermann J., Wust P., Stalling D., Seebass M., Nadobny J., Beck R., Hege H., Deuflhard P., and Felix R., “Clinical evaluation and verification of the hyperthermia treatment planning system HyperPlan,” Int. J. Radiat. Oncol., Biol., Phys. 47, 1145–1156 (2000). 10.1016/S0360-3016(00)00425-9 [DOI] [PubMed] [Google Scholar]
- Sreenivasa G., Gellermann J., Rau B., Nadobny J., Schlag P., Deuflhard P., Felix R., and Wust P., “Clinical use of the hyperthermia treatment planning system HyperPlan to predict effectiveness and toxicity,” Int. J. Radiat. Oncol., Biol., Phys. 55, 407–419 (2003). 10.1016/S0360-3016(02)04144-5 [DOI] [PubMed] [Google Scholar]
- van der Wal E., Franckena M., Wielheesen D. H., Zee J. van der, and van Rhoon G. C., “Steering in locoregional deep hyperthermia: Evaluation of common practice with 3D planning,” Int. J. Hyperthermia 24 682–693 (2008). 10.1080/02656730802256359 [DOI] [PubMed] [Google Scholar]
- Gabriel C., Gabriel S., and Corthout E., “The dielectric properties of biological tissues. I. Literature survey,” Phys. Med. Biol. 41, 2231–2249 (1996). 10.1088/0031-9155/41/11/001 [DOI] [PubMed] [Google Scholar]
- Gabriel S., Lau R. W., and Gabriel C., “The dielectric properties of biological tissues. II. Measurements in the frequency range 10 Hz to 20 GHz,” Phys. Med. Biol. 41, 2251–2269 (1996). 10.1088/0031-9155/41/11/002 [DOI] [PubMed] [Google Scholar]
- Gabriel S., Lau R. W., and Gabriel C., “The dielectric properties of biological tissues. III. Parametric models for the dielectric spectrum of tissues,” Phys. Med. Biol. 41, 2271–2293 (1996). 10.1088/0031-9155/41/11/003 [DOI] [PubMed] [Google Scholar]
- Van den Berg C. A., Van de Kamer J. B., De Leeuw A. A., Jeukens C. R., Raaymakers B. W., van Vulpen M., and Lagendijk J. J. W., “Towards patient specific thermal modelling of the prostate,” Phys. Med. Biol. 51, 809–825 (2006). 10.1088/0031-9155/51/4/004 [DOI] [PubMed] [Google Scholar]
- Giering K., Lamprecht I., and Minet O., “Specific heat capacities of human and animal tissues,” Proc. SPIE 2624, 188–197 (1996). 10.1117/12.229547 [DOI] [Google Scholar]
- Kenner T., “The measurement of blood density and its meaning,” Basic Res. Cardiol. 84, 111–124 (1989). 10.1007/BF01907921 [DOI] [PubMed] [Google Scholar]
- Lang J., Erdmann B., and Seebass M., “Impact of nonlinear heat transfer on temperature control in regional hyperthermia,” IEEE Trans. Biomed. Eng. 46, 1129–1138 (1999). 10.1109/10.784145 [DOI] [PubMed] [Google Scholar]
- Pennes H., “Analysis of tissue and arterial blood temperatures in the resting human forearm,” J. Appl. Physiol. 1, 93–122 (1948). [DOI] [PubMed] [Google Scholar]


