Abstract
Purpose: Intensity-modulated proton therapy (IMPT) using spot scanned proton beams relies on the delivery of a large number of beamlets to shape the dose distribution in a highly conformal manner. The authors have developed a 3D system based on liquid scintillator to measure the spatial location, intensity, and depth of penetration (energy) of the proton beamlets in near real-time.
Methods: The detector system consists of a 20 × 20 × 20 cc liquid scintillator (LS) material in a light tight enclosure connected to a CCD camera. This camera has a field of view of 25.7 by 19.3 cm and a pixel size of 0.4 mm. While the LS is irradiated, the camera continuously acquires images of the light distribution produced inside the LS. Irradiations were made with proton pencil beams produced with a spot-scanning nozzle. Pencil beams with nominal ranges in water between 9.5 and 17.6 cm were scanned to irradiate an area of 10 × 10 cm square on the surface of the LS phantom. Image frames were acquired at 50 ms per frame.
Results: The signal to noise ratio of a typical Bragg peak was about 170. Proton range measured from the light distribution produced in the LS was accurate to within 0.3 mm on average. The largest deviation seen between the nominal and measured range was 0.6 mm. Lateral position of the measured pencil beam was accurate to within 0.4 mm on average. The largest deviation seen between the nominal and measured lateral position was 0.8 mm; however, the accuracy of this measurement could be improved by correcting light scattering artifacts. Intensity of single proton spots were measured with precision ranging from 3 % for the smallest spot intensity (0.005 MU) to 0.5 % for the largest spot (0.04 MU).
Conclusions: Our LS detector system has been shown to be capable of fast, submillimeter spatial localization of proton spots delivered in a 3D volume. This system could be used for beam range, intensity and position verification in IMPT.
INTRODUCTION
Intensity-Modulated Proton Therapy (IMPT) is a modality that offers unsurpassed dose conformity and has great potential for treating tumors that are difficult to treat with other form of radiation therapy.1, 2, 3, 4, 5, 6 However, the dynamic nature of IMPT as well as the necessity to use thousands of scanning proton beamlets makes treatment verification both time consuming and difficult to perform.7, 8, 9, 10, 11
We have previously studied the feasibility of using a three-dimensional liquid scintillator (LS) detector system to rapidly verify proton treatments.12, 13 Using a tank of LS and a high sensitivity CCD camera, we have shown that monitoring the passage of a proton beam is feasible. With this approach, we irradiate a phantom made of LS with proton beams. The LS emits visible scintillation light wherever dose is deposited, and we make quantitative measurements of this light with the CCD camera. Although our earlier preliminary work was with passively scattered proton beams, we were able to estimate that the passage of a single proton beamlet would be sufficient to produce a measurable signal (the term “spot” is used to define the high dose region around the Bragg peak of a proton beamlet. We may use the terms beamlet and spot interchangeably. We also use then term “spot position” to mean the position of the Bragg peak of the beamlet). We also determined basic parameters of the system such as the field of view, depth of field and spatial resolution. Although the size of the LS detector was limited (7 × 7 × 14), we were able to conclude that a larger detector volume could be used.
Although our earlier work was conducted on a passively scattered proton beamline, we realized that the LS detector system would be particularly useful for IMPT. Due to the small size of the beams involved in IMPT, it is possible to determine the range, the position, and the intensity of each beamlet directly from the measured scintillation light emission. With this approach, the phantom is the detector and therefore delivering the treatment to the LS could potentially provide sufficient information to verify the accuracy of a planned treatment.
Our goal in this work is to refine the LS-based detector system and to show that position, range, and intensity of proton spots can be measured with a precision and accuracy sufficient for the QA of IMPT.
METHODS AND MATERIALS
Experimental setup
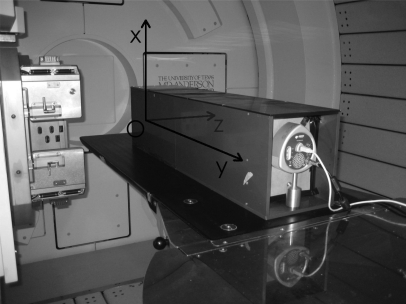
The liquid scintillator detector system used in this work has been described previously13 and is shown in Fig. 1. The center of the LS tank is at a distance of 80 cm from the lens. The objective lens was set to an F/# of 5.6. With this particular setup, we calculated12 that the images will be on focus at distances ranging from 60 to 87 cm, therefore covering the whole length of LS tank.
Figure 1.
The LS detector prototype with the coordinate system used throughout this work.
All irradiations were made with the gantry at 270° and with the isocenter placed on the surface of the wall of the LS tank. The proton beam had to go through the wall of the LS tank before it could reach the scintillating material. Because one of our goals is to measure range of proton beamlets, it is important to know the amount of attenuation caused by the wall. The LS tank is made of gray sheets of PVC of 9.5 mm (3/8”) with a density between 1.38 and 1.41 g/cm3. This corresponds to an attenuation of approximately 1.31–1.34 cm of water using the mass stopping power of PVC.
Throughout this article, we will use the following coordinate system: the x-direction, or the crossline direction, goes from the floor of the of the treatment room to the ceiling, the y-direction, or the inline direction, goes from the back of the LS tank toward the CCD camera and the z-direction, or the depth direction, goes from the proton nozzle toward the LS tank. The origin of this coordinate system is placed at isocenter (see Fig. 1). Furthermore, we will use the term “lateral direction” and “lateral profile” to refer to any direction or profile along the x-axis or y-axis and the term “depth profile” or “depth direction” to refer to any profile or direction along the z-axis. All irradiations were conducted on the scanning beamline at the M. D. Anderson Cancer Center—Proton Therapy Center, Houston. On this beamline, one monitor unit (MU) is defined as 1 cGy in the middle of a 10 cm spread-out Bragg peak (SOBP) for a field of 10 by 10 cm with a range of 30.6 cm in water, which is created by the superposition of the proton pencil beam spots of various energies.
Acquiring 2D images
The CCD camera acquires two-dimensional images of the three-dimensional light distribution produced within the LS. Therefore, all the information within the y-axis is collapsed onto a single value for each pixel. We have previously presented such a system and described how it could be used to extract information useful for both photon and proton QA.12, 13 In this work, we used the LS detector system for verification of proton spot position in a scanning beam system. Because of the CCD fast acquisition rate (50 ms per frame), there are only a small number of spots per image frame (typically less than 5). For more accurate evaluation of the proton spot position, it would be ideal to have only one spot per image. This would be feasible with faster image acquisition either by reducing the number of pixels (e.g., by binning the image) or with a faster camera. Otherwise, we could re-order the delivery of the spots so they are no longer delivered close to each other. The spots have a relatively small size, and therefore, the collapsed third dimension is not a significant limitation of our system. In the future, we plan to add a second CCD camera orthogonal to the one already in use to better resolve the spatial localization of the y-dimension.
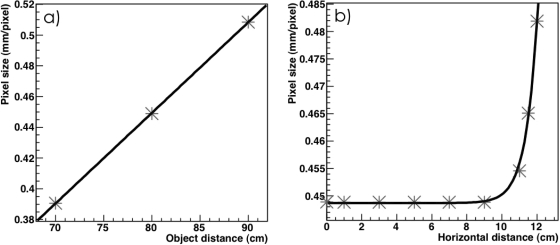
Because we are interested in the spatial localization of the proton spots, it is important to know the pixel size with great accuracy. The pixel size changes as a function of the distance between the image plane and the objective lens. Therefore, the pixel size was measured experimentally by imaging a grid of known dimensions at three different position: at 80 cm from the objective lens (i.e., the middle of the LS tank), at 70 cm from the objective lens and at 90 cm from the objective lens. The pixel size at these three positions was recorded and a linear fit was applied to determine the pixel size at any distance y from the objective lens. Distortion of the pixel size in the periphery of the image caused by the objective lens (i.e., monochromatic aberrations) was also characterized.
Unless otherwise specified, an acquisition time of 50 ms per image frame was used. The time gap between images was 0.3 ms. The CCD camera is capable of amplification through electron multiplication. However, this feature was not required for this work, and the CCD camera was operated as a normal frame-transfer CCD camera. As we have done previously,12, 13 dark images (i.e., images acquired with the radiation beam turned off) were acquired prior to the measurements and were subtracted from the images acquired with radiation to correct for the constant offset in the pixel values.
In previous work, the transient noise produced by the impact of stray radiation directly on the CCD chip has been of concern for linac-based applications.14 However, for proton irradiations, the impact of stray radiation is low compared to photon beam irradiation because there is not a large number of high-energy delta ray produced. The main source of radiation-induced noise comes from neutrons and gamma rays produced by (p,n) and (p,γ) interactions. Nevertheless, the rate of such events was low and did warrant correction for the radiation-induced noise.
Image processing and data analysis
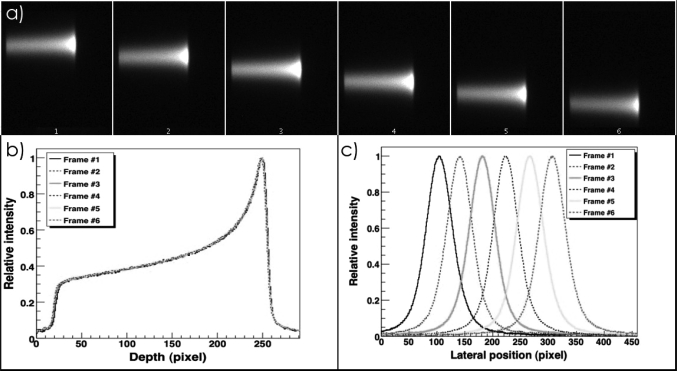
For each image, both a crossline profile (i.e., along the x-direction) and a depth profile (i.e., along the z-direction) were acquired. These profiles were then analyzed in ROOT,15 a system that provides a set of object-oriented frameworks with all the functionality needed to handle and analyze large amounts of data in a very efficient way. A sample of profiles of the light distribution for six image frames showing proton spots of increasing x is shown on Fig. 2. The position axis on the depth and crossline profiles shown on Figs. 2b, 2c are measured in pixels. Before any quantitative analysis can be done on the images, it is necessary to convert pixel coordinates of the proton spot into spatial coordinates. This is done using the measured pixel size (See Sec. 2B). As mentioned previously, the pixel size changes as a function of the distance between the imaged object and the camera. To correctly convert pixel coordinates of the proton spot into spatial coordinates, it is therefore necessary to know the y-axis position of the spot. At present time, the y-axis coordinate of the proton spot is obtained from the treatment plan but we plan to extract this value experimentally once a second camera to image from an orthogonal direction is added to our prototype. After pixels coordinates have been converted into spatial coordinates, the exact position of the spot must be determined. Here, it is important to remember that because of several optical and physical phenomena, the scintillation light distribution measured by the camera may differ from the dose distribution. Therefore, some processing is required before we can extract meaningful values from the image. Most of the optical and physical phenomena affecting the scintillation light distribution have been discussed previously12, 13 and are summarized in Table TABLE I..
Figure 2.
(a) A sample of the images of proton spots acquired with the CCD camera. Each frame represents a different proton spot of a nominal range in water of 10.5 cm delivered in 1 cm increments along the x-axis (crossline) (b) Depth profiles of the spots shown in (a) and (c) lateral profiles of the spots shown in (a).
TABLE I.
Summary of the optical and physical phenomena that alter the measured light distribution.
| Phenomenon | Type | Effect |
|---|---|---|
| Light diffusion | Light propagation | Blurring |
| Light reflection | Artificially increases light intensity in proximity of a reflecting surface | |
| Quenching | Physical | Under-response of the scintillator to high LET |
| Water equivalence | Proton range in LS is different than the range in water | |
| Vignetting | Imaging artifact | Decrease of brightness in the periphery of the image |
| Barrel effect | Distortion of the pixel size |
The position along the x-axis was measured first. We assumed that the peak of the dose distribution corresponds to the peak of the light distribution, and therefore, the center of the lateral profile corresponds to that position. This assumption is reasonable because the quenching effect, which is the greatest cause of discrepancies between the dose profile and the light profile, does not have a significant impact in the lateral direction, i.e., the LET of the beam at a given depth is more or less constant. We measured the beam position for proton Bragg peaks ranging from −6 to +6 cm along the x-axis and compared these measurements with the beam position requested at the treatment console (i.e., the nominal position). Moreover, we verified the symmetry of the lateral spot profile and that the shape of the profile did not change with the position of the beam. Asymmetries or variations in the shape of the profile could indicate an increased contribution from diffused or reflected light that could bias our identification of the peak of the light distribution.
Measuring the position of the depth or range of the spot (i.e., along the z-axis) is more challenging than measuring the lateral position because it is necessary to use a specific reference point from the dose distribution. A common reference point used for this purpose is the distal 80 %. This point should be close to the true range of the protons for pristine Bragg peaks.16, 17 At our institution, the range of proton beams are customarily measured at the distal 90 %. In any event, because of quenching and light diffusion there is no guarantee that a relative point on the dose distribution will correspond to the same point on the light distribution. The choice of a point on the light distribution that can be readily correlated to the range of the proton beam must therefore be made with care. There are three main factors that are responsible for differences between the dose distribution and the light distribution: (1) difference in density and stopping power between water and the liquid scintillator; (2) under-response of the scintillator due to quenching, which increases as a function of depth and is significant at the end of range; and (3) blurring of the light distribution due to light diffusion. To our knowledge, there is only one published report of clinical proton range measurement with scintillators.18 Fukushima et al. used the distal 80 % of the light distribution to measure proton range, but the authors did not justify this choice. In order to select the best possible reference point on a depth profile for range measurements, we compared several reference points to measure the range of protons. The reference point that gave us the least deviation from the expected range for all beam energies was then used for all range measurement.
RESULTS
Spatial calibration
Pictures of a grid were taken at different distances from the camera. These pictures were then analyzed to determine the pixel size in various region of the image. Figure 3a shows the average pixel size at the center of the image as a function of the distance between the CCD camera and the image plane. As expected the relationship is linear. Figure 3b shows the size of pixels as a function of the position in the image plane, which corresponds to the x-z plane for an image taken at a distance of 80 cm from the CCD camera. It can be seen that the pixel size is constant except at the periphery of the image. This effect results from barrel-shaped distortions in the image. From this pixel size characterization study, we decided to correct the pixel size only as a function of the distance between the image plane and the CCD. Pixel correction in the image plane were not required because none of the irradiations placed a spot at the periphery of the image.
Figure 3.
Measured pixel size of the LSD system; (a) pixel size as a function of the distance between the image plane and the CCD (i.e., along the y-axis), the solid line represents a linear fit; (b) pixel size as a function of the lateral position on the image (i.e., along the x-axis), the solid line represents an exponential fit.
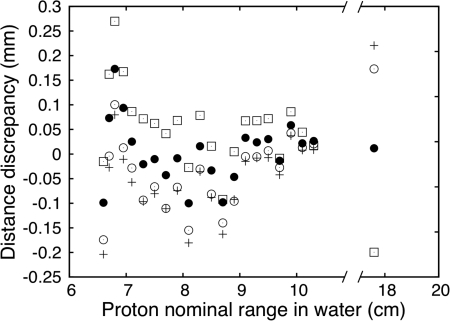
For the range calibration of our prototype in the z-axis (i.e., the direction along the range of the protons), we first irradiated the LS with spots of the same nominal energy. The first spot was delivered directly to the LS detector system while the second and third were delivered with slabs of water-equivalent material of known water-equivalent thickness (WET) of 1 and 2 cm placed before the LS detector system. The advantage of this set of irradiation is that by using the same nominal energy and then adding material with a small WET value, the measured light distribution of the second proton spot is simply a translation of the light distribution seen without the additional material. In that particular case, the selection of the reference point on the light distribution is of no importance when quantifying the shift that occurred between the two curves. The nominal beam range in water was plotted as a function of the measured range in the LS detector. We then made a linear regression of this plot. The slope of that fit is 0.872, which corresponds to the WET of the LS detector and is in agreement with our previous measurement.12 The ordinate at origin is 0.96 and is the WET of the wall of the LS tank. As stated previously, measuring the range of protons requires the use of a reference point on the depth profile. We have tested six reference points: the point of maximum dose (i.e., the Bragg peak), the distal 90 %, the distal 80 %, the distal 70 %, the average from the peak to the distal 30 %, and the average from the distal 90 % to the distal 70 %. Of these, two are common reference point (distal 90 % and distal 80 %), the other points were chosen simply for comparison. These reference points were tested by measuring the distance between proton beams of nominal range in water between 6.6 cm and 17 cm and a reference beam. The reference was chosen as a beam with a range in water of 10.5 cm. Results for four reference points are presented in Fig. 4. The incident energy of all points shown in Fig. 4 is different. Consequently, all Bragg curves have slightly different shapes (e.g., the peaks are narrower at low energy). Only four of the six reference points are shown on Fig. 4 for the purpose of clarity. As it can be seen, the choice of a reference point does not lead to large discrepancies in the measurement of proton range. Nevertheless, it was found that using the distal 80 % minimized discrepancies between expected and measured ranges. Therefore, the distal 80 % has been used as a reference point throughout the rest of this work.
Figure 4.
Measured proton ranges using different reference points. Plus sign (+) represents the average position between the Bragg peak and the distal 30%, black circle represent the distal 80%, open circle the distal 70%, and open square the distal 90%.
Lateral position measurements
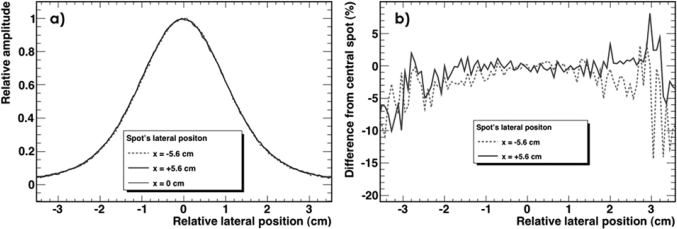
Pristine Bragg peaks with a range in water of 10.5 cm were irradiated on the LS detector system at 13 different positions on the x-axis between −5.6 and +5.6 cm. Comparisons between expected position and measured position are shown in Table TABLE II.. These measurements take into account the source-to-detector distance (i.e., 3 m to the surface of the detector) that cause variations in the lateral position of the spot due to the small changes in the angle of incidence of the beam. The average difference between the measured and expected spot position is 0.11 ± 0.34 mm (1 SD). The maximum difference recorded was 0.6 mm. Our assumption that the shape of the spot profile is invariant at different positions in the LS was verified by analyzing the spot profile on the central axis and by comparing it to the spot profiles at −5.6 and +5.6 cm. This comparison is shown in Fig. 5. Figure 5a shows crossline profiles of spots taken at x = +5.6 cm, x = 0 cm, and x = −5.6 cm; Fig. 5b shows the relative difference between each of the two off-axis spots (i.e., spots at ±5.6 cm) with respect to the central spot. From this figure, we see that the shape of the spot is the same regardless of the position along the x-axis.
TABLE II.
Comparison between expected and measured lateral position of the proton spot along the x-axis.
| Nominal position (cm) | Measured position (cm) | Difference (mm) |
|---|---|---|
| −5.62 | −5.58 | 0.36 |
| −4.68 | −4.69 | −0.06 |
| −3.74 | −3.77 | −0.28 |
| −2.81 | −2.85 | −0.39 |
| −1.87 | −1.93 | −0.60 |
| −0.94 | −0.99 | −0.57 |
| 0 | 0 | −0.04 |
| 0.94 | 0.94 | 0.05 |
| 1.87 | 2.90 | 0.25 |
| 2.81 | 3.85 | 0.39 |
| 3.74 | 3.76 | 0.2 |
| 4.68 | 4.65 | −0.30 |
| 5.62 | 5.58 | −0.38 |
Figure 5.
(a) Scintillation light profile of three proton spots with different lateral position (−5.6 cm, 0 cm, and +5.6 cm). All spots are drawn centered on their peak; (b) relative difference in the intensity of two spots (−5.6 cm and +5.6 cm) relative to the central spot (x = 0 cm).
Finally, we verified that the measured lateral position did not change when a proton spot is scanned in the axis of the camera (y-axis). Proton spots were irradiated in 13 positions between −5.6 cm and +5.6 cm along the y-axis. The spot width (FWHM), the lateral spot position along the x-axis and the range are shown in Table TABLE III.. We observed a slight broadening (i.e., 0.8 mm variation of the FWHM over a distance of 12 cm) in the width of the spots as the distance between the camera and the spot increased. This effect occurred even if the pixel sizes were corrected as a function of the beam position. This broadening is likely due to increased light scattering as we go further away from the camera. Variation of the spot position along the y-axis does not result in a significant deviation from the expected value if compared to our ability to measure the spot position at a constant distance from the CCD.
TABLE III.
Measured spot position and width (FWHM) differences from a spot on the central axis as a function of its distance in the direction parallel to the camera’s axis (y-axis).
| Position, y-axis (cm) | Lateral width difference (mm) | Lateral position (x-axis) difference (mm) |
|---|---|---|
| −5.62 | 0.54 | −0.48 |
| −4.68 | 0.43 | −0.47 |
| −3.74 | 0.44 | −0.47 |
| −2.81 | 0.26 | 0 |
| −1.87 | 0.37 | −0.46 |
| −0.94 | 0.25 | −0.45 |
| 0 | 0.00 | 0.00 |
| 0.94 | 0.00 | 0.00 |
| 1.87 | 0.16 | 0.00 |
| 2.81 | 0.10 | 0.00 |
| 3.74 | −0.02 | 0.21 |
| 4.68 | −0.1 | −0.21 |
| 5.62 | −0.29 | 0.20 |
Depth measurements
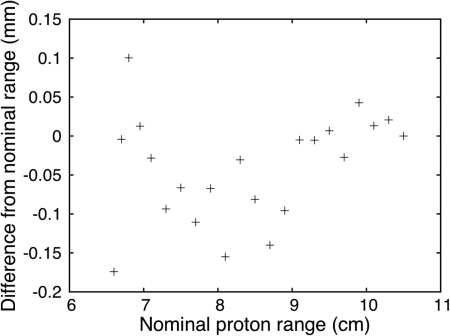
The difference between the nominal proton range in water and the range measured in the LS detector system is shown in Fig. 6 for protons with range in water between 6.6 cm and 10.5 cm. The measured range is close to the nominal range in water for all energies. The average difference between the measured and the nominal proton range is 0.04 ± 0.07 mm (1 SD). The maximum discrepancy seen was 0.18 mm. These results are highly accurate and indicated that the range of proton spots can be measured with submillimeter accuracy with the LS system.
Figure 6.
Comparison of measured proton beam range in the LS detector system with expected range.
Relative intensity measurements
Comparing the intensity of proton spots with different beam energies will require a correction for the quenching.19 We have previously shown that this was feasible12 and it will be the aim of our future work. Nevertheless, it is possible to make relative measurements of proton spot intensity with the LS detector system for beam of a given energy.
We made ten repeated measurements of individual proton spots with the smallest and largest dose per spot deliverable at our proton facility (0.005 MU and 0.04 MU, respectively) as well as ten repeated irradiations of 5 MU. One irradiation of 5 MU consists of 125 identical spots of 0.04 MU. The total light measured in the ten irradiations of 5 MU was highly reproducible with a measured standard deviation of 0.06 %. The light emitted by the LS for an irradiation of 5 MU was used as a reference to determine the light emission per monitor unit. The measured number of MU for the single spot irradiation was obtained from the following equation:
Results are shown in Table TABLE IV..
TABLE IV.
Measured proton spot intensity. The measured value at 5 MU is not shown because it is used as a reference.
| MU delivered | MU measured | Standard deviation (%) |
|---|---|---|
| 0.005 | 0.0054 | 3.3 |
| 0.04 | 0.0401 | 0.51 |
| 5 | N/A | 0.06 |
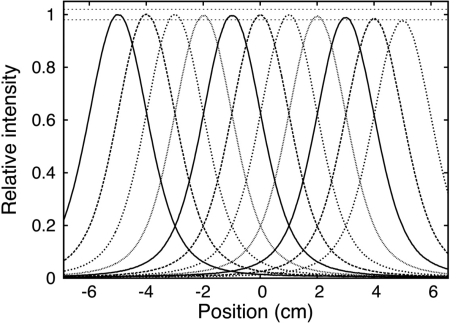
We have also studied proton beam intensity as a function of the spot position in the x-y plane. Intensity profiles of spot delivered over a distance of 10 cm along the x-axis is shown on Fig. 7. We see that the response of the system is stable in a central region (i.e., less than 0.6 % variation over a range of 5 cm). However, as we move away from the center greater discrepancies occur. This is due in part to the truncated light profile as we reach the walls of the LS tank and in part to the vignetting effect. Discrepancies are greater for positive x values because this is the direction of the surface of the LS, and some of the LS light undergoes total internal reflection at the LS-air interface. The peak of profile intensity does not vary by more than 2 %. When varying the proton spots position along the y-axis, the distance, r, between the light emission point and the CCD lens increases. Consequently, the intensity of collected light changes as 1/r2. We have therefore corrected the light intensity for this effect. Results are presented on Table TABLE V.. It is seen that some discrepancies in the intensity measurements remains. These discrepancies are due to attenuation and scattering of the scintillation light by the LS medium. This attenuation is of the form of e−λr, where λ is the attenuation constant. We performed an exponential fit on the data shown in the first two columns of Table TABLE V.. From this fit, we obtained an attenuation constant 7.8 × 10⁻³ cm−1. Using this value, we can further correct the light intensity to down to less than 0.3 % discrepancy. This is shown in the third column of Table TABLE V..
Figure 7.
Relative intensity measurements of proton spots along the x-axis. The pair of horizontal dotted lines represents ±2%.
TABLE V.
Differences in proton intensity as a function of position along the y-axis. The second column show the deviation in % from the light intensity of the spot at y = 0 cm after correction of the varying distances between the spot and the CCD camera. The third column further correct for the attenuation inside the LS.
| y coordinate (cm) | Deviation after distance correction (%) | Deviation after att. correction (%) |
|---|---|---|
| −5 | 3.7 | 0.2 |
| −2.5 | 2.0 | 0.2 |
| 2.5 | −2.1 | 0.1 |
| 5 | −4.6 | −0.3 |
CONCLUSIONS
In this work, our goal was to measure proton spot position, range and intensity with accuracy sufficient for QA purposes. We have shown that the position and range of proton spots can be determined with submillimeter accuracy after a proper calibration of the system. For IMPT treatments that typically use thousands of proton spots, being able to verify accurately the position and range of each of these by delivering a single treatment fraction to our LS detector system would be a great advantage. In addition, range measurement is also an indirect verification of the beam energy. We have found range measurement to be typically more accurate than lateral position measurement, but there is no clear reason why this should be the case. One possibility is that the proton delivery system itself has a greater uncertainty with lateral position because of the steering magnets than with range, which is determined only by the beam energy.
Relative intensity measurement can be performed accurately and precisely even for single proton spots. However, corrections must be applied for off-axis spot position. Measurements along the x-axis were found to be more accurate than along the y-axis mostly because of the imaging geometry. Adding a second CCD camera would alleviate the problem of intensity measurement in the axial direction.
Our prototype is currently equipped with only one CCD camera. This means that, for a full 3D verification of a proton treatment, it will be necessary to deliver the treatment twice. Once with the system positioned as in Fig. 1 and then with the system in a position orthogonal to the first one. Nevertheless, this would be faster than verification with ion chamber where the full treatment has to be delivered every time the ion chamber changes position. With the addition of a second orthogonal CCD camera to the prototype, we would need to deliver the treatment only once for a full 3D verification.
ACKNOWLEDGMENTS
This research was supported in part by the National Cancer Institute (Grant Nos. 1R01CA120198-01A2 and 2P01-CA021239-29A1).
References
- Lomax A., Bortfeld T., Goitein G., Debus J., Dykstra C., Tercier P., Coucke P., and Mirimanoff R., “A treatment planning intercomparison of proton and intensity modulated photon radiotherapy,” Radiother. Oncol. 51, 257–271 (1999). 10.1016/S0167-8140(99)00036-5 [DOI] [PubMed] [Google Scholar]
- Gillin M., Sahoo N., Bues M., Ciangaru G., Sawakuchi G., Poenisch F., Arjomandy B., Martin C., Titt U., Suzuki K., Smith A., and Zhu X., “Commissioning of the discrete spot scanning proton beam delivery system at the University of Texas M.D. Anderson Cancer Center, Proton Therapy Center, Houston,” Med. Phys. 37, 154–163 (2010). 10.1118/1.3259742 [DOI] [PMC free article] [PubMed] [Google Scholar]
- Zhu X., Sahoo N., Zhang X., Robertson D., Li H., Choi S., Lee A., and Gillin M., “Intensity modulated proton therapy treatment planning using single-field optimization: The impact of monitor unit constraints on plan quality,” Med. Phys. 37, 1210–1219 (2010). 10.1118/1.3314073 [DOI] [PMC free article] [PubMed] [Google Scholar]
- Peterson S., Polf J., Bues M., Ciangaru G., Archambault L., Beddar S., and Smith A., “Experimental validation of a Monte Carlo proton therapy nozzle model incorporating magnetically steered protons,” Phys. Med. Biol. 54, 3217–3229 (2009). 10.1088/0031-9155/54/10/017 [DOI] [PubMed] [Google Scholar]
- Lomax A., Böhringer T., Bolsi A., Coray D., Emert F., Goitein G., Jermann M., Lin S., Pedroni E., Rutz H., Stadelmann O., Timmermann B., Verwey J., and Weber D., “Treatment planning and verification of proton therapy using spot scanning: Initial experiences,” Med. Phys. 31, 3150–3157 (2004). 10.1118/1.1779371 [DOI] [PubMed] [Google Scholar]
- Pedroni E., Scheib S., Böhringer T., Coray A., Grossmann M., Lin S., and Lomax A., “Experimental characterization and physical modelling of the dose distribution of scanned proton pencil beams,” Phys. Med. Biol. 50, 541–561 (2005). 10.1088/0031-9155/50/3/011 [DOI] [PubMed] [Google Scholar]
- Safai S., Lin S., and Pedroni E., “Development of an inorganic scintillating mixture for proton beam verification dosimetry,” Phys. Med. Biol. 49, 4637–4655 (2004). 10.1088/0031-9155/49/19/013 [DOI] [PubMed] [Google Scholar]
- Boon S., van Luijk P., Schippers J., Meertens H., Denis J., Vynckier S., Medin J., and Grusell E., “Fast 2D phantom dosimetry for scanning proton beams,” Med. Phys. 25, 464–475 (1998). 10.1118/1.598221 [DOI] [PubMed] [Google Scholar]
- Gustavsson H., Bäck S., Medin J., Grusell E., and Olsson L., “Linear energy transfer dependence of a normoxic polymer gel dosimeter investigated using proton beam absorbed dose measurements,” Phys. Med. Biol. 49, 3847–3855 (2004). 10.1088/0031-9155/49/17/002 [DOI] [PubMed] [Google Scholar]
- Nohtomi A., Sakae T., Terunuma T., Tsunashima Y., Hosono K., and Hayakawa Y., “Measurement of depth-dose distribution of protons by an imaging plate,” Nucl. Instrum. Methods Phys. Res. A 511, 382–387 (2003). 10.1016/S0168-9002(03)01952-1 [DOI] [Google Scholar]
- Cirio R., Garelli E., Schulte R., Amerio S., Boriano A., Bourhaleb F., Coutrakon G., Donetti M., Giordanengo S., Koss P., Madon E., Marchetto F., Nastasi U., Peroni C., Santuari D., Sardo A., Scielzo G., Stasi M., and Trevisiol E., “Two-dimensional and quasi-three-dimensional dosimetry of hadron and photon beams with the magic cube and the pixel ionization chamber,” Phys. Med. Biol. 49, 3713–3724 (2004). 10.1088/0031-9155/49/16/017 [DOI] [PubMed] [Google Scholar]
- Beddar S., Archambault L., Sahoo N., Poenisch F., Chen G., Gillin M., and Mohan R., “Exploration of the potential of liquid scintillators for real-time 3D dosimetry of intensity modulated proton beams,” Med. Phys. 36, 1736–1743 (2009). 10.1118/1.3117583 [DOI] [PMC free article] [PubMed] [Google Scholar]
- Poenisch F., Archambault L., Briere T., Sahoo N., Mohan R., Beddar S., and Gillin M., “Liquid scintillator for 2D dosimetry for high-energy photon beams,” Med. Phys. 36, 1478 (2009). 10.1118/1.3106390 [DOI] [PMC free article] [PubMed] [Google Scholar]
- Archambault L., Briere T., and Beddar S., “Transient noise characterization and filtration in CCD cameras exposed to stray radiation from a medical linear accelerator,” Med. Phys. 35, 4342–4351 (2008). 10.1118/1.2975147 [DOI] [PMC free article] [PubMed] [Google Scholar]
- Brun R. and Rademakers F., “ROOT-an object oriented data analysis framework,” Nucl. Instrum. Methods Phys. Res. A 389, 81–86 (1997). 10.1016/S0168-9002(97)00048-X [DOI] [Google Scholar]
- Bortfeld T., “An analytical approximation of the Bragg curve for therapeutic proton beams,” Med. Phys. 24, 2024–2033 (1997). 10.1118/1.598116 [DOI] [PubMed] [Google Scholar]
- Berger M. J., Penetration of Proton Beams Through Water 1. Depth-dose Distribution, Spectra and LET Distribution (NIST, Gaithersburg, MD, 1993). [Google Scholar]
- Fukushima Y., Hamada M., Nishio T., and Maruyama K., “Development of an easy-to-handle range measurement tool using a plastic scintillator for proton beam therapy,” Phys. Med. Biol. 51, 5927–5936 (2006). 10.1088/0031-9155/51/22/014 [DOI] [PubMed] [Google Scholar]
- Archambault L., Polf J., Beaulieu L., and Beddar S., “Characterizing the response of miniature scintillation detectors when irradiated with proton beams,” Phys. Med. Biol. 53, 1865–1876 (2008). 10.1088/0031-9155/53/7/004 [DOI] [PMC free article] [PubMed] [Google Scholar]


