Abstract
Modeling laryngeal aerodynamics requires specification of the glottal geometry. Changing the glottal exit radius alters the intraglottal pressure distributions in the converging glottis [Scherer et al., J. Acoust. Soc. Am. 110, 2267–2269 (2001)]. This study examined the effects of the glottal entrance radius on the intraglottal pressure distributions for divergent angles of 5°, 10°, 20°, 30°, and 40°. Glottal airflow and minimal glottal diameter were held constant at 73.2 cm3/s and 0.02 cm, respectively. The computational code FLUENT was used to obtain the pressure distributions. Results suggest that a smaller glottal entrance radius tends to (1) lower the transglottal pressure (reduce glottal flow resistance), although this is angle dependent, (2) make the pressure dip near the glottal entrance more negative in value, (3) increase the slope of the pressure distribution just upstream of the glottal entrance, and (4) make the initial pressure recovery (rise) in the glottis steeper. A general empirical equation for transglottal pressure as a function of radius, angle, and separation point location is offered. These results suggest that glottal entrance curvature for the divergent glottis significantly affects the driving pressures on the vocal folds, and needs to be well specified when building computational and physical models.
INTRODUCTION
To model flow-induced laryngeal phonation, the distribution of air pressures that act upon the vocal folds, as well as the tissue properties of the vocal folds, are required (Ishizaka and Flanagan, 1972). Nonvibratory modeling efforts to measure pressure distributions require the specification of the glottal geometry. This includes, among other details, the degree of glottal adduction (van den Berg et al., 1957), the included glottal angle (the angle between the medial surfaces of the vocal folds) (Gauffin et al., 1983), the slant (obliquity) of the glottis (Scherer et al., 2001a; Shinwari et al., 2003), the anterior–posterior shape of the medial vocal fold surface (Alipour and Scherer, 2000; Scherer et al., 2010), and the curvature of the vocal folds at the glottal entrance and exit locations (Scherer et al., 2001b).
The effects on pressure distributions in the glottis due to changes in the exit curvature (radius) of the vocal folds for a converging glottis shape have been studied (Scherer et al., 2001b). Results indicated that pressure magnitudes and the shape of the pressure distribution on the glottal walls are highly dependent upon the radius of the glottal exit curvature. For example, an exit radius change from 0.0908 to 0.005 cm, making the exit less rounded, for a 10° convergence glottal angle resulted in a 13% rise in the transglottal pressure and an increase of the glottal entrance pressure by 21%. In addition, a decreased exit radius caused the minimum pressure to move downstream in the glottal section.
To extend that work, the research reported here examined the effects on the transglottal and intraglottal (normal) wall pressures when the entrance radius and the divergent glottal angle were varied. The divergent glottis for modal voice takes place during the time when the glottis is closing within the phonatory cycle. If variation of the glottal entrance radius were to create substantial changes in the transglottal and glottal wall pressures, the motion of the vocal folds and the shape and size of the glottal volume velocity may also be significantly affected, thus altering the resulting phonatory sound. Physical and numerical models of glottal motion would need to take such effects into account.
METHODS
The study here used static geometries and a constant volume flow, and assumed the quasi-steady condition for phonation (Mongeau et al., 1997; Vilain et al., 2004). FLUENT (Fluent, Inc., Lebanon, NH), a commercially available computational fluid dynamics package, was used as in an earlier study (Scherer et al., 2001b) to obtain the intraglottal pressure distributions of this study. In the past the laminar FLUENT code has matched empirical results well for constant flows in the laryngeal Plexiglas model M5 (Scherer et al., 2001a), suggesting its use here. The code solves the Navier–Stokes equations using a control-volume technique with structured and unstructured meshes, second-order solutions for momentum and pressure, and residuals of less than 10–4. The mesh size varied from 125 000 to 338 000 nodes, with finer mesh in regions where high gradients in pressure and/or velocity were expected. The flow field was assumed to be symmetric across the midline of the glottis in this study, and therefore only the half-field flow was modeled.
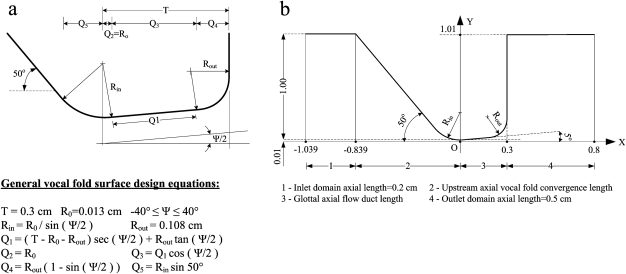
Five divergent glottal angles, 5°, 10°, 20°, 30°, and 40°, were designed for this study, and four glottal entrance radii (Rin) were used for each angle (except for 5°, for which three entrance radii were used). Figure 1a is a schematic of the general design of the modeled vocal folds. The shape of the vocal fold at the glottal entrance was well defined by the parametrically varied radius. A straight section along the vocal fold wall connected the entrance and exit radii. The included glottal angle and the entrance radii for each angle were specified as independent variables. The glottal exit radius was held constant throughout. All aspects of the design follow from these specifications.
Figure 1.
Schematic of the design of the vocal folds. (a) The shape of the vocal fold with the design equations for the entrance radius of each glottal angle. For the largest entrance radius for each glottal angle, the minimal diameter was placed at a position of 0.05 cm downstream from the 0.0 cm glottal entrance location except for 5°, for which the minimal diameter was 0.07 cm downstream (see Figs. 23). The minimal glottal diameter for all cases was 0.02 cm. (b) The outline of the glottal configuration for a divergent 10° glottal angle (5° half-angle). Distances are in centimeters.
Because human glottal entrance radii are not known, a range that reflects a relatively sharp edge to a relatively rounded edge was chosen. Table TABLE I. shows the entrance radii for each glottal angle. The largest entrance radius for each glottal angle was defined such that the position of the minimal glottal diameter was 0.25 cm upstream of the glottal exit (except for the smallest angle, 5°, with minimal diameter 0.23 cm upstream of the exit). Also, the smallest entrance radius for all of the glottal angles was set to 0.005 cm. To keep the study consistent with the previous study (Scherer et al., 2001b), held constant were the glottal length [1.2 cm, out of the page in Fig. 1b], the minimal glottal diameter (0.02 cm), the glottal exit radius Rout (0.108 cm), the subglottal entrance angle (50° relative to the flow axis) (Agarwal, 2004), the upstream (tracheal) inlet domain axial length (0.2 cm), the downstream outlet domain axial length (0.5 cm), and the flow (73.2 cm3/s, with corresponding Reynolds number Re = 809.9). For all cases, the upstream velocity inlet condition was uniform (30.198 cm/s, corresponding to a constant 73.2 cm3/s flow), and the pressure at the end of the domain was set to 0 cm H2O. The model solver was the unsteady formulation, with a time step of 10–5 s. A nominal axial glottal duct length of 0.30 cm (the length used in the prior study) was included for one radius condition (italicized in Table TABLE I., third column) for each of the five angle cases.
TABLE I.
The glottal entrance radii for each glottal angle.
| Glottal angle (deg) | Glottal entrance radii (cm) | |||
|---|---|---|---|---|
| 5 | 0.298 | 0.149 | 0.005 | — |
| 10 | 0.257225 | 0.1500 | 0.0750 | 0.005 |
| 20 | 0.182525 | 0.0753 | 0.03765 | 0.005 |
| 30 | 0.157453 | 0.050228 | 0.025114 | 0.005 |
| 40 | 0.145449 | 0.038224 | 0.019112 | 0.005 |
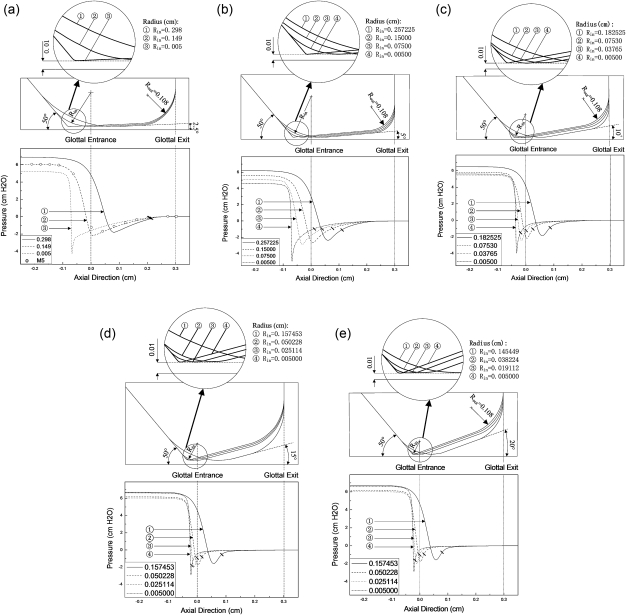
As shown in the upper portions of Figs. 2a, 2b, 2c, 2d, 2e, the decision was made to keep the inferior and superior surfaces of the vocal folds in the same locations, simultaneously keeping the minimal glottal diameter constant for the different glottal entrance radii. This decision seemed reasonable because it was assumed that the location of the inferior surface of the vocal fold would be more constant than the shaping of the vocal fold near the glottal entrance. Thus, as the glottal entrance radius became smaller for any glottal angle, the location of the minimal glottal diameter moved upstream, as shown in Fig. 2. Also, the location of the minimal glottal diameter moved downstream as the glottal angle increased for any specific entrance radius.
Figure 2.
Glottal configurations and their pressure distributions specified by FLUENT for different glottal entrance radii conditions for (a) 5°, (b) 10°, (c) 20°, (d) 30°, and (e) 40° divergent glottal angle cases. The upper portion shows the outlines of the glottal configurations corresponding to the entrance radii (the entire vocal fold is not shown). Distances are in centimeters. The lower portion gives the pressure distributions specified by FLUENT as well as the Plexiglas model M5 data (circle symbols) for the 0.149 cm entrance radius condition for (a). The radii are in centimeters. The flow was 73.2 cm3/s and the minimal diameter was 0.02 cm for all cases. The flow for the empirical model M5 data was 68.7 cm3/s for (a). The flow separation locations are indicated by the backward-slanted symbols on the pressure distributions.
The flow and diameter conditions gave reasonable transglottal pressures expected during normal phonation (∼5–7 cm H2O). The transglottal pressure was defined as the difference between the pressure at the inlet domain section and the pressure at the glottal exit. The superior surface of the vocal folds was perpendicular to the flow axis. The false vocal folds were not included.
RESULTS
Pressure distributions
Figure 2a shows the results for the 5° divergence case. The upper portion of Fig. 2a gives the configurations for the vocal folds and glottis, including the three vocal fold radii that defined the glottal entrance. The lower portion of Fig. 2a shows the normal surface pressure distributions specified by FLUENT. In order to verify the FLUENT results, the experimental data from the Plexiglas model M5 with a 0.149 cm entrance radius are also shown. The excellent match suggests that FLUENT was sufficiently accurate in predicting the empirical pressures for this glottal angle, and most likely for the remainder of the study.
The cross-sectional area reduction caused by the convergent inferior vocal fold surfaces, especially near the glottal entrance, caused the flow to accelerate and the pressure to decrease. The minimum pressure occurred just past the location of the minimal diameter [e.g., see the r = 0.005 cm case, number 3 in Fig. 2a, where the minimal diameter occurred at –0.08 cm, but the minimum pressure occurred at –0.067 cm], with subsequent pressure rise (recovery) within the glottis.
For the constant flow used in this study, the main results for the case of the included glottal angle of 5° [Fig. 2a] are as follows. (1) The transglottal pressures (seen as the intercepts of the pressure distribution on the y-axis) decreased as the glottal entrance radius became smaller. The pressure values along the inferior vocal fold surface were therefore also lower as the entrance radius became smaller. The transglottal pressure decreased by 24% between the largest and the smallest radius conditions, a result that also corresponds to a decrease in flow resistance as the radius decreased (because the flow was held constant in this study). (2) The location of the minimum pressure moved upstream as the radius became smaller (a distance of 0.13 cm between the largest and smallest entrance radius) due to the movement of the location of the minimal diameter also upstream. (3) The minimum pressure near the position of the minimal diameter decreased (became more negative) as the radius became smaller (between the largest and smallest radius, the minimum pressure dropped by 2.44 cm H2O). (4) As the radius decreased, there was a sharper drop (steeper slope) of the pressure distribution upstream of the minimum pressure location. (5) The pressure recovery in the glottis was initially steeper for smaller radii.
Similar (but not identical) results appear for the 10°, 20°, 30°, and 40° cases as shown in Figs. 2b–2e. Similar to the 5° case, (1) the location of the minimum pressure moved upstream as the radius became smaller, (2) the pressure near the position of the minimal diameter decreased (became more negative) as the radius became smaller (by 2.57, 2.11, 1.33, and 0.95 cm H2O for the largest versus smallest radius for the 10°, 20°, 30°, 40° cases, respectively), (3) as the radius decreased, there was a sharper drop (steeper slope) of the pressure distribution upstream of the minimum pressure location, and (4) the pressure recovery was initially steeper for smaller entrance radii.
In this study the position of the inferior and superior vocal fold surfaces were kept constant (Li et al., 2006a), creating a varying effective glottal duct length, longer for smaller glottal entrance radii. This placed the pressure distribution along the inferior vocal fold surface typically more inferiorly (more “left” in the figures) for smaller radii. If the axial glottal duct length were kept constant (i.e., from the location of the minimal diameter to the glottal exit), the inferior vocal fold surface would have moved more downstream as the radius decreased, decreasing the area of the vocal fold tissue cross section. If this were chosen for pressure comparisons, the location of the minimum pressures (the negative pressure dips) would have been more coincident because the minimal glottal diameters would have been located at the same place, and the pressure distribution shapes and magnitudes would have shifted to the right but not affected significantly.
Transglottal pressures
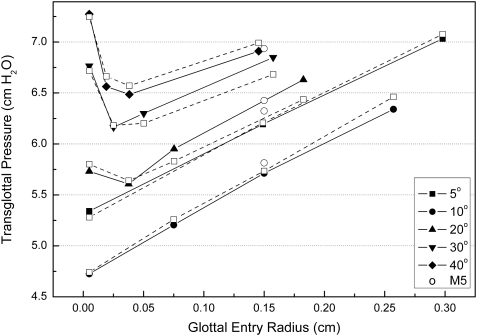
Figure 3 shows the transglottal pressures for the five glottal angles and all glottal entrance radii. Figure 3 also includes the experimental (model M5) transglottal pressures corresponding to the 0.15 cm entrance radius for glottal angles of 5°, 10°, 20°, and 40°. Although there are small differences, the empirical transglottal pressures support the computational results. The 10° glottal angle condition had the lowest transglottal pressures at each of the entrance radii, followed by 5°, then 20°, 30°, and 40°, supporting the general finding that a diffuser of approximately 10° is the most “efficient” (least flow resistive) (Kline, 1959; Li et al., 2006b).
Figure 3.
The transglottal pressure values for each entrance radius case for the five glottal angles. Circles are the experimental (model M5) transglottal pressures for the 0.15 cm entrance radius for the 5°, 10°, 20°, and 40° cases. The predicted transglottal pressure values from empirical equation 1 are shown as square characters and dashed lines.
In general, as the entrance radius increased, transglottal pressure increased for the constant flow used. This held for all radii for the glottal angles of 5° and 10°. For 20°, 30°, and 40°, the smallest entrance radii gave rise to a significant increase in transglottal pressure (and therefore an increase in flow resistance), but returned to the more consistent behavior for larger entrance radii.
The rise in transglottal pressure with entrance radius could be relatively large. For example, the increase of the radius from 0.005 to 0.298 cm for the 5° glottal angle caused a 1.66 cm H2O transglottal pressure change, which is 32% and 24% of their transglottal pressures, respectively, suggesting that changing the glottal entrance radius alone can cause a significant difference in the transglottal pressure, thereby affecting the glottal flow resistance.
DISCUSSION
Friction and form drag
Friction drag and form drag should account for the magnitude of the transglottal pressure. Friction drag is the result of viscous shear of the air near the surface of the vocal folds, which may dominate in regions of small diameter. Form drag, on the other hand, is the result of pressures exerted axially on the vocal fold surfaces, and is associated with the shape of the vocal folds and glottis, and the adverse pressure gradient causing flow separation in the glottis and subsequent kinetic energy loss (Blevins, 1984; Scherer et al., 2001b). Compared to the form drag, the friction drag for all cases in this study had small values, as the diameter was 0.02 cm and the length of the minimal glottal section was relatively short for these divergent cases. For example, for the 0.298 cm radius for the 5° glottal angle case, the form drag was 0.082 N, and the friction drag was only 0.00045 N, the form drag being more than 180 times the friction drag, suggesting that the form drag was the dominant component in determining the transglottal pressures in this experiment.
Transglottal pressure, flow separation, and entrance radius
For the five glottal angle cases, the largest glottal entrance radius produced the greatest (or nearly the greatest) transglottal pressure. It is observed (Figs. 23) that larger radii corresponded to a shorter length between the minimal diameter and glottal exit, and also a greater upstream pressure gradient length (from the trachea to the minimal diameter). For example, when the glottal entrance radius increased from 0.005 to 0.298 cm for the 5° glottal angle case, the length of the adverse pressure gradient region (from the minimal diameter location to the glottal exit) decreased from 0.367 to 0.22 cm (a decrease of 40.1%). Simultaneously, the forces acting on the upstream section increased from 0.062 to 0.082 N (a 32% increase), and the transglottal pressure increased by 1.77 cm H2O (33%).
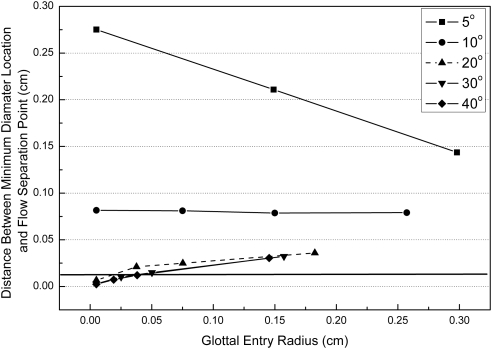
Figure 4 shows the distance from the minimal diameter to the flow separation point location (MS). A few observations can be made. (1) For the case of the 5° glottal angle, separation always occurred in the downstream half of the glottal duct, and nearest the exit for the smallest radius 0.005 cm. Smaller glottal entrance radii for the 5° glottal angle moved the position of the minimal diameter upstream, but moved the separation point less upstream, creating a longer glottal divergent duct between the minimal diameter and the separation point (MS). This longer MS distance, further, corresponded to less energy loss (less transglottal pressure) (Pelorson et al., 1994; Alipour and Scherer, 2004). (2) For the 10° glottal angle the distance from the minimal diameter to the separation point remained approximately constant (Fig. 4). Here, as the radius reduced, the locations of both the minimal diameter and the flow separation moved upstream about the same amount (also elongating the distance from separation to glottal exit). This also resulted in a lower transglottal pressure as the radius decreased. (3) However, when the glottal angle was 20°, 30°, and 40°, the distance between the minimal diameter and the separation point decreased as the radius decreased (Fig. 4), and the distance between the separation point and the glottal exit increased as the glottal entrance radius decreased. The transglottal pressure has a special rise for the next to smallest radius to the smallest radius (0.005 cm) for the 20°, 30°, and 40° glottal angles, and the larger the glottal angle, the higher the corresponding transglottal pressure rise (Fig. 3). This phenomenon appears to be related to the flow separation points moving more upstream (while already close to the minimal diameter); the more upstream the flow separation location, the larger the transglottal pressure rise (Pelorson et al., 1994; Alipour and Scherer, 2004). The “threshold” line in Fig. 4 appears to suggest that for MS values below 0.0125 cm, the upturn in transglottal pressure will occur.
Figure 4.
The distance (MS) from the glottal minimal diameter location to the flow separation point location for each radius and each glottal angle. The horizontal line is a “threshold” of approximately 0.0125 cm (see the text).
The 5° divergent angle is below the stall angle, the 10° divergent angle is within the large transitory stall regime, and the 20°, 30°, and 40° divergent angles are within the steady fully developed stall regime, according to Kline (1959). These three different regimes are mirrored by the three distinct patterns for the MS values shown in Fig. 4.
Generalized empirical equation for transglottal pressure
An empirical equation was obtained to predict the transglottal pressure as a function of the radius, divergent glottal angle, and the separation point location. A nonlinear regression was performed using the Levenberg–Marquardt method (ProStat software). The equation is
| (1) |
where P stands for the transglottal pressure (cm H2O), θ is the divergent glottal angle in degrees, R is the entrance radius, SE is the distance between the separation point location and the glottal exit, and MS is the distance from the minimal diameter to the separation point (all distances in centimeters). The coefficient of determination was 0.98 for this equation, and the fit to the data is reasonable, as shown in Fig. 3 by the unfilled square symbols and dashed lines.
Separation cross-sectional area ratio
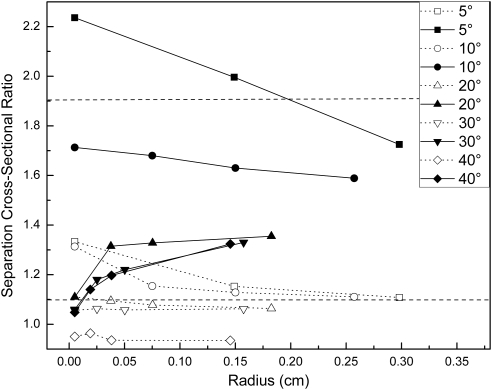
Figure 5 shows the ratio of the glottal cross-sectional area at the flow separation location and the minimal glottal cross-sectional area (the separation cross-sectional area ratio) for each glottal angle and radius case. The ratio varied from about 1.05 to 2.24. The average value of 1.43 is approximately the same as in the dynamic computational study by Alipour and Scherer (2004; average of 1.47), but their range (1.1–1.9, seen by the horizontal lines in Fig. 5) was narrower than in this nondynamic study. The lossless prediction equation presented in Shinwari et al. [2003; Eq. 1] creates the range of the ratio from 0.935 to 1.33 (average 1.09, standard deviation> = 0.11), narrower than in the current study. The ranges of previous studies are narrower than the range of ratios in this study, suggesting the importance of the effects of the glottal entrance radii, as well as glottal angle, and especially the axial distance from the minimal diameter location to the separation point.
Figure 5.
The separation cross-sectional ratio (glottal area at the flow separation location divided by the minimal glottal area) for the different glottal angles and glottal radii (filled symbols), and the calculated ratio according to the lossless Bernoulli expression given in Shinwari et al. (2003), viz., Ds/Dm = [1 – (Pmin/Pt)]0.5, where Ds is the glottal diameter at the separation point, Dm is the minimal glottal diameter, Pmin is the pressure at the minimal glottal diameter location, and Pt is the transglottal pressure, given by the unfilled symbols. The assumption of atmospheric pressure at flow separation was assumed for this expression. Also included are horizontal lines that indicate the range of ratio values reported in Alipour and Scherer (2004).
Maximum pressure drop
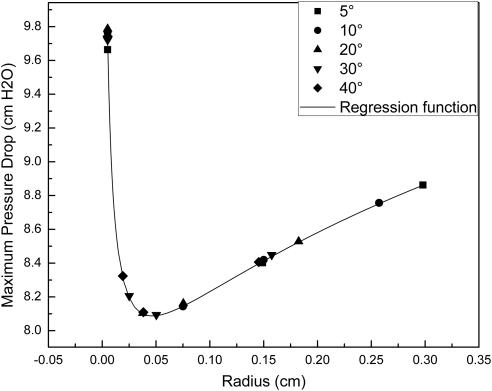
Figure 6 shows the maximum pressure drops (Pm) between the trachea (subglottal pressure) and the glottis (the minimum pressure dip) for all of the entrance radius and angle cases. A nonlinear regression was performed (using the Levenberg–Marquardt method, ProStat software), yielding
| (2) |
suggesting that Pm may be dependent only on the entrance radius, and not on the glottal divergent angle, a finding that needs further exploration. The data and line-fit seen in Fig. 6 suggest that Pm is highly sensitive to small radii (smaller than 0.05 cm, below which Pm rises quickly), and less sensitive to larger radii (larger than 0.05 cm, above which Pm rises slowly).
Figure 6.
The maximum pressure drops from the trachea to the minimal glottal pressures for each entrance radius case for the five glottal angles. The predicted pressure drop values from empirical equation 2 are shown as the solid line.
Tissue strain
From a tissue health viewpoint, the smaller glottal entrance radius creates a more negative pressure dip and a larger gradient of pressure force on the vocal fold tissue near the glottal entrance. That is, pressures are shown to change from the positive subglottal value to a negative value over a very short distance near the glottal entrance, creating a push-pull force of significant magnitude. This would tend to place a local strain (stretch) on the tissue for a brief period of time during the phonatory cycle, the adverse effects of which need to be studied. A large entrance radius creates a smaller pressure gradient near the glottal entry, and therefore less local potential strain. However, the more rounded the entrance, the more downstream and less in magnitude the negative pressure, thus potentially contributing less to the vertical phasing of the vocal folds, especially if the minimum pressure were to occur halfway or further down the glottis so that the negative pressure would not be acting directly on the upstream half of the glottis to help pull the upstream portion toward closure.
General statement
Because this study used a computational package to study the half-field, and also assumed symmetry of flows and pressures, the results did not allow for any aerodynamic asymmetry that may be expected, as shown in numerous papers (Alipour et al., 1996; Scherer et al., 2001a). However, this study does appear to suggest meaningful differences in pressure distributions that are dependent on the glottal entrance radius. The results here, combined with the results for convergent glottal exit shapes (Scherer et al., 2001b), strongly suggest that phonatory models of the glottis (physical and computational) need to well define the glottal entrance and exit radii because they are expected to govern the resulting pressure force distributions to a large extent, and therefore also the resulting motion of the vocal folds and glottal airflow.
In general, a smaller glottal entrance and exit radius lengthens the effective glottis and creates a greater negative pressure dip near the glottal entrance for the divergent glottis, and a greater positive intraglottal pressure for the convergent glottis.
CONCLUSIONS
This study examined the effects of the radius of the vocal folds at glottal entry on the intraglottal pressure distributions and transglottal pressures for different divergent glottal angles. The results of this steady-flow study using the commercially available FLUENT package suggest that both the pressure magnitudes and the shape of the pressure distributions are significantly affected by the radius value. A smaller radius tends to (1) decrease the transglottal pressure except for larger angles with small radii, (2) move the minimum pressure near glottal entrance more upstream, (3) make the pressure dip near glottal entrance more negative in value, (4) increase the slope of the pressure distribution just upstream of the glottal entrance, thereby creating forces of interest to tissue strain issues, and (5) make the initial pressure recovery (rise) in the glottis steeper. The study here extends a similar study for converging glottal angles and the effect of glottal exit radii on intraglottal pressures (Scherer et al., 2001b). Together they suggest that the radius of curvature of the glottal entrance and exit is an important geometric aspect that partially governs the driving pressures, flows, and subsequent motion of the vocal folds.
The study here was limited to one minimal glottal diameter (0.02 cm) and one flow rate (73.2 cm3/s), did not permit asymmetrical flows, and was computational, not empirical.
The results suggest that aerodynamic and aeroacoustic studies of phonation should carefully model laryngeal geometry and include the effects of glottal entrance and exit curvature that may occur during phonation, especially as the curvature may reflect normal to pathological states of the surface of the vocal fold.
ACKNOWLEDGMENTS
This work was supported in part by the National Natural Science Foundation of China (Grant Nos. 30070212 and 69925101) and the National Institutes of Health (Grant No. 2 R01 DC03577). We would like to thank Bogdan Kucinschi for his help concerning the use of FLUENT.
References
- Agarwal, M. (2004). The False Vocal Folds and Their Effect on Translaryngeal Airflow Resistance (Bowling Green State University, Bowling Green, OH: ), Chap. 3, pp. 123–134. [Google Scholar]
- Alipour, F., Fan, C., and Scherer, R. C. (1996). “A numerical simulation of laryngeal flow in a forced-oscillation glottal model,” Comput. Speech Lang. 10, 75–93. 10.1006/csla.1996.0005 [DOI] [Google Scholar]
- Alipour, F., and Scherer, R. C. (2000). “Dynamic glottal pressures in an excised hemilarynx model,” J. Voice 14, 443–454. 10.1016/S0892-1997(00)80002-8 [DOI] [PubMed] [Google Scholar]
- Alipour, F., and Scherer, R. C. (2004). “Flow separation in a computational oscillating vocal fold model,” J. Acoust. Soc. Am. 116, 1710–1719. 10.1121/1.1779274 [DOI] [PubMed] [Google Scholar]
- Blevins, R. D. (1984). Applied Fluid Dynamics Handbook (Van Nostrand Reinhold, New York: ), Chap. 10, pp. 279–280. [Google Scholar]
- Gauffin, J., Binh, N., Ananthapadmanabha, T. V., and Fant, G., (1983). “Glottal geometry and volume velocity waveform,” in Vocal Fold Physiology: Contemporary Research and Clinical Issues, edited by Bless D. M., and Abbs J. H.. (College-Hill, San Diego, CA: ), pp. 194–201. [Google Scholar]
- Ishizaka, K., and Flanagan, J. L., (1972). “Synthesis of voiced sounds from a two-mass model of the vocal cords,” Bell Syst. Tech. J. 51, 1233–1268. [Google Scholar]
- Kline, S. J., (1959). “On the nature of stall,” J. Basic Eng. 81, 305–319. [Google Scholar]
- Li, S., Scherer, R. C., Wan, M., Wang, S., and Wu, H., (2006a). “Numerical study of the effects of inferior and superior vocal fold surface angles on vocal fold pressure distributions,” J. Acoust. Soc. Am. 119, 3003–3010. 10.1121/1.2186548 [DOI] [PubMed] [Google Scholar]
- Li, S., Scherer, R. C., Wan, M., Wang, S., and Wu, H. (2006b). “The effect of glottal angle on intraglottal pressure,” J. Acoust. Soc. Am. 119, 539–548. 10.1121/1.2133491 [DOI] [PubMed] [Google Scholar]
- Mongeau, L., Franchek, C., Coker, R., and Kubli, R. A., (1997). “Characteristics of a pulsating jet through a small modulated orifice, with applications to voice production,” J. Acoust. Soc. Am. 102, 1121–1134. 10.1121/1.419864 [DOI] [PubMed] [Google Scholar]
- Pelorson, X., Hirschberg, A., Wijnands, A. P. J., and Auregan, Y., (1994). “Theoretical and experimental study of quasisteady-flow separation within the glottis during phonation. Application to a modified two-mass model,” J. Acoust. Soc. Am. 96, 3416–3431. 10.1121/1.411449 [DOI] [Google Scholar]
- Scherer, R. C., Shinwari, D., Witt, K. J. D., Zhang, C., Kucinschi, B. R., and Afjeh, A. A., (2001a). “Intraglottal pressure profiles for a symmetric and oblique glottis with a divergence angle of 10 degrees,” J. Acoust. Soc. Am. 109, 1616–1630. 10.1121/1.1333420 [DOI] [PubMed] [Google Scholar]
- Scherer, R. C., Torkaman, S., Kucinschi, B. R., and Afjeh, A. A., (2010). “Intraglottal pressures in a three-dimensional model with a non-rectangular glottal shape,” J. Acoust. Soc. Am. 128, 828–838. 10.1121/1.3455838 [DOI] [PMC free article] [PubMed] [Google Scholar]
- Scherer, R. C., Witt, K. J. D., and Kucinschi, B. R. (2001b). “The effect of exit radii on intraglottal pressure distributions in the convergent glottis (L),” J. Acoust. Soc. Am. 110, 2267–2269. 10.1121/1.1408255 [DOI] [PubMed] [Google Scholar]
- Shinwari, D., Scherer, R. C., J. DeWitt, K., and Afjeh, A. A. (2003). “Flow visualization and pressure distributions in a model of the glottis with a symmetric and oblique divergent angle of 10 degrees,” J. Acoust. Soc. Am. 113, 487–497. 10.1121/1.1526468 [DOI] [PubMed] [Google Scholar]
- van den Berg, Jw., Zantema, J. T., and Doornenbal, P. J. (1957). “On the air resistance and the Bernoulli effect of the human larynx,” J. Acoust. Soc. Am. 29, 626–631. 10.1121/1.1908987 [DOI] [Google Scholar]
- Vilain, C. E., Pelorson, X., Fraysse, C., Deverge, M., Hirschberg, A., and Willems, J. (2004). “Experimental validation of a quasi-steady theory for the flow through the glottis,” J. Sound Vib. 276, 475–490. 10.1016/j.jsv.2003.07.035 [DOI] [Google Scholar]


