Abstract
PURPOSE
To determine (i) the feasibility and intra- and inter- scan reproducibility of T1ρ magnetic resonance imaging (MRI) in assessing cartilage degeneration in a guinea pig model with naturally occurring joint disease that closely mimics human osteoarthritis (OA), (ii) demonstrate the sensitivity of T1ρ MRI in assessing the age dependent cartilage degeneration in OA progression as compared to histopathological changes.
MATERIALS AND METHODS
Duncan-Hartley guinea pigs were obtained at various ages and maintained under an IACUC approved protocol. The left hind stifle joint was imaged using T1ρ MRI on a 9.4 Tesla Varian horizontal 20 cm bore scanner using a custom surface coil. Reproducibility of T1ρ MRI was assessed using four-month old guinea pigs (N=3). Three age cohorts; 3 month (N=8), 5 month (N=6), and 9 month (N=5), were used to determine the age-dependent osteoarthritic changes as measured by T1ρ MRI. Validation of age-dependent cartilage degeneration was confirmed by histology and Safranin-O staining.
RESULTS
T1ρ values obtained in the cartilage of the stifle joint in guinea pigs were highly reproducible with an inter-scan mean coefficient of variation (CV) of 6.57% and a maximum intra-scan CV of 9.29%. Mean cartilage T1ρ values in animals with late stage cartilage degeneration were 56.3 – 56.9 ms (5 – 9 month cohorts) were both significantly (p<0.01) higher than that obtained from 3-month old cohort (44 ms) demonstrating an age-dependent variation. T1ρ was shown to be significantly greater than T2. T1ρ dispersion was observed in this animal model for the first time showing an increase of 45% between 500Hz and 1500Hz spin-locking frequency. Cartilage thickness measurements were calculated from single mid-coronal histology sections from same animals used for T1ρ MRI. Thickness calculations showed insignificant differences between 3- and 5 month cohorts and was significantly decreased by 9-months of age (p<0.01). A moderate correlation (R2=0.45) existed between T1ρ values and signal intensity of Safranin-O stain.
CONCLUSION
The data presented demonstrate that T1ρ MRI is highly reproducible in this spontaneous model of OA and may serve as a noninvasive tool to characterize joint cartilage degeneration during OA. Age-dependent changes, verified with histological measurements of proteoglycan loss, correlated with T1ρ across different age groups. T1ρ has adequate dynamic range and is sensitive to detect and track the progression of cartilage degeneration in the guinea pig model before gross anatomical changes such as cartilage thinning has occurred. This study presents a technological advancement that would permit longitudinal studies of evaluating disease-modifying therapies useful for treating human OA.
Keywords: osteoarthritis, T1ρ MRI, animal model, quantitative
INTRODUCTION
Osteoarthritis (OA) is a common and painful condition with a multi-factorial etiology of the musculoskeletal system affecting more than 50% of the U.S. population over 65 (1,2). Early progression of the disease is usually subtle with clinical manifestation occurring in the later stages of the disease. Degeneration of the articular cartilage tissue, which many believe to be a primary factor in the development of OA, is a slow process and typically takes decades to have full thickness loss, but can be significantly accelerated due to trauma or surgical procedures (3). Subsequently, permanent and irreversible damage of the joint has often occurred by the time a clinical diagnosis is made, either by non-invasive joint space measurements via radiography or invasive arthroscopy to examine the joint tissue. Currently there is no cure for the disease and therapeutic interventions are primarily targeted to symptomatic relief. Therefore, it is highly desirable to develop an accurate and sensitive method for early diagnosis and monitoring of OA in patients. Moreover, a non-invasive technique that is sensitive to a relevant tissue biomarker related to early degenerative changes in cartilage would be preferable for longitudinally monitoring OA progression and testing novel treatment methods.
Animal models of OA serve as a bridge between ex vivo tissue analysis and in vivo studies. Apart from surgical or artificially induced cartilage degeneration, several animal models such as mice, guinea pigs, macaques, and beagles have been shown to spontaneously develop OA (4). Among these animals, Dunkin-Hartley guinea pigs have been shown to develop OA with the earliest stage of detection manifesting as early as three to four months of age. Therefore, the Dunkin-Hartley guinea pig model provides a more practical system for the longitudinal studies of the progression of OA (3, 5, 6).
While MRI has been used to detect compositional and morphological changes in the cartilage of the Dunkin-Hartley guinea pigs using T1 and T2 contrast (7), current protocols are not sensitive to the early stages of OA marked by proteoglycan (PG) loss from the extracellular matrix (ECM) of articular cartilage (8, 9, 10). Newer methods, such as delayed gadolinium enhanced MRI of cartilage (dGEMRIC), are promising, but logistic issues such as long waiting periods following the contrast injection, and the need for pre-injection T1 maps, reduce its utility. On the other hand, sodium MRI is a highly specific biomarker for PG, inherently suffers from both low signal and resolution and also requires special hardware (11,12). In this context, T1ρ MRI, a proton-based method that has the ability to generate endogenous contrast in vivo based on cartilage molecular content (13), is a more desirable alternative.
T1ρ is the spin-lattice relaxation time in the rotating frame and is sensitive to the slow-motion interactions (~few Hz to several kHz) such as exchange of hydroxyl and amide group protons on glycosaminoglycan chains of PG with bulk water protons (14) and has been shown to correlate with cartilage proteoglycan content (11, 14). T1ρ has been shown to increase linearly with PG loss in controlled degradation experiments performed on ex vivo bovine patellae samples (14, 15), in the porcine model of IL-1β induced cartilage degeneration (16), and in humans with chondromalacia (17). However, there have been no T1ρ MRI studies in the Dunkin-Hartley guinea pig model with naturally occurring joint disease that closely mimics human OA. In this study, we determine the reproducibility of T1ρ MRI in vivo and use it to track the well-known age-dependent cartilage degeneration verified subsequently by histopathology measurements.
MATERIALS AND METHODS
Animal protocol
The study was approved by the Institutional Animal Care and Use Committee (IACUC). Female Dunkin-Hartley guinea pigs (Charles River Labs, Malvern, PA; Elm Hill Laboratory, Chelmsford, MA) were used in the study and all assessments were made on the left hind stifle. Three separate age cohorts were utilized for age dependent variation assessments: three-month old (N=8), five month old (N=6), and nine month old (N=5). Four month old animals (N=3) were used for reproducibility measurements.
Immediately before imaging, each animal was anesthetized in an induction chamber using 4% isoflurane/O2 mixture at a flow rate of 2.5 L/min for 10 minutes. Animals were then transferred to a custom-made housing platform and placed in the prone position where the hind leg was secured. A custom-made nose cone was placed on the animal’s head delivering anesthesia. The stifle was secured so that load bearing femoral condyle was normal to the tibial plateau which required the joint to be flexed to ~115°. A custom built MRI curved rectangular transceive surface coil (4 cm × 2 cm) was positioned and secured anterior to the joint. After the animal was placed inside the bore, anesthesia was lowered to 1.5–2.5% isoflurane/O2 mixture at 1.5 L/min flow rate for the duration of the imaging session. Body temperature was continuously monitored with a rectal probe and maintained at 37–40°C through a feedback–controlled heater. Heart rate was monitored using subdural electrocardiogram (ECG) leads.
T1ρ MRI
T1ρ MRI pulse sequence based a T1ρ-prepared 3D balanced gradient echo (b-GRE) for a fast volumetric acquisition (18) was coded on a Varian (Varian Inc. Palo alto, CA) pulse-programming environment (Figure 1). The T1ρ-prepared signal decays exponentially as a function of spin-lock pulse duration (TSL) and multiple images generated with varying TSL times are acquired in each imaging session. These T1ρ-weighted images are then fitted pixel-wise to the known signal decay function to generate color-coded T1ρ parametric maps.
Figure 1.
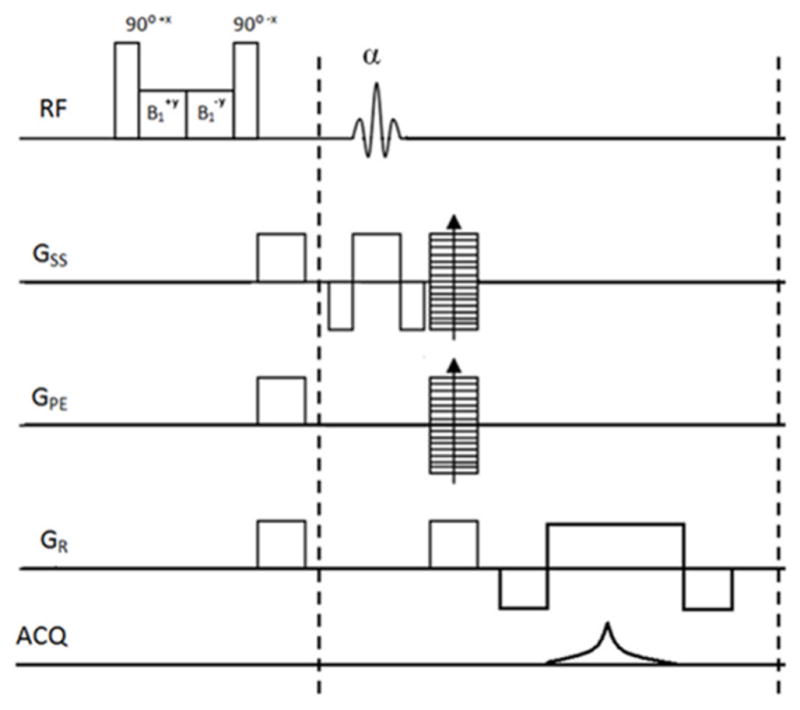
The 3D balanced Gradient Echo (b-GRE) pulse sequence with appended T1ρ preparatory pulse cluster used for the studies. Sequence was implemented on a Varian MRI scanner and is able to obtain 16 slices in under 20 minutes of imaging time.
Reproducibility measurements
Four-month old animals (N=3) were scanned repeatedly during three separate MRI sessions over the course of two days. T1ρ maps were calculated and values were averaged from four compartments (medial/lateral femoral/tibial) of cartilage. Coefficients of variation (standard deviation/mean, CV) were calculated to determine inter- and intra-animal reproducibility.
MRI protocol
MRI was performed on a 9.4 Tesla horizontal 20cm bore animal scanner (Varian Inc., Palo Alto, CA). B0 calibration was performed first through scanner default calibration then through localized voxel shimming. A spectral line-width less than 50 Hz was maintained through the center of the joint space. B1 calibration was performed using a “flip-crush” procedure in which a single hard-pulse of arbitrary amplitude and fixed duration followed by gradient crushers with a generic gradient-echo imaging readout immediately following. A series of rapid image acquisition was performed while titrating the hard-pulse amplitude until a signal minimum (flip=90°) was achieved along a band within the center of the joint. These calibrations were used for all subsequent imaging.
3D b-GRE T1ρ MRI sequence was then used with the following parameters: FOV = 30 mm × 30 mm, slab thickness = 8 mm, acquisition matrix = 512 × 256 × 16 – interpolated to 512 × 512 × 16, resolution = 59 μm × 59 μm × 500 μm, α = 20°, centric encoding, TE = 5ms, TR = 9ms. A four-shot segmented acquisition was used to mitigate loss of T1ρ-contrast while residual signal approached the steady state. A delay of 3.5 seconds was appended to the end of each segment to allow full recovery of the longitudinal magnetization between T1ρ-preparatory segments. The spin-lock amplitude was fixed at 1500Hz for all T1ρ-weighted acquisitions and the spin-lock durations were varied (TSL = 1, 10, 20, 30, 40 ms) for subsequent T1ρ mapping.
Raw k-space data were filtered to reduce blurring due to transient signal decay as described previously (18). Total imaging time was ~20 minutes per TSL using four signal averages. High-resolution T1-weighted images were acquired using the b-GRE sequences to allow for cartilage segmentation. Human T1ρ MRI studies routinely utilize a heavily T1-weighted or MPRAGE image set to easily distinguish bone and meniscus from cartilage within the joint. The T1-weighted imaging parameters were T1ρ parameters excluding the T1ρ-preparation pulse. The acquisition was a linear and non-segmented with signal averages increased to 8.
T1ρ mapping
Images were transferred via FTP and processed on a Dell Dimension computer (Dell Inc, Round Rock, TX). All T1ρ-weigted images for each animal were automatically co-registered to the shortest TSL image data set using a 2D rigid body co-registration algorithm written in C for MATLAB (The Math Works, Natick MA). After co-registration was complete, the acquired T1ρ-weighted images were fit to the linearized mono-exponentially decaying T1ρ function using linear least square algorithm and a correlation coefficient (R2) of the fit was calculated. The T1ρ relaxation maps contain only those fit with R2 > 0.90.
The stifle joint cartilage was manually segmented by a single user (M.F.) from the T1-weighted images by using SliceOMatic software (Tomovision, Quebec, CA). Mid-coronal slices of the stifle were used to segment cartilage into four compartments i.e. medial/lateral tibial/femoral. Segmented masks were then used to automatically record mean T1ρ values in each compartment to an Excel spreadsheet (Microsoft, Inc., Redmond, WA). Of the 16 T1ρ-weighted slices acquired for each animal, T1ρ values were obtained from the center load-bearing portion of the stifle which utilized 4–6 slices. For the purpose of this study, compartment values for each slice were averaged to determine an individual global compartment T1ρ value.
T1ρ Dispersion Mapping
One 3-month old animal was scanned to determine T1ρ dispersion i.e. T1ρ values in cartilage as a function of spin-lock frequency (γB1/2π). Four separate T1ρ maps were generated with varying (500, 1000, 1500, 2000Hz) spin-lock amplitudes. T1ρ imaging parameters and processing techniques were as described above. T2 maps were acquired with single mid-coronal slice TSE/FSE pulse sequence with the following imaging parameters: TR = 3.5 s, TE = 10, 20, 40, 80 ms, Train Length = 8, FOV = 30 mm × 30 mm, Slice Thickness = 1 mm, Acquisition Matrix = 256 × 256. T2 was calculated and recorded in a similar manner to T1ρ as explained above and used for the data point at a spin-lock frequency of 0Hz.
Histochemical Analysis
Cartilage tissue was examined histologically to visualize and quantify PG content. Immediately after imaging, each animal was euthanized by a certified veterinary technician via intra-cardiac injection of highly concentrated medical-grade KCl solution as approved by the IACUC. The animals were stored frozen (−20° C) and collectively processed. The imaged hind limb (left) was dissected clean of soft tissue and the joint exposed. Each joint was fixed in 10% buffered formalin (Fisher) for 15 days followed by decalcification using Formical-2000 (Decal Chemical, Tallman, NY) until chemical testing for calcium was negative. The bones were then processed for routine paraffin embedding and histology with coronal sections 8μm thick. Sections were de-paraffinized and stained with Safranin-O by routine procedures (19). A quantitative analysis was performed of calculating staining intensity using ImageJ (NIH, Bethesda MD). Single mid-coronal weight-bearing sections for each animal were determined as a representative slice for the entire joint. Four ROIs, defined above, were utilized for each animal and the relative staining intensity of a single color channel was determined.
Cartilage Thickness
Histological sections were used to measure cartilage thickness as they are the most precise with highest pixel resolution. Each compartment for each animal was measured at its thickest point normal to the load-bearing portion of the joint. For the femur, this was in the center of each condyle and for the tibia, it was in the center of each side of the plateau. A single line extending from the superficial surface to the calcified-noncalficied cartilage tidemark was drawn.
Cartilage thickness was additionally measured with a signal mid-coronal load-bearing T1-weighted image. To minimize errors between measurements, a single thickness measurement was calculated in the center of the lateral tibial plateau.
RESULTS
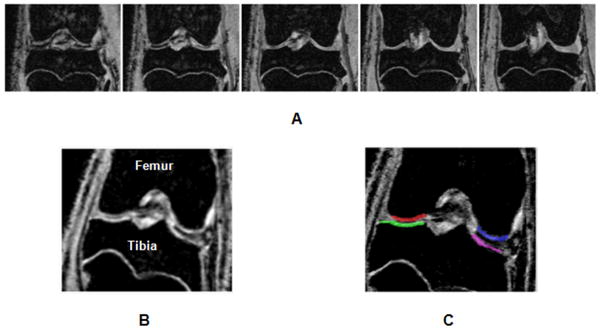
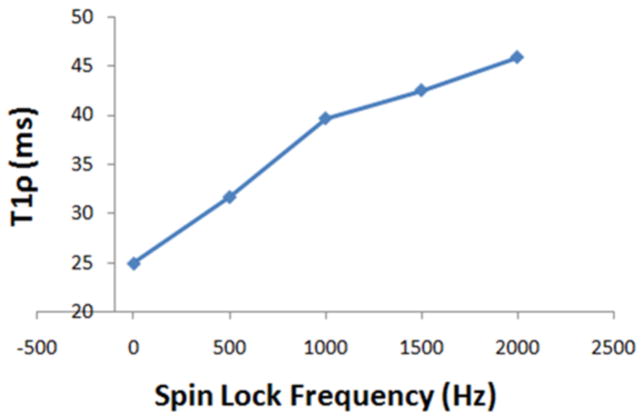
The entire protocol was able to acquire 3D data sets for T1ρ mapping in less than two hours. Optimization of the MRI pulse sequences and protocol resulted in high resolution high contrast images in very thin cartilage (~200μm) of guinea pigs (Figure 2A). Typical T1-weighted images show remarkably high contrast between cartilage and surrounding tissue in the stifle joint (Figure 2B), facilitating cartilage segmentation (Figure 2C) for automated reporting of T1ρ values from the parametric maps that were calculated from images with varying T1ρ-weighting (Figure 3). The reproducibility of T1ρ measurements is summarized in Table 1. Maximum CV was <10% indicating a high precision in mapping and quantifying T1ρ in guinea pig cartilage in vivo using this protocol. T1ρ dispersion in guinea pig cartilage (Figure 4) was observed for the first time. An average T2 of 3-month old cohort’s cartilage was calculated (11.75 ms) and used as the value for spin-lock frequency of 0 Hz. T1ρ increased by 45% between 500Hz and 1500Hz (31.7ms to 42.5 ms).
Figure 2.
The T1ρ MRI protocol implemented for this study provides images of the entire load-bearing portion of the stifle joint. Representative data of five slices from a data set of 16 slices as shown (A). The high contrast between cartilage and bone (B) facilitates easy segmentation of cartilage into four regions i.e. medial/lateral and femoral/tibia regions of interest (indicated by the color overlays in C).
Figure 3.
Example of T1ρ contrast in the mid-coronal slice of the stifle joint is shown as color coded images (scale on the right). The apparent signal decay is a function of spin-lock pulse duration (TSL) equal to 1, 10, 20, 30, 40 ms from left to right, respectively.
Table 1.
Inter- and intra-animal Coefficients of Variation (CV) were determined from test-retest experiments for the T1ρ MRI protocol.
| Reproducibility | |||
|---|---|---|---|
| Animal 1 | Animal 2 | Animal 3 | |
| Mean Animal CV | 6.51% | 3.90% | 9.29% |
| Mean Total CV | 6.57% | ||
Figure 4.
T1ρ dispersion was observed in guinea pig cartilage demonstrating greater values for T1ρ even at 500Hz spin-locking frequency (γB1/2π) compared to T2 (~spin-locking at 0Hz frequency). This implies greater sensitivity of T1ρ compared to T2 in detecting macromolecular changes in tissues such as cartilage.
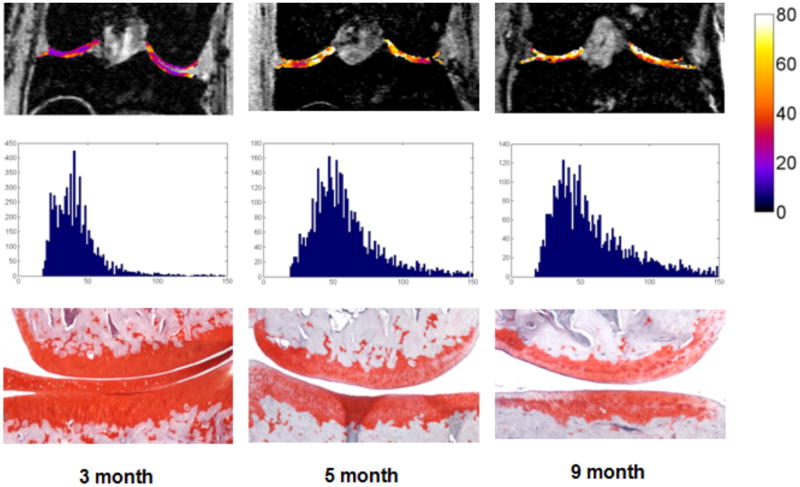
Representative T1ρ maps from each cohort, combined T1ρ distribution histograms for all animals, and representative histological sections from each age cohort are shown (Figure 5). T1ρ maps are shown superimposed on their corresponding T1-weighted image (Figure 5, 1st row). Quantitative analysis show increased T1ρ values and qualitative analysis demonstrates increased visual heterogeneity in older cohorts compared to the 3-month animal. T1ρ distribution histograms (Figure 5, 2nd row) show a strong but non-significant positive skew in increasing age. Histological assessments confirm progression of spontaneous OA with age (Figure 5, 3nd row) as seen by decreased stain intensity and cartilage thinning.
Figure 5.
Representative T1ρ maps in color (top row) are overlaid on T1ρ images from representative 3, 5, and 9 month old animals. Color bar on the right represents T1ρ value in milliseconds. Histograms of T1ρ values from these images and Safranin-O stained histology sections are shown below each image (middle and bottom rows, respectively). Both 5- and 9-month old animals displayed higher T1ρ values than the 3 month old, and age-related loss of PG loss was confirmed with subsequent histology images stained for PG content.
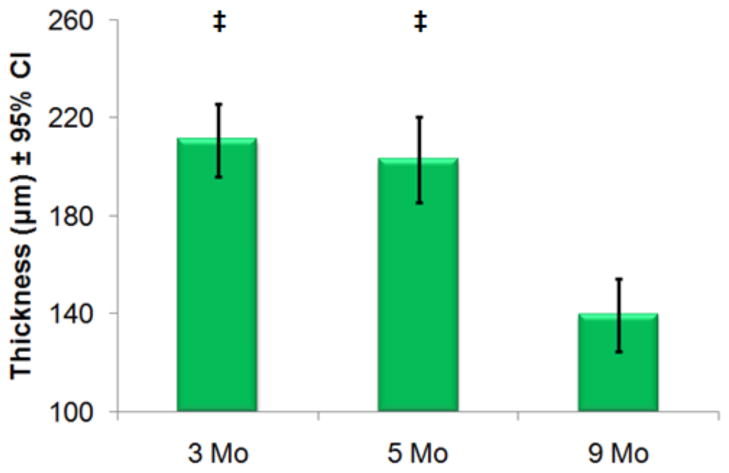
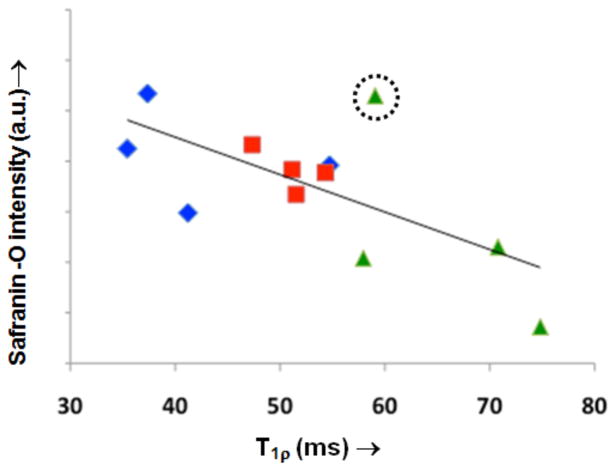
Cartilage thickness measurements were measured from a single mid-coronal histological section for each animal and mean values are shown (Figure 6, Figure 7). The average thickness of cartilage was insignificantly different between the 3- and 5-month old cohorts. There are significant differences in thickness between the 3- and 5-month old cohorts as compared to the 9-month cohort indicating that gross anatomic changes to thickness occur later than elevated T1ρ or PG loss. Cartilage thickness was also calculated from high-resolution MR images for each joint. We observe similar differences in thickness between the 3- and 5- month old cohorts with the more degenerated 9- month old cohort (Figure 8). Normalized Safranin-O stain intensity versus T1ρ value was plotted for all animals (Figure). Each animal’s stain intensity and T1ρ values were averaged for all compartments to generate a single value for each metric. The plot depicts an inverse relationship with decreasing PG implying higher T1ρ.
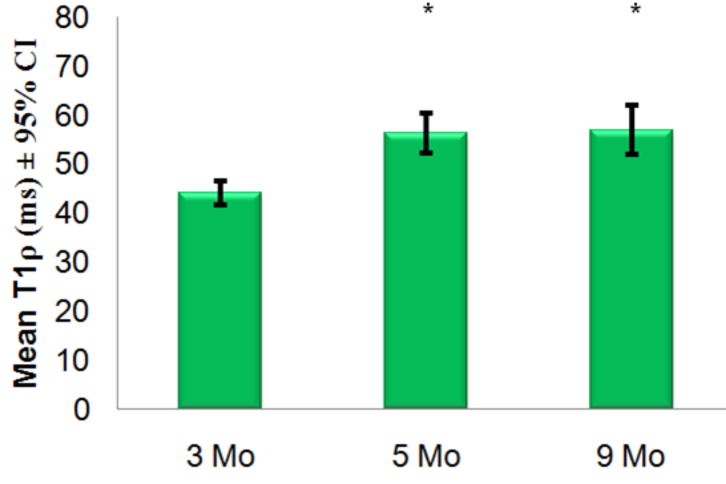
Figure 6.
Mean T1ρ values in each age cohort and 95% confidence intervals are plotted. Mean T1ρ was significantly different (*=p<0.01) between 3-month and both 5- and 9-month cohorts but not between 5- and 9-month cohorts.
Figure 7.
Mean cartilage thickness measurements are plotted with 95% confidence intervals (CI). Values are recorded using high-resolution histology. There are significant differences (‡=p<0.01) between both the 3- and 5-month old animals compared to the 9-month cohorts but not between 3- and 5-month old cohorts.
Figure 8.
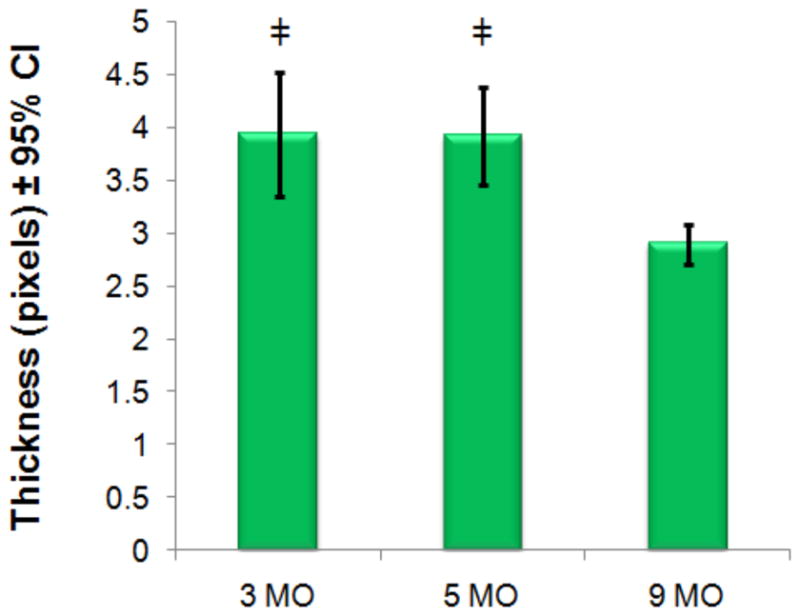
Mean cartilage thickness measurements are plotted with 95% confidence intervals (CI). Values are recorded using T1-weighted MRI. There are significant differences (‡=p<0.01) between both the 3- and 5-month old animals compared to the 9-month cohorts but not between 3- and 5-month old cohorts.
DISCUSSION
This study demonstrates the feasibility of in vivo quantification of cartilage degeneration in the guinea pig model by using T1ρ MRI. The resulting MRI protocol was well tolerated by the animals and the reproducible measurements suggest that this protocol may be suitable for studies tracking progression of cartilage degeneration longitudinally as well as to monitor the effects of therapeutic intervention non-destructively and potentially with fewer animals.
While histological measurements are regarded as the gold standard in quantifying OA severity, it requires post-mortem examination and cannot be used to monitor the progression of OA in vivo. Accurate quantification of proteoglycan levels requires staining be carried out simultaneously on all tissues to ensure relative staining intensities are preserved.
Both inter- and intra- animal COVs were noticeably small indicating a high precision of the T1ρ measurement protocol for use in this model of OA. Future studies will need to examine the reproducibility of this protocol on symptomatic cohorts to ensure changes in biochemical composition and thickness to not significantly alter recorded T1ρ measurements.
The T1ρ dispersion observed in the guinea pig cartilage is due to the mitigation of relaxation effects such as B0 inhomogenieties, residual dipolar interaction, magic angle effects, and processes such as chemical exchange (13). For this reason, T1ρ relaxation time is always greater than T2 and possesses a higher dynamic range. This leads to increased sensitivity of T1ρ to changes in cartilage macromolecules compared to T2 (17,20). Due to difficulties in accurate B0 shimming on this magnet, inherent low T2 values of cartilage, and difficulties with adequate SNR, T1ρ MRI was preferred. T1ρ MRI is capable of additional B0 corrections, larger dynamic range of T1ρ values, and increased SNR due to decreased relaxation effects.
T1ρ dispersion may provide to be a quantifiable metric that can be utilized to diagnose osteoarthritis severity. However, for the purpose of this work, T1ρ dispersion calculations were utilized to empirically determine a practical spin-lock amplitude. Utilizing a high-amplitude spin-lock, T1ρ MRI was able to mitigate the dominate dipolar interactions which are significant at high fields. Future studies addressing dispersion characteristics in this model may provide an additional tool for the diagnosis and quantification of this disease.
It should be noted that previously reported T1ρ values in clinical studies typically did not exceed a spin-lock frequency of 500 Hz. This is due to SAR limitations in order to keep RF energy deposition at a minimum and due to hardware limitations. In this study, we were able to utilize 1500 Hz frequency without causing any distress to the animals as determined by the careful monitoring of its vital signs and visual inspection of the joint pre- and post- imaging. MRI relaxation interactions such as susceptibility and residual dipolar interaction can be mitigated by using the higher spin-lock frequency. At high field strength MRI scanners such as the 9.4T used in this study, intrinsic cartilage T2 is expected to be ~10 ms and is significantly shorter than the corresponding values on 1.5T and 3T clinical scanners. The short T2, due to a predominant residual dipolar interaction associated with the collagen component of cartilage, precludes the reliable detection of any early molecular changes due to poor signal characteristics.
Given the size of the guinea pig joint and specialized hardware available, it is feasible to use high spin lock frequencies that will significantly improve the dynamic range of T1ρ enabling the detection of very early molecular changes that occur during the OA process. Imaging with a 500 Hz spin-lock frequency at 9.4T will provide T1ρ values less than those calculated at 1500 Hz. With incomplete mitigation of high-field relaxation effects, the T1ρ signal will be less sensitive to changes in biochemical composition.
Significant T1ρ changes were observed between 3-month and 5-month old cohorts while the cartilage thickness remained unchanged potentially providing evidence that T1ρ may be more sensitive to the early macromolecular changes that occur with cartilage degeneration as compared to morphological changes in this animal model of OA. Thickness measurements from MR images show similar trends to those calculated from histology. Discrepancies between measurements are from resolution differences between two imaging methods (59 μm vs. 1.2 μm in-plane resolution). Partial voluming effects and non-consistent tissue thickness pose a significant limitation to accurately determine cartilage thickness in vivo. However, with these limitations, similar trends between histology and MR show significant thickness differences during late stage disease manifestation.
There are limitations when using a single histological section in determining cartilage thickness. Inherent variations in thickness among the surface will cause variations between measurements. However, while discrepancies may arise, larger differences are believed to be due to substantial losses in cartilage thickness. Further detailed analysis of cartilage thickness measurements will need to be addressed. These thickness measurements suggest that significant molecular changes occur within two months in this model from the baseline and these changes to the biochemical composition of joint cartilage can be quantified using T1ρ MRI.
Heterogeneous distribution of T1ρ values can be seen within the older cohorts suggests evidence of non-uniform cartilage degenerations. Visual inspection of histology sections show similar non-uniform staining throughout the joint surface and the layers of the cartilage. Regions of elevated mean T1ρ possibly include focal cartilage defects and non-uniform cartilage thinning. As with other clinical studies analyzing T1ρ in cartilage, regions of focal defects may be masked by compartmental averaging. One of the limitations of the study is the different thickness of MRI and histology slices (500μm vs. 8μm, respectively) used to analyze the data. Despite this limitation, correlation between T1ρ and histological stain intensities is rather reasonable. Additional correlations of T1ρ and immunohistochemistry will need to be assessed to further validate the biochemical changes to the articular cartilage of the joint.
Despite the inherent challenges associated with maintaining consistent staining throughout all sections and with smaller section slice thickness compared to MRI, a progressive reduction of stain intensity implying loss of PG is related to an increase in T1ρ as a function of age.
The endogenous nature of the T1ρ contrast provides a suitable quantitative biomarker for in vivo imaging of cartilage degeneration in the guinea pig model. Given the rapid degeneration of cartilage with age in the guinea pig model, this study demonstrates the feasibility and practicality for T1ρ MRI in monitoring the progression of spontaneous cartilage degeneration within this guinea pig model. This noninvasive MRI approach with the sensitivity presented in this study provides may provide a useful platform for quantifying longitudinal changes in cartilage in vivo and may provide a practical model to assess the therapeutic benefit of new disease modifying therapies relevant to human OA as well provides insights into the early molecular changes that occur during the disease.
In conclusion, our study supports T1ρ as a relevant biomarker to detect changes in cartilage degeneration and track OA progression in animal models and could serve as a reliable surrogate to invasive methodology. While there is a reasonable correlation between T1ρ and the proteoglycan loss as measured from histological images, it is anticipated that additional analysis with more animals in expanded cohorts will improve the correlation. This platform is highly translatable to the pre-clinical environment and may be useful to both detect OA disease early and track the efficacy of potential disease modifying therapies.
Figure 9.
Mean signal intensities from Safranin-O stained histology sections of each animal vs. their average T1ρ. Where
 =3-month,
 =5-month, and
 =9-month data. A moderate correlation (R2=0.44, p<0.01) exists but is improved (R2=0.67, p<0.01) if the outlier with abnormal and statistically significantly (z=−2.2) high stain intensity (indicated by dotted circle) is removed before analysis.
Acknowledgments
Authors acknowledge technical support from the Small Animal Imaging Facility (SAIF) at the University of Pennsylvania’s School of Medicine, in particular, the efforts of Dr. Steve Pickup.
This work was performed at the Center for Magnetic Resonance and Optical Imaging of NCRR (P41RR02305) and supported by the following NIH grants from NIAMS: R01AR051041, R01AR045404.
Footnotes
CONFLICT OF INTEREST
The authors have no conflict of interest regarding the subject matter discussed.
References
- 1.Felson D, Zhang Y, Hannan M, et al. The incidence and natural history of knee osteoarthritis in the elderly. The Framingham Osteoarthritis Study. Arthritis Rheum. 1995;38(10):1500–1505. doi: 10.1002/art.1780381017. [DOI] [PubMed] [Google Scholar]
- 2.Seibel MJ, Robins SP, Bilezikian JP. Dynamics of bone and cartilage metabolism. xx. San Diego: Academic Press; 1999. p. 672. [Google Scholar]
- 3.Moskowitz RW. Osteoarthritis : diagnosis and medical/surgical management. xx. Philadelphia: Saunders; 2001. p. 674. 676 p. of plates p. [Google Scholar]
- 4.Pritzker K. Animal models for osteoarthritis: processes, problems and prospects. Ann Rheum Dis. 1994;53(6):406–420. doi: 10.1136/ard.53.6.406. [DOI] [PMC free article] [PubMed] [Google Scholar]
- 5.McDougall J, Andruski B, Schuelert N, Hallgrímsson B, Matyas J. Unravelling the relationship between age, nociception and joint destruction in naturally occurring osteoarthritis of Dunkin Hartley guinea pigs. Pain. 2009;141(3):222–232. doi: 10.1016/j.pain.2008.10.013. [DOI] [PubMed] [Google Scholar]
- 6.Tessier J, Bowyer J, Brownrigg N, et al. Characterisation of the guinea pig model of osteoarthritis by in vivo three-dimensional magnetic resonance imaging. Osteoarthritis Cartilage. 2003;11(12):845–853. doi: 10.1016/s1063-4584(03)00162-6. [DOI] [PubMed] [Google Scholar]
- 7.Watson P, Carpenter T, Hall L, Tyler J. MR protocols for imaging the guinea pig knee. Magn Reson Imaging. 1997;15(8):957–970. doi: 10.1016/s0730-725x(97)00113-6. [DOI] [PubMed] [Google Scholar]
- 8.Grushko G, Schneiderman R, Maroudas A. Some biochemical and biophysical parameters for the study of the pathogenesis of osteoarthritis: a comparison between the processes of ageing and degeneration in human hip cartilage. Connect Tissue Res. 1989;19(2–4):149–176. doi: 10.3109/03008208909043895. [DOI] [PubMed] [Google Scholar]
- 9.Lohmander L. Articular cartilage and osteoarthrosis. The role of molecular markers to monitor breakdown, repair and disease. J Anat. 1994;184 (Pt 3):477–492. [PMC free article] [PubMed] [Google Scholar]
- 10.Goldring M. The role of the chondrocyte in osteoarthritis. Arthritis Rheum. 2000;43(9):1916–1926. doi: 10.1002/1529-0131(200009)43:9<1916::AID-ANR2>3.0.CO;2-I. [DOI] [PubMed] [Google Scholar]
- 11.Wheaton A, Borthakur A, Shapiro E, et al. Proteoglycan loss in human knee cartilage: quantitation with sodium MR imaging--feasibility study. Radiology. 2004;231(3):900–905. doi: 10.1148/radiol.2313030521. [DOI] [PubMed] [Google Scholar]
- 12.Shapiro E, Borthakur A, Dandora R, Kriss A, Leigh J, Reddy R. Sodium visibility and quantitation in intact bovine articular cartilage using high field (23)Na MRI and MRS. J Magn Reson. 2000;142(1):24–31. doi: 10.1006/jmre.1999.1932. [DOI] [PubMed] [Google Scholar]
- 13.Borthakur A, Mellon E, Niyogi S, Witschey W, Kneeland J, Reddy R. Sodium and T1rho MRI for molecular and diagnostic imaging of articular cartilage. NMR Biomed. 2006;19(7):781–821. doi: 10.1002/nbm.1102. [DOI] [PMC free article] [PubMed] [Google Scholar]
- 14.Palmer Ar, Kroenke C, Loria J. Nuclear magnetic resonance methods for quantifying microsecond-to-millisecond motions in biological macromolecules. Methods Enzymol. 2001;339:204–238. doi: 10.1016/s0076-6879(01)39315-1. [DOI] [PubMed] [Google Scholar]
- 15.Santyr G, Henkelman R, Bronskill M. Spin locking for magnetic resonance imaging with application to human breast. Magn Reson Med. 1989;12(1):25–37. doi: 10.1002/mrm.1910120104. [DOI] [PubMed] [Google Scholar]
- 16.Wheaton A, Dodge G, Borthakur A, Kneeland J, Schumacher H, Reddy R. Detection of changes in articular cartilage proteoglycan by T(1rho) magnetic resonance imaging. J Orthop Res. 2005;23(1):102–108. doi: 10.1016/j.orthres.2004.06.015. [DOI] [PMC free article] [PubMed] [Google Scholar]
- 17.Witschey W, Borthakur A, Fenty M, et al. T1rho MRI quantification of arthroscopically confirmed cartilage degeneration. Magn Reson Med. 2010;63(5):1376–1382. doi: 10.1002/mrm.22272. [DOI] [PMC free article] [PubMed] [Google Scholar]
- 18.Witschey W, Borthakur A, Elliott M, et al. T1rho-prepared balanced gradient echo for rapid 3D T1rho MRI. J Magn Reson Imaging. 2008;28(3):744–754. doi: 10.1002/jmri.21444. [DOI] [PMC free article] [PubMed] [Google Scholar]
- 19.Schmitz N, Laverty S, Kraus V, Aigner T. Basic methods in histopathology of joint tissues. Osteoarthritis Cartilage. 2010;18 (Suppl 3):S113–116. doi: 10.1016/j.joca.2010.05.026. [DOI] [PubMed] [Google Scholar]
- 20.Li X, Han ET, Ma CB, Link TM, Newitt DC, Majumdar S. In vivo 3T spiral imaging based multi-slice T(1rho) mapping of knee cartilage in osteoarthritis. Magn Reson Med. 2005;54(4):929–936. doi: 10.1002/mrm.20609. [DOI] [PubMed] [Google Scholar]


