

Abstract
A central topic in sensorimotor neuroscience is the static‐dynamic dichotomy that exists throughout the nervous system. Previous work examining motor unit synchronization reports that the activation strategy and timing of motor units differ for static and dynamic tasks. However, it remains unclear whether segregated or overlapping blood‐oxygen‐level‐dependent (BOLD) activity exists in the brain for static and dynamic motor control. This study compared the neural circuits associated with the production of static force to those associated with the production of dynamic force pulses. To that end, healthy young adults (n = 17) completed static and dynamic precision grip force tasks during functional magnetic resonance imaging (fMRI). Both tasks activated core regions within the visuomotor network, including primary and sensory motor cortices, premotor cortices, multiple visual areas, putamen, and cerebellum. Static force was associated with unique activity in a right‐lateralized cortical network including inferior parietal lobe, ventral premotor cortex, and dorsolateral prefrontal cortex. In contrast, dynamic force was associated with unique activity in left‐lateralized and midline cortical regions, including supplementary motor area, superior parietal lobe, fusiform gyrus, and visual area V3. These findings provide the first neuroimaging evidence supporting a lateralized pattern of brain activity for the production of static and dynamic precision grip force. Hum Brain Mapp, 2013. © 2011 Wiley Periodicals, Inc.
Keywords: grasping, precision grip force, functional magnetic resonance imaging (fMRI), motor control
INTRODUCTION
Segregated and Overlapping Neural Circuits Exist for the Production of Static and Dynamic Precision Grip Force
A central topic of investigation in sensorimotor neuroscience has been the static‐dynamic dichotomy that exists throughout the nervous system. For example, the somatosensory system is characterized by slowly and rapidly adapting sensory receptors [Mouncastle et al.,1966] and the motor system is characterized by static and dynamic gamma motor neurons [Prochazka et al.,1988] and slow and fast motor units [Burke et al.,1973]. Whether segregated or overlapping neural circuits exist in the brain for static and dynamic motor control remains unclear. Work comparing motor unit synchronization during static finger position and dynamic finger movement suggests that segregated circuits may exist. In particular, Semmler et al. [2002] report that the activation strategy, as well as the timing of inputs to motor neurons, differs for static position relative to dynamic movement [for a review, see Duchateau and Enoka,2008]. The goal of the present study was to compare the blood‐oxygen‐level‐dependent (BOLD) activity associated with the production of static force to the BOLD activity associated with the production of dynamic force pulses. To that end, healthy young adults completed static and dynamic precision grip force tasks during functional magnetic resonance imaging (fMRI). We use the term static force to refer to tasks that require the same level of output from the motor system and the term dynamic force to refer to tasks that require changing force patterns over time [Ashe,1997; Georgopoulos et al.,1992; Kalaska,2009].
To our knowledge, only two previous investigations report direct comparisons of the BOLD activity in the brain during the production of static and dynamic force. Thickbroom and colleagues [1999] examined BOLD activity in 10 cortical slices at 1.5 Tesla while participants produced force by squeezing a bulb with their right hand. Thickbroom et al. report a significant BOLD signal in left sensorimotor cortex in three of six participants during the static task, whereas all participants showed a significant BOLD signal during the dynamic task. In a more recent investigation, Keisker and colleagues [2010] conducted a study at 3.0 Tesla while participants squeezed a handgrip dynamometer with their right hand during static and dynamic force production. Keisker et al. report that BOLD activity was greater in intensity and more widespread in the dynamic task relative to the static task in contralateral motor cortex and ipsilateral anterior cerebellum. The investigators examined the BOLD activity in each task versus rest and then summed the activity from the two tasks. The contrast of the activation in the two tasks summed together produced 12 ROIs in which they focused the comparison of static versus dynamic force. Peak beta values were obtained within each ROI, and the analysis focused on a 125 μl cube around the peak beta value for each ROI. Since the analysis first summed the task minus rest contrasts, and then focused on a small cube around the peak beta value, this approach could have missed additional areas that were differentially activated by static and dynamic tasks. A direct comparison of BOLD activity in the static and dynamic tasks using a voxel‐based approach would address this issue. This is theoretically important because prior work from Sainburg and colleagues predicts that lateralized circuits may exist for static and dynamic motor control [for a review see Sainburg,2005].
The dynamic dominance model of Sainburg [2005] posits that each hemisphere‐limb system has become uniquely specialized for controlling different features of motor control. This model of motor lateralization is based on behavioral studies examining the intersegmental limb dynamics associated with rapid aiming movements. Sainburg and colleagues report that the right hemisphere is specialized for the control of static posture during the final phase of an aiming movement [Wang and Sainburg,2006,2007] and for regulating limb impedance to achieve stable postures [Duff and Sainburg,2007; Shabbott and Sainburg,2008]. In contrast, the left hemisphere is specialized for the control of dynamic aspects of movement, such as the coordination of muscle actions during multijoint movements and adaptation to novel inertial dynamics [Bagesteiro and Sainburg,2003,2005; Duff and Sainburg,2007]. Importantly, however, the dynamic dominance hypothesis has not been evaluated by functional neuroimaging during static and dynamic motor tasks.
The current study tests three hypotheses. First, we test the hypothesis that considerable overlap will exist for static and dynamic force production. Second, consistent with Keisker et al. [2010], we test the hypothesis that the dynamic task will be associated with increased BOLD activity relative to the static task in contralateral primary motor cortex and ipsilateral anterior cerebellum. Last, we test the hypothesis that the static force task will be associated with a right‐lateralized cortical network and dynamic force will be associated with a left‐lateralized cortical network.
METHODS
Participants
Seventeen volunteers (21–33 years of age; eight women) participated in this study. All participants were naïve to the hypothesis, neurologically healthy, and had self‐declared normal or corrected‐to‐normal vision. All participants were self‐declared right‐hand dominant and were subsequently tested for handedness with the Edinburgh Handedness Inventory [Oldfield,1971]. Scores from the inventory indicated that participants were right handed; with the exception that one participant who was ambidextrous. All work was conducted in accord with the ethical standards laid down in the 1964 Declaration of Helsinki and all Institutional Review Board approved procedures were carried out with the understanding and written consent of the participants.
Force Data Acquisition
Participants produced force against a custom‐designed fiber optic force transducer (Aither Engineering, Lanham, MD) that was housed in a precision grip apparatus held between the thumb and index finger of the right hand (Fig. 1A). The force transducer and its housing were constructed from rigid, nonmetallic materials that were safe for use in the magnetic resonance environment. The force transducer was factory calibrated by Aither Engineering and had a resolution of 0.025 Newtons.
Figure 1.
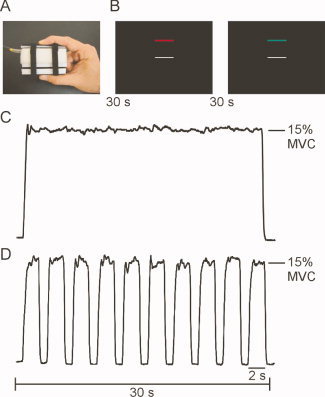
The precision grip apparatus, visual display, and exemplar force traces for the static and dynamic tasks. A: The precision grip apparatus. B: The visual display contained two horizontal bars presented against a high contrast black background. The target bar (red/green) was stationary across all trials, whereas the white force bar moved to provide the participant with real‐time visual feedback about their force. C: In the static task, participants produced constant force for 30 s. In each task, each 30 s force interval was followed by 30 s of rest. D: In the dynamic task, participants produced 10, 2 s force pulses separated by 1 s of rest.
Force data were digitized at 125 Hz using the si425 Fiber Optic Interrogator (Micron Optics, Atlanta, GA) and were then collected and converted to Newtons with customized software written in LabVIEW (National Instruments, Austin, TX). Force data were filtered online using a fourth‐order dual‐pass Butterworth filter with a low‐pass frequency of 20 Hz. Participants were provided with continuous (60 Hz) visual feedback about their force by the parallax biofeedback system [Vaillancourt et al.,2003]. Specifically, we used a coil‐mounted visor system that projected to a screen located 35 cm from the participant's eyes.
MRI Data Acquisition
Magnetic resonance images were collected using a quadrature volume head coil inside a 3‐Tesla MR Scanner (GE Healthcare 3T94 Excite 2.0, GE Healthcare, Waukesha, WI). Participants lay supine in the scanner while performing the task with their right hand. Head position was stabilized with adjustable padding on both sides of the head. Scanner noise was attenuated by a combination of earplugs and earphones. The functional images were obtained using a T2*‐weighted, single shot, gradient‐echo echo‐planar pulse sequence (echo‐time (TE) 25 ms; time to repeat (TR) 2,500 ms; flip angle 90°; field of view (FOV) 200 mm2; imaging matrix 64 × 64; 42 axial slices at 3 mm thickness; 0 mm gap between slices). Following the functional scans, anatomical images were obtained using a T1‐weighted fast spoiled gradient echo pulse sequence (TE 2.9 ms; TR 9.9 ms; flip angle 25°; FOV 240 mm2; imaging matrix 256 × 256; 120 axial slices at 1.5 mm thickness; 0 mm gap between slices).
Experimental Design
In advance of the MRI session, participants completed a training session outside the MR environment. This training session was designed to familiarize participants with the task and reduce motor learning effects when inside the scanner. Each participant's maximum voluntary contraction (MVC) was determined following three 5‐second trials, with approximately 60 seconds rest between trials. MVC was defined as the peak force amplitude achieved across the three trials. Participants completed two 4.5‐minute precision grip force tasks in the fMRI session. Each task used a blocked design paradigm consisting of alternating 30 second force and rest intervals. Both tasks began and ended with a 30‐second rest interval. As shown in Figure 1B, the visual display contained two horizontal bars presented against a black background: a fixed target bar and a moveable white force bar. The target bar represented 15% of the participant's MVC and thus remained in a fixed location. During all rest periods, the white force bar was stationary and the target bar was red. Participants were instructed to produce force when the target bar changed from red to green. Participants received online visual feedback about their force via the white, moveable horizontal bar.
In the static task, participants produced isometric force to 15% of their MVC for 30 seconds (Fig. 1C). In the dynamic task, participants produced force to 15% of their MVC for 2 seconds. Each 2‐second force pulse was separated by 1 second of rest, which was cued by a color change of the target bar (from green to red). In the dynamic task, a series of 10 force pulses plus rest were completed to achieve 30 seconds of precision grip force (Fig. 1D). In both tasks, each 30‐second force interval was followed by 30 seconds of rest. Each force and rest cycle was repeated four times.
Force Data Analysis
In order to confirm that participants produced equivalent force in the static and dynamic tasks, force data were analyzed with custom algorithms written in LabVIEW. In the static task, force amplitude was calculated from an 18.5‐second portion of the continuous force interval and was then averaged across blocks. In the dynamic task, for each force pulse, force amplitude was calculated from a 1‐second portion of the force interval once participants reached the target. Force amplitude was then averaged across the blocks (i.e., 40 force pulses). In both tasks, mean force was measured as a percentage of MVC. Mean force was calculated for each participant and for each task. Mean force (% of MVC) was then subjected to paired t‐tests to examine the effect of task. Results were interpreted at alpha = 0.05.
fMRI Analysis
Data processing and analysis was performed using the public domain software AFNI (Automated Functional NeuroImaging: http://afni.nimh.nih.gov/afni/). Motion detection and correction functions were applied to each functional time series using standard procedures in AFNI. Combined motion in the x, y, and z planes did not exceed 1.5 mm for any of the participants and thus all participants were included in the analysis.
Voxelwise Analysis
We performed a voxelwise analysis on the whole brain functional datasets. Motion‐corrected individual data sets were spatially smoothed with a 3D Gaussian filter with a full‐width half‐maximum of 4 mm. The smoothed data were normalized by dividing the signal in each voxel at each time point in the series by the mean signal in that voxel throughout the time series. Each functional data set was then regressed to the expected hemodynamic response function for the task sequence. The dependent variable at this level of the analysis was the estimated β‐coefficient of the regressed time series and its associated t‐statistic. Before group analysis, each participant's functional data set was transformed to Montreal Neurological Institute (MNI) space in AFNI.
The output data were analyzed using three paired t‐tests: (1) the estimated group mean β‐value for static force minus rest, (2) the estimated group mean β‐value for dynamic force minus rest, and (3) the estimated difference in group means for dynamic minus static. The negative t‐values revealed in this contrast represent voxels in which activity was greater in the static task relative to the dynamic task. Importantly, the static minus rest and dynamic minus rest t‐maps served as a mask within which the third contrast (i.e., dynamic minus static) was examined. Hence, only areas in which the BOLD signal was greater during force production than during rest were examined in the third contrast. All three data sets were corrected for multiple comparisons using a Monte Carlo simulation model in AFNI (i.e., AlphaSim). The data sets were thresholded to remove all voxels with t < 3.25 and an activation cluster <205 μl (p < 0.05, corrected). This criterion implies that all clusters must be greater than or equal to 7.0 voxels. Regions of activation were identified according to neuroanatomical coordinates reported in previous investigations [e.g., Culham et al.,2003; Grol et al.,2007; Grosbras et al.,1999; Mayka et al.,2006; Prado et al.,2005; Prodoehl et al.,2008] and in the MRI Atlas of the human cerebellum [Schmahmann et al., 2000].
RESULTS
Force Data
Mean force amplitude was not significantly different between the static and dynamic tasks (t(16) = −1.14, p = 0.271; see Fig. 2). As shown in Figure 2, mean force (as a percentage of MVC) is near the 15% MVC target for each participant for both the static and dynamic tasks. This demonstrates that participants were able to complete the task as directed.
Figure 2.
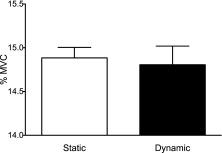
Mean force (as a percentage of MVC) in the static and dynamic tasks. Mean force was not different across tasks. Error bars represent one standard deviation.
Areas Common to Both Tasks
The results of the static minus rest and the dynamic minus rest contrasts demonstrated that the production of static and dynamic precision grip force elicited BOLD activity in a widely distributed visuomotor network. A conjunction map was created to reveal voxels that were more active during force production than during rest in both tasks. Clusters of activation within this conjunction map are listed in Table I. These areas of BOLD activity include, but were not limited to bilateral motor and pre‐motor areas, bilateral V3 and V5/MT, bilateral putamen, and bilateral cerebellum. This finding is consistent with work reporting a widely distributed cortical and subcortical network for the visuomotor control of power and precision grip force [Coombes et al.,2010; Dai et al.,2001; Ehrsson et al.,2000; Floyer‐Lea and Matthews,2004,2005; Kuhtz‐Buschbeck et al.,2008; Thickbroom et al.,1998; Vaillancourt et al.,2003, 2006].
Table I.
The center of mass coordinates are reported for each region identified as active in both the static and dynamic tasks by the conjunction of the contrasts static minus rest and dynamic minus rest at t(16) = 3.25, p < 0.05, corrected
| Region | MNI Coordinates | ||
|---|---|---|---|
| x | y | z | |
| L PMv | −55.1 | −0.7 | 32.3 |
| R PMv | 53.8 | 2.7 | 23.8 |
| L PMd | −38.8 | 12.9 | 51.3 |
| R PMd | 37.7 | 12.3 | 50.7 |
| L pSMA | −6.7 | 1.1 | 53.4 |
| R pSMA | 10.1 | 0.2 | 53.3 |
| L SMA | −6.8 | 17.8 | 57.1 |
| R SMA | 9.3 | 11.9 | 57.9 |
| L M1 | −37.0 | −13.6 | 59.1 |
| R M1 | 40.0 | 20.8 | 52.6 |
| L S1 | −49.2 | 31.5 | 45.8 |
| R S1 | 60.5 | 27.1 | 31.4 |
| L V5/MT | −48.8 | −69.6 | −3.2 |
| R V5/MT | 49.4 | 67.8 | −13.9 |
| L V3 | −33.0 | 93.4 | −21.8 |
| R V3 | 33.0 | −91.4 | 12.4 |
| L IFG | −58.1 | 8.9 | 32.3 |
| R IFG | 58.4 | 12.9 | 23.7 |
| L Putamen | −24.7 | −5.1 | 4.9 |
| R Putamen | 26.4 | 5.4 | 2.5 |
| R Insula | 45.8 | 2.6 | 11.1 |
| R aIPS | 36.0 | −44.1 | 45.2 |
| R Precuneus | 31.7 | −69.4 | 31.5 |
| L Lobule VIIIA | −29.6 | 71.3 | −59.2 |
| R Lobule VI | 13.8 | −71.2 | −30.8 |
As the primary goal of this study was to compare BOLD activity between tasks, the remainder of the Results is focused on brain regions that showed a different pattern of BOLD activity between the tasks. The dynamic minus static contrast revealed three categories of activation. First, in areas that were unique to the static task, significant BOLD activity was present in voxels that were not active in the dynamic task. Second, in areas that were unique to the dynamic task, significant BOLD activity was present in voxels that were not active in the static task. Third, brain regions in which voxels were active in both tasks, yet there was greater BOLD activity within these regions for the dynamic task relative to the static task. It is important to note that the results did not reveal any brain regions in which voxels were active in both tasks, yet greater BOLD activity was present for the static task relative to the dynamic task.
Static Force Network
As shown in Table IIA, there were only three cortical areas unique to the static task: right inferior parietal lobule (IPL), right ventral premotor cortex (PMv), and right dorsolateral prefrontal cortex (DLPFC). Figure 3A shows the results for the static minus rest and the dynamic minus rest contrasts. These whole brain slices show regions in which BOLD activity was greater during force production than rest in a distributed visuomotor system. Note that these t‐maps served as a mask within which the third contrast (i.e., dynamic minus static) was examined. Figure 3B shows the results of the static minus dynamic contrast for the area encompassed by the white box in Figure 3A. Figure 3B demonstrates that direct comparison of the static and dynamic tasks yielded greater BOLD activation associated with the static task in right IPL. This is revealed by negative t‐values, which are represented by shades of blue. The activation in right IPL was located on the posterior border of SI, anterior to the supramarginal gyrus and superior to the lateral sulcus. In the last step of our analysis, we created a conjunction map to illustrate the spatial overlap associated with the static and dynamic tasks. Figure 3C shows the spatial overlap for the same voxels shown in Figure 3B, which correspond to the area encompassed by the white box in Figure 3A. Voxels are defined as unique to the static task (blue), unique to the dynamic task (red), or active in both tasks (yellow). Figure 3C clearly shows that the activity in right IPL was unique to the static task.
Table II.
The center of mass coordinates are reported for each region identified by the dynamic minus static contrast at t(16) = 3.25, p < 0.05, corrected
| Region | MNI Coordinates | ||
|---|---|---|---|
| x | y | z | |
| A. Static > Dynamic: Activity unique to the static task | |||
| R IPL | 64.3 | 21.3 | 32.2 |
| R PMv | 50.9 | 7.1 | 22.3 |
| R DLPFC | 41.5 | 52.1 | 9.2 |
| R DLPFC | 49.1 | 41.6 | 6.2 |
| B. Dynamic > Static: Activity unique to the dynamic task | |||
| SMA | −10.1 | 2.4 | 64.5 |
| L SPL | −30.5 | −56.0 | 62.6 |
| L Fusiform gyrus | −39.9 | −74.3 | −13.1 |
| L V3 | −30.7 | −94.4 | 4.2 |
| L Lobule VI | −33.3 | −58.3 | −25.1 |
| C. Dynamic > Static: Activity common to both tasks, but greater and more widespread in the dynamic task | |||
| L MI | −42.3 | −15.2 | 62.0 |
| L S1 | −47.1 | −22.5 | 55.7 |
| L PMd | −18.1 | −3.2 | 71.7 |
| SMA | −6.6 | −3.8 | 61.7 |
| L V5/MT | −48.1 | −82.3 | −0.5 |
| L LO | −42.1 | −70.3 | 2.3 |
| R Lobule VI | 23.5 | 57.7 | −20.4 |
| R Crus II | 18.9 | 76.8 | −43.7 |
Figure 3.
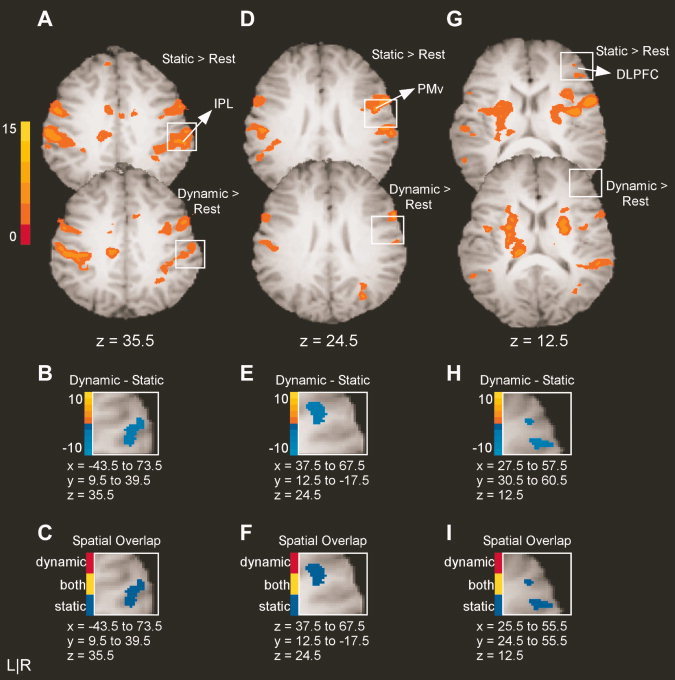
Results from the voxelwise analysis for areas with greater BOLD activity in the static task than in the dynamic task. A: The activation maps for the static minus rest and the dynamic minus rest contrasts for right IPL. The intensity bar ranges from t = 0 to t = 15 with a group activation threshold of p < 0.05, corrected. B: The voxelwise comparison of the static versus dynamic task (p < 0.05, corrected). The voxels shown in panel B correspond to the area encompassed by the white box in panel A. The intensity bar ranges from t = −10 to t = 10, where positive voxels have greater BOLD activation in the dynamic task than in the static task and negative voxels have greater BOLD activation in the static task relative to the dynamic task. C: The spatial overlap between static and dynamic tasks. Voxels identified with task differences in B are defined as unique to the static task (blue), unique to the pulse task (red), or active in both tasks (yellow). Note that the slices shown in A, B, and C are from the same axial slice for each region. D–F and G–I reflect the same analysis approach for PMv and DLPFC.
Figure 3D,G show the results for the static minus rest and the dynamic minus rest contrasts for right PMv and right DLPFC, respectively. Figure 3E,H demonstrate that direct comparison of the static and dynamic tasks yields greater activation during the static task for right PMv and right DLPFC, respectively. The cluster of activation in PMv was located in the right precentral gyrus and the two clusters of activity in DLPFC were centered in right middle and inferior frontal gyrus. Last, the spatial overlap illustrated in Figure 3F,I demonstrates that activity in PMv and DLPFC was unique to the static task.
Dynamic Force Network
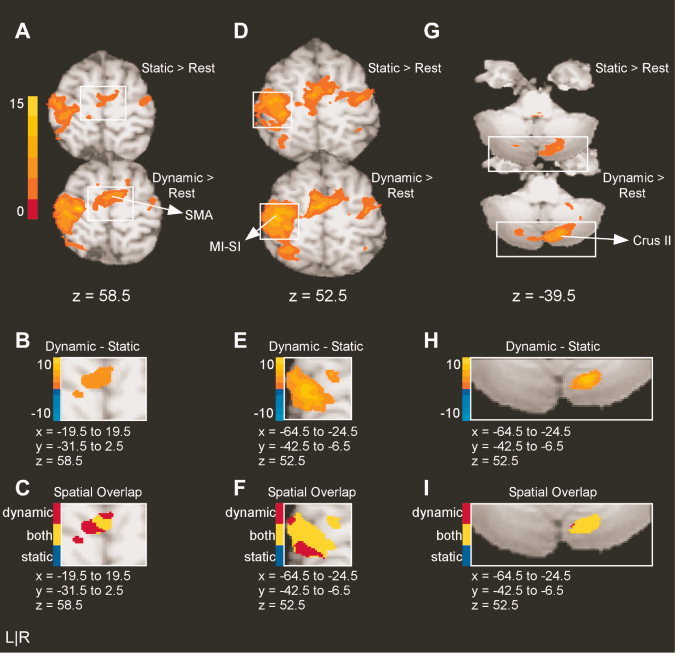
Table IIB and C report multiple regions that showed greater activation in the dynamic task relative to the static task. The regions unique to the dynamic force task included supplementary motor area (SMA), left superior parietal lobe (SPL), left fusiform gyrus, left V3, and left lobule VI of the cerebellum. Figure 4A,D show the results for the static minus rest and the dynamic minus rest contrasts for clusters centered in SMA and left SPL, respectively. Figure 4B,E demonstrate that direct comparison of the static and dynamic tasks yields greater BOLD activation associated with the dynamic task in both regions. This is shown by positive t‐values which are represented by shades of orange and yellow. Activity in SMA was centered to the right of midline, just anterior to the paracentral sulcus on the surface of the superior frontal gyrus. Figure 4E shows that the activity in left SPL is located anterior to the intraparietal sulcus. As noted by red voxels in Figure 4C,F activity in these clusters was unique to the dynamic task.
Figure 4.
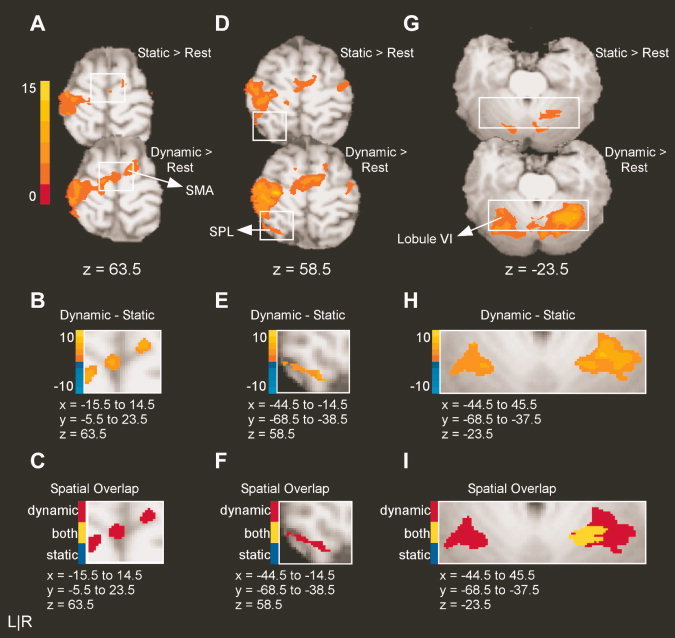
Results from the voxelwise analysis for areas with greater BOLD activity in the dynamic task than in the static task. A: The activation maps for the static minus rest and the dynamic minus rest contrasts for SMA. The intensity bar ranges from t = 0 to t = 15 with a group activation threshold of p < 0.05, corrected. B: The voxelwise comparison of the static versus dynamic task (p < 0.05, corrected). The voxels shown in panel B correspond to the area encompassed by the white box in panel A. The intensity bar ranges from t = −10 to t = 10, where positive voxels have greater BOLD activation in the dynamic task than in the static task and negative voxels have greater BOLD activation in the static task relative to the dynamic task. C: The spatial overlap between static and dynamic tasks. Voxels identified with task differences in B are defined as unique to the static task (blue), unique to the pulse task (red), or active in both tasks (yellow). Note that the slices shown in A, B, and C are from the same axial slice for each region. D–F and G–I reflect the same analysis approach for left SPL and left Lobule VI of the cerebellum.
Figure 4G shows the results for the static minus rest and the dynamic minus rest contrasts in the superior cerebellum. Figure 4H shows that when the static and dynamic tasks are compared directly, BOLD activation is greater in intensity and more widespread in the dynamic task than in the static task. In particular, one cluster in the left superior cerebellar hemisphere was unique to the dynamic task. The cluster was centered in lobule VI; however, the activation includes lobule IV, just lateral to the primary fissure, and extends across the superior posterior fissure to Crus I. This activity in left cerebellum is similar to a large cluster of activity observed in right lobules V, VI, and Crus I (see details below). Both right and left clusters of activity can be seen in Figure 4G–I. Figure 4I clearly demonstrates that several voxels in the right‐lateralized cluster are active in both tasks (yellow voxels), whereas the left‐lateralized cluster was unique to the dynamic task (red voxels).
As shown in Table IIB, two additional clusters of activity in extrastriate visual areas were unique to the dynamic task. The first was centered in left middle occipital gyrus in a region consistent with visual area V3. The second was centered in the lateral aspect of the left fusiform gyrus.
Table IIC lists the brain regions in which BOLD activity was greater in intensity and was more widespread in the dynamic task relative to the static task, but in which activity was present in both tasks versus rest. These regions included left M1‐S1, left dorsal premotor cortex (PMd), SMA, left V5/MT, left lateral occipital complex (LO), and right lobules V, VI, and Crus II of the cerebellum. Figure 5A,D,G depict the results for the static minus rest and dynamic minus rest contrasts. Figure 5B,E,H show the results of the static versus dynamic contrast. Each of these figures shows a similar pattern, wherein BOLD activity is greater in intensity and more widespread in the dynamic task relative to the static task. In particular, Figure 5B shows the cluster of activation in SMA, which is centered in the left hemisphere. This cluster is independent from the SMA activity noted above and shown in Figure 4B. Figure 5E shows the large band of activation beginning near the anterior bank of the central sulcus and extending to the postcentral sulcus, including MI and SI in the left hemisphere. Figure 5H shows the cluster of activity centered in, and confined to, right Crus II. The predominance of yellow voxels in Figure 5C,F,I illustrate the spatial overlap for clusters in SMA, left MI‐SI, and right Crus II and demonstrate that activity in these areas was largely common to both tasks.
Figure 5.
Results from the voxelwise analysis for areas common to both tasks. A: The activation maps for the static minus rest and the dynamic minus rest contrasts for SMA. The intensity bar ranges from t = 0 to t = 15 with a group activation threshold of p < 0.05, corrected. B: The voxelwise comparison of the static versus dynamic task (p < 0.05, corrected). The voxels shown in panel B correspond to the area encompassed by the white box in panel A. The intensity bar ranges from t = −10 to t = 10, where positive voxels have greater BOLD activation in the dynamic task than in the static task and negative voxels have greater BOLD activation in the static task relative to the dynamic task. C: The spatial overlap between static and dynamic tasks. Voxels identified with task differences in B are defined as unique to the static task (blue), unique to the pulse task (red), or active in both tasks (yellow). Note that the slices shown in A, B, and C are from the same axial slice for each region. D–F and G–I reflect the same analysis approach for left MI‐SI, and right Crus II of the cerebellum.
Three additional regions were common to both tasks. One cluster of activity was centered in right lobule VI. This activation began in lobule V and crossed the primary and superior posterior fissures to its lateral edge in Crus I. This cluster is visible in Figure 4G–I. In addition, two clusters of activation were observed within the extrastriate visual areas. One cluster of activity was centered in the left middle occipital gyrus, corresponding to the region of visual area V5/MT. We observed another area of activity centered in the left middle occipital gyrus, in a region consistent with the visual area lateral occipital complex [LO; Malach et al., 1995].
DISCUSSION
This study compared the neural circuits associated with the production of static force to those associated with the production of dynamic force in a precision grip task. Consistent with our first hypothesis, there were widespread similarities between static and dynamic force control. Second, our findings support those from Keisker and colleagues [2010] by showing greater activity in the contralateral motor cortex and ipsilateral anterior cerebellum in dynamic force control compared with static force control. Third, we found that the production of static force was associated with a unique right‐lateralized cortical network, whereas the production of dynamic force was associated with a unique midline and left‐lateralized cortical network. These findings provide novel evidence that segregated neural circuits exist for static and dynamic motor control. We first discuss our results for a common visuomotor network and then discuss specific brain regions associated with each task.
A Common Visuomotor Network
The results of the static minus rest and the dynamic minus rest contrasts revealed that the production of precision grip force is associated with BOLD activity in many areas within the visuomotor network, including primary and sensory motor cortices, premotor cortices, multiple visual areas, putamen, and the cerebellum. Further, the dynamic minus static contrast revealed eight brain regions with BOLD activity common to both tasks; however, within these regions BOLD activity was greater in intensity and was more widespread for the dynamic task. These areas included: left M1, left S1, left PMd, SMA, left V5/MT, left LO, right lobule VI, and right crus II. These findings are consistent with studies reporting a widely distributed cortical and subcortical network for the visuomotor control of reaching and grasping [Astafiev et al.,2003; Blangero et al., 2009; Burnod et al., 1999; Culham et al.,2003; Grafton et al.,1996; Prado et al.,2005; Simon et al., 2002; for a review, see Filimon,2010], and the visuomotor control of power and precision grip force production [Coombes et al.,2010; Dai et al.,2001; Ehrsson et al.,2000; Floyer‐Lea and Matthews,2004,2005; Kuhtz‐Buschbeck et al.,2008; Thickbroom et al.,1998; Vaillancourt et al.,2003, 2006].
Static Force Network
The results revealed three cortical areas in which BOLD activity was greater in the static task relative to the dynamic task: right IPL, right PMv, and right DLPFC. It is important to note that the static task required continuous force output over 30 s and therefore required more time on target relative to the dynamic task. This difference may have resulted in greater emphasis on continuous and feedback‐based control relative to the dynamic task. Therefore, the areas unique to the static task may be related to the use of an online control strategy. Indeed, previous neuroimaging, neurophysiology, and neurobehavioral investigations demonstrate that IPL, PMv, and the prefrontal cortex are involved in the online control of action [Desmurget and Grafton,2000; Filimon,2010; Grafton,2010]. In particular, IPL's connections with the dorsal and ventral visual streams [Rozzi et al.,2006], the visual areas of the superior temporal sulcus [Andersen et al.,1990; Rozzi et al.,2006; Seltzer and Pandya,1978], the spinal cord [He et al., 1993, 1995; Rozzi et al.,2006], and the ventral and dorsal premotor areas [Luppino et al.,1999; Petrides and Pandya,1984; Rozzi et al.,2006] make it well‐positioned to serve as a key site for the integration of visual and motor information. In a seminal study examining the role of IPL in visually guided movement, Desmurget and colleagues showed that transcranial magnetic stimulation over IPL disrupts movement corrections necessitated by visual target perturbations [Desmurget et al.,1999]. Importantly, this finding demonstrates that IPL is a critical structure for the online control of visually guided movement.
A related theoretical framework is that of attentional control. In particular, Shulman et al. [2010] report right‐hemisphere dominance for visual target detection. This finding is consistent with work reporting that areas such as right medial frontal gyrus, right inferior frontal gyrus, and right IPL are associated with sustained, endogenously maintained arousal that is required for the successful detection of visual targets [Pardo et al.,1991; Sturm et al.,1999]. Moreover, Woolley and colleagues [2010] demonstrate greater BOLD activation in the right relative to the left hemisphere when visuospatial information is used to control ongoing movements. These findings, in concert with the current work, suggest that the right hemisphere, and in particular the right IPL, is associated with the use of continuous visuospatial information for the online control of action.
An interesting question is whether the activity we report in right IPL is consistent with the putative human homologue of macaque area AIP, most well‐known for its role in visually guided movement [Taira et al., 1990]. Indeed, fMRI studies in humans report activity in the anterior portion of the intraparietal sulcus (aIPS), at the intersection with the postcentral sulcus, which is associated with visually guided grasping [Binkofski et al.,1998; Culham et al.,2003; Frey et al.,2005]. In particular, activity in aIPS is thought to be related to the specification of hand postures for object‐specific grasping as well as to the end goal of the action (e.g., eating versus moving an object from point to point) [Cavina‐Pratesi et al.,2010; Culham et al.,2003; Kroliczak et al.,2007; Marangon et al.,2011]. As shown in Table I, the present study reports that activity common to both the static and dynamic tasks was found in aIPS. In contrast, activity in right IPL that was unique to the static task was inferior to the area defined as aIPS [for coordinates see Frey et al.,2005 and Tunik et al.,2007]. Since both static and dynamic tasks included a similar hand grip posture, it follows that we identified aIPS during the analysis examining common activity for both condition. The novel finding is that the BOLD activity unique to the static task was outside aIPS.
In addition to IPL, it is well‐established that PMv is critical for grasping since reversible inactivation in monkeys [Fogassi et al.,2001] and in humans [Davare et al.,2006] results in impairments in hand shaping. Distinct populations of PMv neurons discharge in relation to specific hand postures during visual presentation of the to‐be‐grasped object and throughout the duration of the response [Fluet et al.,2010; Murata et al.,1997; Raos et al.,2006; Umilta et al.,2007]. This pattern of activity is consistent with the idea that PMv encodes grasp‐specific hand shaping information, which is then relayed to M1 [Dum and Strick,2005; Prabhu et al.,2009]. In particular, Davare and colleagues [2010] propose a model of functional connectivity wherein PMv provides a combination of facilitatory and inhibitory input to M1: M1 corticospinal neurons specific to the grasp are facilitated and all other M1 corticospinal neurons are inhibited. This balance between facilitation and inhibition gives rise to the muscle‐specific patterns of activation necessary for visually guided grasping [Buch et al.,2010]. The current findings extend this literature by showing that specific areas within the right PMv are unique to static grip force control.
Dynamic Force Network
The present study reports several regions in which BOLD activity was greater in intensity and more widespread in the dynamic task relative to the static task, but in which activity was present in both tasks relative to rest. These areas included left M1‐S1, left dorsal premotor cortex (PMd), SMA, left V5/MT, left lateral occipital complex (LO), and right lobules V, VI, and Crus II of the cerebellum. The finding that BOLD activity was greater in intensity and was more widespread in contralateral M1 and ispilateral anterior cerebellum is consistent with previous work from Keisker and colleagues [2010]. The current study identified additional brain regions with distinct between‐task differences. There are several factors that may explain why the current findings identified more brain areas unique to static and dynamic tasks than the study by Keisker et al. First, dynamic force pulses performed with a precision grip are associated with more widespread BOLD activity relative to dynamic force pulses performed with a power grip [Ehrsson et al.,2000]. Since Keisker and colleagues used a handgrip task, whereas the current work used a precision grip task, it is possible that the current work identified more brain regions because of differences between power and precision grip tasks. Second, Keisker et al. studied a self‐paced dynamic task wherein participants were trained to produce force pulses at 0.5 Hz and had to reproduce this pace during the fMRI session. In contrast, both tasks in the current study were externally guided by explicit visual feedback. Finally, as mentioned in the introduction, Keisker and colleagues focused on summed peak beta values from the dynamic—rest and static—rest contrasts. Due to the summation of beta values, this analysis approach may have focused more on common areas of activity rather than areas in which BOLD activity was unique to each specific task. The present work addressed this issue by performing a whole‐brain voxelwise analysis directly comparing dynamic and static force tasks. These methodological differences may explain why the present study reports more differences between static and dynamic force production.
The current results revealed five brain regions that were unique to the dynamic task: SMA, left SPL, left fusiform gyrus, left V3, and left lobule VI of the cerebellum. The dynamic task required rapid contraction and relaxation of hand muscles and, consequently, resulted in a characteristic rhythmic sequence not present in the static task. Thus, areas that were unique to the dynamic task may be related to turning muscles on and off and/or anticipating a rhythmic sequence. Moreover, the periodic nature of the changing target bar (i.e., red/green/red) during the force interval may have activated brain regions associated with state estimation, prediction, and motor timing. For instance, Smith et al. [1981] demonstrate that ablation of SMA in nonhuman primates results in an inability to release a precision grasp posture, an increased rate of change of grip force, and an increased mean grip force. Smith and colleagues' [1981] work, in combination with the present results, provides evidence that the SMA is critical for precision grip tasks that involve rapid transitions between contraction and relaxation of hand muscles. In addition, SMA is involved in time estimation [for reviews see Lewis and Miall,2003 or Macar et al.,2002], cue anticipation in simple reaction time tasks [Cui et al.,2009], and the production of timed movements [Lutz et al.,2000; Rao et al.,1997]. Moreover, Lewis and Miall [2003] propose that SMA is the critical node for motor timing and that SMA works in concert with the cerebellum. In terms of the current study, the consistent temporal structure of the dynamic task is likely a factor driving SMA activity.
It is possible that the activity observed in the cerebellum is related to functions of state estimation and motor timing—functions critical for performance of a rhythmic motor sequence. Indeed, patients with cerebellar lesions are unable to maintain timing in repetitive activities that involve a series of discrete movements, such as finger tapping [Ivry et al.,1988; Spencer et al.,2003], and neuroimaging studies demonstrate that cerebellar activity is associated with the production of rhythmic movements [Lutz et al.,2000; Penhune et al.,1998; Ramnani and Passingham,2001; Stoodley et al.,2010]. In the present work, we report activation in the anterior cerebellum consistent with areas containing sensorimotor representations of the hand [Grodd et al.,2001; for a review see Stoodley and Schmahmann,2010]. In addition, we report activation in Crus I and II, which are reciprocally connected with the posterior parietal cortex [Clower et al.,2001; Prevosto et al.,2010; Schmahmann and Pandya,1989]. This activation, as well as the activity in V3 and SPL, may be associated with the increased visuospatial processing demands in the dynamic task related to the changing color of the target bar and to the additional fluctuation of the moveable white force bar. Indeed, it has been suggested that the cerebellum and posterior parietal cortex play an important role in extracting relevant spatial information and for the prediction of sensory stimuli [Molinari and Leggio,2007]. This is an important point, because in addition to the differences in force production, the static and dynamic tasks also entail differences in visuospatial information. As described previously, we suggest the static task encourages the use of an online control strategy wherein force output is continuously adjusted with the use of visual feedback. In contrast, we suggest the dynamic task relies more on the prediction of visual events (i.e., the timing of the changing target bar) and predictive control of motor output (i.e., the modification of force output from trial‐to‐trial).
The finding that right‐lateralized cortical areas were unique to the production of static force, whereas midline and left‐lateralized cortical areas were unique to the production of dynamic force is consistent with the dynamic dominance hypothesis. In particular, this model asserts that the right hemisphere is specialized for the control of static limb posture and the left hemisphere is specialized for the control of dynamic aspects of movement, such as the coordination of muscle actions [Sainburg,2005; Wang and Sainburg,2007]. This hypothesis states that the right hemisphere relies heavily on feedback‐based mechanisms, whereas the left hemisphere relies to a greater extent on feed‐forward processes [Sainburg,2005]. This assertion is consistent with our suggestion that the static task places greater emphasis on continuous and feedback‐based control, whereas the dynamic task places greater emphasis on state estimation, prediction, and motor timing. It is important to note that the dynamic dominance hypothesis is based on studies evaluating the limb dynamics associated with rapid aiming movements. In particular, right hemisphere advantages are reported for load compensation [Bagesteiro and Sainburg,2003,2005] and online error correction [Duff and Sainburg,2007; Shabbott and Sainburg,2008] and left hemisphere advantages are reported for coordination during multijoint movements and adaptation to novel inertial dynamics [Bagesteiro and Sainburg,2003,2005; Duff and Sainburg,2007]. Such patterns of hemispheric specialization have been supported by lesion studies of unilateral stroke patients [Schaefer et al.,2007,2009a,b]. It is important to note, however, that these studies examined lesions in the cortex, not in the cerebellum. Therefore, the tenants of the dynamic dominance hypothesis seem to be limited to the cortex and may not extend to the cerebellum. The present finding that the dynamic task is associated with bilateral activation in the cerebellum is consistent with this interpretation. Notably, our findings provide the first neuroimaging evidence supporting a lateralized pattern of cortical activity for the production of static and dynamic precision grip force.
It could be argued that the static and dynamic tasks in the current experiment each contained static and dynamic components. Indeed, in the static task, the initial increase in force to the target amplitude and the subsequent return to relaxation are both dynamic in nature. Conversely, one could argue that the 2‐second target duration in the dynamic task elicits a static component while participants maintain force at the target. The analysis of BOLD activity during the entire 30‐second force period thus captured all of these components of force production. However, the between task differences were sufficient to elicit unique and robust patterns of BOLD activity. Indeed, the important difference investigated here was the changing force pattern over time, which required rapid contraction and relaxation of hand muscles, versus the maintenance of constant force output. In addition, it is important to consider whether the present results were affected by the total force amplitude during the 30‐second force interval. Mean force amplitude was calculated by sampling a portion of the force interval once participants had reached the force target. If we had calculated mean force during the entire 30‐second force interval in each task, the force amplitude for the static task would have been greater relative to the dynamic task. This is important because previous work from our group demonstrates that the BOLD signal increases with increasing force amplitude using a similar task [Spraker et al.,2007]. In other words, the finding that BOLD activity was greater in intensity and more widespread in the dynamic task relative to the static task suggests that the present results are robust to the possibility that different force amplitudes account for differences in the BOLD signal.
CONCLUSIONS
There were widespread similarities between static and dynamic force control; however, distinct differences were also observed. In particular, the production of static force was associated with a right‐lateralized cortical network, whereas the production of dynamic force was associated with a mostly left‐lateralized cortical network. The present study provides the first neuroimaging evidence supporting a lateralized pattern of brain activity for the production of static and dynamic precision grip force. This finding is consistent with the dynamic dominance hypothesis. Future work is required to determine if such lateralized patterns of brain activity are influenced by the hand used to perform the task or hand preference.
Acknowledgements
We thank Mike Flannery and Hagai Ganin for assistance with data collection.
REFERENCES
- Andersen RA, Asanuma C, Essick G, Siegel RM ( 1990): Corticocortical connections of anatomically and physiologically defined subdivisions within the inferior parietal lobule. J Comp Neurol 296: 65–113. [DOI] [PubMed] [Google Scholar]
- Ashe J ( 1997): Erratum to Force and the motor cortex: [Behavioural Brain Research 86 (1997) 1–15]. Behav Brain Res 87: 253–269. [DOI] [PubMed] [Google Scholar]
- Astafiev SV, Shulman GL, Stanley CM, Snyder AZ, Van Essen DC, Corbetta M ( 2003): Functional organization of human intraparietal and frontal cortex for attending, looking, and pointing. J Neurosci 23: 4689–4699. [DOI] [PMC free article] [PubMed] [Google Scholar]
- Bagesteiro LB, Sainburg RL ( 2003): Nondominant arm advantages in load compensation during rapid elbow joint movements. J Neurophysiol 90: 1503–1513. [DOI] [PMC free article] [PubMed] [Google Scholar]
- Bagesteiro LB, Sainburg RL ( 2005): Interlimb transfer of load compensation during rapid elbow joint movements. Exp Brain Res 161: 155–165. [DOI] [PMC free article] [PubMed] [Google Scholar]
- Binkofski F, Dohle C, Posse S, Stephan KM, Hefter H, Seitz RJ, Freund HJ ( 1998): Human anterior intraparietal area subserves prehension: A combined lesion and functional MRI activation study. Neurology 50: 1253–1259. [DOI] [PubMed] [Google Scholar]
- Blangero A, Menz MM, McNamara A, Binkofski F (2009): Parietal modules for reaching. Neuropsychologia 47:1500–1507. [DOI] [PubMed] [Google Scholar]
- Buch ER, Mars RB, Boorman ED, Rushworth MF ( 2010): A network centered on ventral premotor cortex exerts both facilitatory and inhibitory control over primary motor cortex during action reprogramming. J Neurosci 30: 1395–1401. [DOI] [PMC free article] [PubMed] [Google Scholar]
- Burke RE, Levine DN, Tsairis P, Zajac FE, III ( 1973): Physiological types and histochemical profiles in motor units of the cat gastrocnemius. J Physiol 234: 723–748. [DOI] [PMC free article] [PubMed] [Google Scholar]
- Burnod Y, Baraduc P, Battaglia‐Mayer A, Guigon E, Koechlin E, Ferraina S, et al. (1999): Parieto‐frontal coding of reaching: an integrated framework. Exp Brain Res 129:325–346. [DOI] [PubMed] [Google Scholar]
- Cavina‐Pratesi C, Monaco S, Fattori P, Galletti C, McAdam TD, Quinlan DJ, Goodale MA, Culham JC ( 2010): Functional magnetic resonance imaging reveals the neural substrates of arm transport and grip formation in reach‐to‐grasp actions in humans. J Neurosci 30: 10306–10323. [DOI] [PMC free article] [PubMed] [Google Scholar]
- Clower DM, West RA, Lynch JC, Strick PL ( 2001): The inferior parietal lobule is the target of output from the superior colliculus, hippocampus, and cerebellum. J Neurosci 21: 6283–6291. [DOI] [PMC free article] [PubMed] [Google Scholar]
- Coombes SA, Corcos DM, Sprute L, Vaillancourt DE ( 2010): Selective regions of the visuomotor system are related to gain‐induced changes in force error. J Neurophysiol 103: 2114–2123. [DOI] [PMC free article] [PubMed] [Google Scholar]
- Cui X, Stetson C, Montague PR, Eagleman DM ( 2009): Ready...go: Amplitude of the FMRI signal encodes expectation of cue arrival time. PLoS Biol 7: e1000167. [DOI] [PMC free article] [PubMed] [Google Scholar]
- Culham J, Danckert S, Souza JXD, Gati J, Menon R, Goodale M ( 2003): Visually guided grasping produces fMRI activation in dorsal but not ventral stream brain areas. Exp Brain Res 153: 180–189. [DOI] [PubMed] [Google Scholar]
- Dai TH, Liu JZ, Sahgal V, Brown RW, Yue GH ( 2001): Relationship between muscle output and functional MRI‐measured brain activation. Exp Brain Res 140: 290–300. [DOI] [PubMed] [Google Scholar]
- Davare M, Andres M, Cosnard G, Thonnard JL, Olivier E ( 2006): Dissociating the role of ventral and dorsal premotor cortex in precision grasping. J Neurosci 26: 2260–2268. [DOI] [PMC free article] [PubMed] [Google Scholar]
- Davare M, Rothwell JC, Lemon RN ( 2010): Causal connectivity between the human anterior intraparietal area and premotor cortex during grasp. Curr Biol 20: 176–181. [DOI] [PMC free article] [PubMed] [Google Scholar]
- Desmurget M, Grafton S ( 2000): Forward modeling allows feedback control for fast reaching movements. Trends Cogn Sci 4: 423–431. [DOI] [PubMed] [Google Scholar]
- Desmurget M, Epstein CM, Turner RS, Prablanc C, Alexander GE, Grafton ST ( 1999): Role of the posterior parietal cortex in updating reaching movements to a visual target. Nat Neurosci 2: 563–567. [DOI] [PubMed] [Google Scholar]
- Duchateau J, Enoka RM ( 2008): Neural control of shortening and lengthening contractions: Influence of task constraints. J Physiol 586: 5853–5864. [DOI] [PMC free article] [PubMed] [Google Scholar]
- Duff SV, Sainburg RL ( 2007): Lateralization of motor adaptation reveals independence in control of trajectory and steady‐state position. Exp Brain Res 179: 551–561. [DOI] [PMC free article] [PubMed] [Google Scholar]
- Dum RP, Strick PL ( 2005): Frontal lobe inputs to the digit representations of the motor areas on the lateral surface of the hemisphere. J Neurosci 25: 1375–1386. [DOI] [PMC free article] [PubMed] [Google Scholar]
- Ehrsson HH, Fagergren A, Jonsson T, Westling G, Johansson RS, Forssberg H ( 2000): Cortical activity in precision‐ versus power‐grip tasks: An fMRI study. J Neurophysiol 83: 528–536. [DOI] [PubMed] [Google Scholar]
- Filimon F ( 2010): Human cortical control of hand movements: Parietofrontal networks for reaching, grasping, and pointing. Neuroscientist 16: 388–407. [DOI] [PubMed] [Google Scholar]
- Floyer‐Lea A, Matthews PM ( 2004): Changing brain networks for visuomotor control with increased movement automaticity. J Neurophysiol 92: 2405–2412. [DOI] [PubMed] [Google Scholar]
- Floyer‐Lea A, Matthews PM ( 2005): Distinguishable brain activation networks for short‐ and long‐term motor skill learning. J Neurophysiol 94: 512–518. [DOI] [PubMed] [Google Scholar]
- Fluet MC, Baumann MA, Scherberger H ( 2010): Context‐specific grasp movement representation in macaque ventral premotor cortex. J Neurosci 30: 15175–15184. [DOI] [PMC free article] [PubMed] [Google Scholar]
- Fogassi L, Gallese V, Buccino G, Craighero L, Fadiga L, Rizzolatti G ( 2001): Cortical mechanism for the visual guidance of hand grasping movements in the monkey: A reversible inactivation study. Brain 124: 571–586. [DOI] [PubMed] [Google Scholar]
- Frey SH, Vinton D, Norlund R, Grafton ST ( 2005): Cortical topography of human anterior intraparietal cortex active during visually guided grasping. Brain Res Cogn Brain Res 23: 397–405. [DOI] [PubMed] [Google Scholar]
- Georgopoulos AP, Ashe J, Smyrnis N, Taira M ( 1992): The motor cortex and the coding of force. Science 256: 1692–1695. [DOI] [PubMed] [Google Scholar]
- Grafton ST ( 2010): The cognitive neuroscience of prehension: recent developments. Exp Brain Res 204: 475–491. [DOI] [PMC free article] [PubMed] [Google Scholar]
- Grafton ST, Fagg AH, Woods RP, Arbib MA ( 1996): Functional anatomy of pointing and grasping in humans. Cerebral Cortex 6: 226–237. [DOI] [PubMed] [Google Scholar]
- Grodd W, Hulsmann E, Lotze M, Wildgruber D, Erb M ( 2001): Sensorimotor mapping of the human cerebellum: fMRI evidence of somatotopic organization. Hum Brain Mapp 13: 55–73. [DOI] [PMC free article] [PubMed] [Google Scholar]
- Grol MJ, Majdandzic J, Stephan KE, Verhagen L, Dijkerman HC, Bekkering H, Verstraten FA, Toni I ( 2007): Parieto‐frontal connectivity during visually guided grasping. J Neurosci 27: 11877–11887. [DOI] [PMC free article] [PubMed] [Google Scholar]
- Grosbras MH, Lobel E, Van de Moortele PF, LeBihan D, Berthoz A ( 1999): An anatomical landmark for the supplementary eye fields in human revealed with functional magnetic resonance imaging. Cereb Cortex 9: 705–711. [DOI] [PubMed] [Google Scholar]
- Ivry RB, Keele SW, Diener HC ( 1988): Dissociation of the lateral and medial cerebellum in movement timing and movement execution. Exp Brain Res 73: 167–180. [DOI] [PubMed] [Google Scholar]
- Kalaska JF ( 2009): From intention to action: Motor cortex and the control of reaching movements. Progr Motor Control: Multidis Persp 629: 139–178. [DOI] [PubMed] [Google Scholar]
- Keisker B, Hepp‐Reymond MC, Blickenstorfer A, Kollias SS ( 2010): Differential representation of dynamic and static power grip force in the sensorimotor network. Eur J Neurosci 31: 1483–1491. [DOI] [PubMed] [Google Scholar]
- Kroliczak G, Cavina‐Pratesi C, Goodman DA, Culham JC ( 2007): What does the brain do when you fake it? An FMRI study of pantomimed and real grasping. J Neurophysiol 97: 2410–2422. [DOI] [PubMed] [Google Scholar]
- Kuhtz‐Buschbeck JP, Gilster R, Wolff S, Ulmer S, Siebner H, Jansen O ( 2008): Brain activity is similar during precision and power gripping with light force: an fMRI study. Neuroimage 40: 1469–1481. [DOI] [PubMed] [Google Scholar]
- Lewis PA, Miall RC ( 2003): Distinct systems for automatic and cognitively controlled time measurement: Evidence from neuroimaging. Curr Opin Neurobiol 13: 250–255. [DOI] [PubMed] [Google Scholar]
- Luppino G, Murata A, Govoni P, Matelli M ( 1999): Largely segregated parietofrontal connections linking rostral intraparietal cortex (areas AIP and VIP) and the ventral premotor cortex (areas F5 and F4). Exp Brain Res 128: 181–187. [DOI] [PubMed] [Google Scholar]
- Lutz K, Specht K, Shah NJ, Jancke L ( 2000): Tapping movements according to regular and irregular visual timing signals investigated with fMRI. Neuroreport 11: 1301–1306. [DOI] [PubMed] [Google Scholar]
- Macar F, Lejeune H, Bonnet M, Ferrara A, Pouthas V, Vidal F, Maquet P ( 2002): Activation of the supplementary motor area and of attentional networks during temporal processing. Exp Brain Res 142: 475–485. [DOI] [PubMed] [Google Scholar]
- Malach R, Reppas JB, Benson RR, Kwong KK, Jiang H, Kennedy WA, et al. (1995): Object‐related activity revealed by functional magnetic resonance imaging in human occipital cortex. Proc Natl Acad Sci U S A 92:8135–8139. PMCID: PMC41110. [DOI] [PMC free article] [PubMed] [Google Scholar]
- Marangon M, Jacobs S, Frey SH ( 2011): Evidence for context sensitivity of grasp representations in human parietal and premotor cortices. J Neurophysiol 105: 2536–2546. [DOI] [PMC free article] [PubMed] [Google Scholar]
- Mayka MA, Corcos DM, Leurgans SE, Vaillancourt DE ( 2006): Three‐dimensional locations and boundaries of motor and premotor cortices as defined by functional brain imaging: a meta‐analysis. Neuroimage 31: 1453–1474. [DOI] [PMC free article] [PubMed] [Google Scholar]
- Molinari M, Leggio MG ( 2007): Cerebellar information processing and visuospatial functions. Cerebellum 6: 214–220. [DOI] [PubMed] [Google Scholar]
- Mouncastle VB, Talbot WH, Kornhuber HH ( 1966): The neural transformation of mechanical stimuli delivered to the monkey's hand In: de Reuck AVS, Knight J, editors. Ciba Foundation Symposium: Touch, Heat, and Pain. London: Churchill; pp 325–351. [Google Scholar]
- Murata A, Fadiga L, Fogassi L, Gallese V, Raos V, Rizzolatti G ( 1997): Object representation in the ventral premotor cortex (area F5) of the monkey. J Neurophysiol 78: 2226–2230. [DOI] [PubMed] [Google Scholar]
- Oldfield RC ( 1971): The assessment and analysis of handedness: The Edinburgh inventory. Neuropsychologia 9: 97–113. [DOI] [PubMed] [Google Scholar]
- Pardo JV, Fox PT, Raichle ME ( 1991): Localization of a human system for sustained attention by positron emission tomography. Nature 349: 61–64. [DOI] [PubMed] [Google Scholar]
- Penhune VB, Zattore RJ, Evans AC ( 1998): Cerebellar contributions to motor timing: A PET study of auditory and visual rhythm reproduction. J Cogn Neurosci 10: 752–765. [DOI] [PubMed] [Google Scholar]
- Petrides M, Pandya DN ( 1984): Projections to the frontal cortex from the posterior parietal region in the rhesus monkey. J Comp Neurol 228: 105–116. [DOI] [PubMed] [Google Scholar]
- Prabhu G, Shimazu H, Cerri G, Brochier T, Spinks RL, Maier MA, Lemon RN ( 2009): Modulation of primary motor cortex outputs from ventral premotor cortex during visually guided grasp in the macaque monkey. J Physiol 587: 1057–1069. [DOI] [PMC free article] [PubMed] [Google Scholar]
- Prado J, Clavagnier S, Otzenberger H, Scheiber C, Kennedy H, Perenin MT ( 2005): Two cortical systems for reaching in central and peripheral vision. Neuron 48: 849–858. [DOI] [PubMed] [Google Scholar]
- Prevosto V, Graf W, Ugolini G ( 2010): Cerebellar inputs to intraparietal cortex areas LIP and MIP: Functional frameworks for adaptive control of eye movements, reaching, and arm/eye/head movement coordination. Cereb Cortex 20: 214–228. [DOI] [PMC free article] [PubMed] [Google Scholar]
- Prochazka A, Hullinger M, Trend P, Durmuller N ( 1988): Dynamic and static fusimotor set in various behavioural contexts In: Hnik P, Soukup T, Vejsada R, Zelena J, editors. Mechanoreceptors: Development, Structure, and Function. New York: Plenum; pp. 417–430. [Google Scholar]
- Prodoehl J, Yu H, Little DM, Abraham I, Vaillancourt DE ( 2008): Region of interest template for the human basal ganglia: Comparing EPI and standardized space approaches. Neuroimage 39: 956–965. [DOI] [PMC free article] [PubMed] [Google Scholar]
- Ramnani N, Passingham RE ( 2001): Changes in the human brain during rhythm learning. J Cogn Neurosci 13: 952–966. [DOI] [PubMed] [Google Scholar]
- Rao SM, Harrington DL, Haaland KY, Bobholz JA, Cox RW, Binder JR ( 1997): Distributed neural systems underlying the timing of movements. J Neurosci 17: 5528–5535. [DOI] [PMC free article] [PubMed] [Google Scholar]
- Raos V, Umilta MA, Murata A, Fogassi L, Gallese V ( 2006): Functional properties of grasping‐related neurons in the ventral premotor area F5 of the macaque monkey. J Neurophysiol 95: 709–729. [DOI] [PubMed] [Google Scholar]
- Rozzi S, Calzavara R, Belmalih A, Borra E, Gregoriou GG, Matelli M, Luppino G ( 2006): Cortical connections of the inferior parietal cortical convexity of the macaque monkey. Cereb Cortex 16: 1389–1417. [DOI] [PubMed] [Google Scholar]
- Sainburg RL ( 2005): Handedness: differential specializations for control of trajectory and position. Exerc Sport Sci Rev 33: 206–213. [DOI] [PMC free article] [PubMed] [Google Scholar]
- Schaefer SY, Haaland KY, Sainburg RL ( 2007): Ipsilesional motor deficits following stroke reflect hemispheric specializations for movement control. Brain J Neurol 130: 2146–2158. [DOI] [PMC free article] [PubMed] [Google Scholar]
- Schaefer SY, Haaland KY, Sainburg RL ( 2009a): Dissociation of initial trajectory and final position errors during visuomotor adaptation following unilateral stroke. Brain Res 1298: 78–91. [DOI] [PMC free article] [PubMed] [Google Scholar]
- Schaefer SY, Haaland KY, Sainburg RL ( 2009b): Hemispheric specialization and functional impact of ipsilesional deficits in movement coordination and accuracy. Neuropsychologia 47: 2953–2966. [DOI] [PMC free article] [PubMed] [Google Scholar]
- Schmahmann JD, Pandya DN ( 1989): Anatomical investigation of projections to the basis pontis from posterior parietal association cortices in rhesus monkey. J Comp Neurol 289: 53–73. [DOI] [PubMed] [Google Scholar]
- Schmahmann JD, Doyon J, Toga A, Petrides M, Evans A (2000): MRI Atlas of the Human Cerebellum. Academic Press, San Diego. [DOI] [PubMed] [Google Scholar]
- Seltzer B, Pandya DN ( 1978): Afferent cortical connections and architectonics of the superior temporal sulcus and surrounding cortex in the rhesus monkey. Brain Res 149: 1–24. [DOI] [PubMed] [Google Scholar]
- Semmler JG, Kornatz KW, Dinenno DV, Zhou S, Enoka RM ( 2002): Motor unit synchronisation is enhanced during slow lengthening contractions of a hand muscle. J Physiol 545: 681–695. [DOI] [PMC free article] [PubMed] [Google Scholar]
- Shabbott BA, Sainburg RL ( 2008): Differentiating between two models of motor lateralization. J Neurophysiol 100: 565–575. [DOI] [PMC free article] [PubMed] [Google Scholar]
- Shulman GL, Pope DL, Astafiev SV, McAvoy MP, Snyder AZ, Corbetta M ( 2010): Right hemisphere dominance during spatial selective attention and target detection occurs outside the dorsal frontoparietal network. J Neurosci 30: 3640–3651. [DOI] [PMC free article] [PubMed] [Google Scholar]
- Simon O, Mangin JF, Cohen L, Le Bihan D, Dehaene S (2002): Topographical layout of hand, eye, calculation, and language‐related areas in the human parietal lobe. Neuron 33:475–487. [DOI] [PubMed] [Google Scholar]
- Smith AM, Bourbonnais D, Blanchette G ( 1981): Interaction between forced grasping and a learned precision grip after ablation of the supplementary motor area. Brain Res 222: 395–400. [DOI] [PubMed] [Google Scholar]
- Spencer RM, Zelaznik HN, Diedrichsen J, Ivry RB ( 2003): Disrupted timing of discontinuous but not continuous movements by cerebellar lesions. Science 300: 1437–1439. [DOI] [PubMed] [Google Scholar]
- Spraker MB, Yu H, Corcos DM, Vaillancourt DE ( 2007): Role of individual basal ganglia nuclei in force amplitude generation. J Neurophysiol 98: 821–834. [DOI] [PMC free article] [PubMed] [Google Scholar]
- Stoodley CJ, Schmahmann JD ( 2010): Evidence for topographic organization in the cerebellum of motor control versus cognitive and affective processing. Cortex 46: 831–844. [DOI] [PMC free article] [PubMed] [Google Scholar]
- Stoodley CJ, Valera EM, Schmahmann JD ( 2010): An fMRI study of intra‐individual functional topography in the human cerebellum. Behav Neurol 23: 65–79. [DOI] [PMC free article] [PubMed] [Google Scholar]
- Sturm W, de Simone A, Krause BJ, Specht K, Hesselmann V, Radermacher I, et al. ( 1999): Functional anatomy of intrinsic alertness: evidence for a fronto‐parietal‐thalamic‐brainstem network in the right hemisphere. Neuropsychologia 37: 797–805. [DOI] [PubMed] [Google Scholar]
- Taira M, Mine S, Georgopoulos AP, Murata A, Sakata H (1990): Parietal cortex neurons of the monkey related to the visual guidance of hand movement. Exp Brain Res 83:29–36. [DOI] [PubMed] [Google Scholar]
- Thickbroom GW, Phillips BA, Morris I, Byrnes ML, Mastaglia FL ( 1998): Isometric force‐related activity in sensorimotor cortex measured with functional MRI. Exp Brain Res 121: 59–64. [DOI] [PubMed] [Google Scholar]
- Thickbroom GW, Phillips BA, Morris I, Byrnes ML, Sacco P, Mastaglia FL ( 1999): Differences in functional magnetic resonance imaging of sensorimotor cortex during static and dynamic finger flexion. Exp Brain Res 126: 431–438. [DOI] [PubMed] [Google Scholar]
- Tunik E, Rice NJ, Hamilton A, Grafton ST ( 2007): Beyond grasping: Representation of action in human anterior intraparietal sulcus. Neuroimage 36: T77–T86. [DOI] [PMC free article] [PubMed] [Google Scholar]
- Umilta MA, Brochier T, Spinks RL, Lemon RN ( 2007): Simultaneous recording of macaque premotor and primary motor cortex neuronal populations reveals different functional contributions to visuomotor grasp. J Neurophysiol 98: 488–501. [DOI] [PubMed] [Google Scholar]
- Vaillancourt DE, Thulborn KR, Corcos DM ( 2003): Neural basis for the processes that underlie visually guided and internally guided force control in humans. J Neurophysiol 90: 3330–3340. [DOI] [PubMed] [Google Scholar]
- Vaillancourt DE, Mayka MA, Corcos DM (2006): Intermittent visuomotor processing in the human cerebellum, parietal cortex, and premotor cortex. J Neurophysiol 95:922–931. PMCID: PMC2366036. [DOI] [PMC free article] [PubMed] [Google Scholar]
- Wang J, Sainburg RL ( 2006): The symmetry of interlimb transfer depends on workspace locations. Exp Brain Res 170: 464–471. [DOI] [PMC free article] [PubMed] [Google Scholar]
- Wang J, Sainburg RL ( 2007): The dominant and nondominant arms are specialized for stabilizing different features of task performance. Exp Brain Res 178: 565–570. [DOI] [PMC free article] [PubMed] [Google Scholar]
- Woolley DG, Wenderoth N, Heuninckx S, Zhang X, Callaert D, Swinnen SP ( 2010): Visual guidance modulates hemispheric asymmetries during an interlimb coordination task. Neuroimage 50: 1566–1577. [DOI] [PubMed] [Google Scholar]