

Abstract
There are strong correlations between cortical atrophy observed by MRI and clinical disability and disease duration in multiple sclerosis (MS). The objective of this study was to evaluate the progression of cortical atrophy over time in vivo in experimental autoimmune encephalomyelitis (EAE), the most commonly used animal model for MS. Volumetric changes in brains of EAE mice and matched healthy controls were quantified by collecting high-resolution T2-weighted magnetic resonance images in vivo and labeling anatomical structures on the images. In vivo scanning permitted us to evaluate brain structure volumes in individual animals over time and we observed that though brain atrophy progressed differently in each individual animal, all mice with EAE demonstrated significant atrophy in whole brain, cerebral cortex, and whole cerebellum compared to normal controls. Furthermore, we found a strong correlation between cerebellar atrophy and cumulative disease score in mice with EAE. Ex vivo MRI showed a significant decrease in brain and cerebellar volume and a trend that did not reach significance in cerebral cortex volume in mice with EAE compared to controls. Cross modality correlations revealed a significant association between neuronal loss on neuropathology and in vivo atrophy of the cerebral cortex by neuroimaging. These results demonstrate that longitudinal in vivo imaging is more sensitive to changes that occur in neurodegenerative disease models than cross-sectional ex vivo imaging. This is the first report of progressive cortical atrophy in vivo in a mouse model of MS.
Introduction
Multiple sclerosis (MS) is an inflammatory, demyelinating disease of the central nervous system (CNS). Magnetic resonance imaging (MRI) techniques been developed in order to visualize disease activity in MS primarily in the form of the number and volume of lesions in the CNS (Zivadinov and Bakshi, 2004b). However, even though lesion volume has been shown to correlate with clinical measures of disease progression, it is clear that lesions can represent both reversible and irreversible effects of the disease (Bermel and Bakshi, 2006). A growing body of literature has documented the neurodegenerative aspect of MS (Peterson and Fujinami, 2007; Trapp et al., 1999) and shown gray matter atrophy to be a better indicator of irreversible clinical disease progression and cognitive impairment (Amato et al., 2008; Bermel and Bakshi, 2006; Miller et al., 2002; Zivadinov and Bakshi, 2004b). In fact, measurement of whole-brain atrophy has been correlated strongly with disability (Rudick et al., 1999; Zivadinov and Bakshi, 2004a) and in one study involving an eight-year observation period brain atrophy was found to have the most robust correlation with disability out of several MRI measures (Fisher et al., 2002). Additionally, anatomically localized atrophy has been shown to correlate strongly to disability, specifically cerebellar cortex atrophy correlated with cerebellar disability (Calabrese et al., 2010).
Mouse disease models play a critical role in the understanding of disease mechanisms, progression and drug efficacy testing because of similarities in disease shared between mouse and human and the feasibility of genetic manipulation in this species. Brain morphology is often an important biomarker to detect and monitor neurological disease in mouse models; including the atrophy of specific brain regions. Histology has been widely used for the characterization of the phenotype and evaluation of therapeutic interventions. However, in recent years in vivo magnetic resonance imaging (MRI) in mice has become a promising and widely available technique to examine brain morphology (Bock et al., 2006; Borg and Chereul, 2008; Delatour et al., 2006). MRI has permitted the repeated measure of neuroanatomical structures to evaluate the progression of atrophy in these structures in vivo (Lau et al., 2008; Zhang et al., 2010). It has high anatomical accuracy without the tissue deformation associated with the embedding, sectioning and staining procedures used in histology. Also, its quantitative three-dimensional (3D) format makes it much more accurate at volume measurement than conventional histological methods (Badea et al., 2007; Jacobs et al., 1999; Kovacevic et al., 2005; Ma et al., 2005; MacKenzie-Graham et al., 2009).
MRI has been used extensively in the study of the most commonly used animal model of MS, experimental autoimmune encephalomyelitis (EAE). A great deal of work has focused primarily on white matter lesions and their visualization (Ahrens et al., 1998; Levy et al., 2010; Morrissey et al., 1996; Pirko et al., 2008). However, recent work has reinforced the “clinico-radiological paradox” describing a discrepancy between lesion burden visualized by MRI and the extent of clinical disability (Wuerfel et al., 2007). Measures of axonal damage in the spinal cord using diffusion tensor imaging (DTI) have shown greater correlation with clinical scores (Budde et al., 2008), but do not assess injury to the gray matter in EAE.
In previous studies we have demonstrated ex vivo gray matter atrophy in the cerebellar cortex of mice with EAE (MacKenzie-Graham et al., 2006; MacKenzie-Graham et al., 2009). In this study we proposed to analyze gray matter atrophy in vivo and to examine the neuropathological underpinnings of that atrophy. Despite the generally lower spatial resolution of in vivo compared to ex vivo MRI (as a result of shorter acquisition times), we hypothesized that in vivo MRI might nevertheless be more sensitive for detection of atrophy, particularly in the cerebral cortex. This greater sensitivity would be due to maintenance of the in vivo morphology of the brain, with full ventricles and anatomical structures adjacent to the ventricles retaining their in vivo configuration, as opposed to displacement into the collapsed ventricles that occurs in ex vivo MRI. Thus, in order to detect progression of gray matter atrophy in the cerebral cortex of mice with EAE we induced disease in female C57BL/6 mice with myelin oligodendrocyte glycoprotein (MOG) and imaged the mice before disease induction and during the course of disease.
Material and Methods
Approach
In vivo T2-weighted magnetic resonance images were acquired from 27 mice, 8 untreated normal controls, 10 pertussis toxin (PTX) and Complete Freund’s Adjuvant (CFA) healthy controls and 9 mice with EAE. One set of scans was acquired from each animal prior to disease induction (d0), one set twenty days post disease induction (d20), one set forty days post disease induction (d40) and one set eighty days post disease induction (d80) (Fig. 1). In this study, we had two control groups - PTX and CFA-treated mice as well as unmanipulated healthy controls. There was no significant difference in neuroanatomical volumes between untreated normal controls and PTX and CFA-treated healthy controls (data not shown).
Fig. 1.
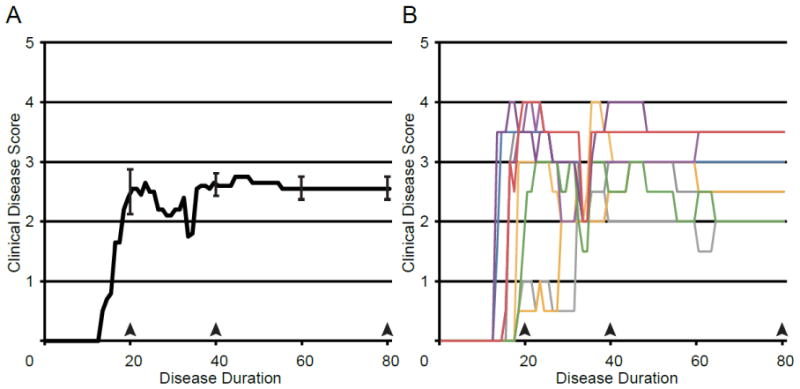
Disease Course. (A) A graph of the mean clinical disease score in mice with EAE plotted against disease duration. Error bars indicate SEM. (B) A graph of clinical disease scores plotted against disease duration. Individual disease courses are represented as lines of differing colors. Each color represents a single animal and is used consistently.
All the scans were skull-stripped and signal intensity inhomogeneities corrected. A minimum deformation atlas (MDA) was constructed from the 108 images collected (27 mice × 4 time points) (Fig. 2). The MDA then served as a target space for the spatial and intensity normalization of the original images, correcting both positional and intensity differences. Following creation of this atlas, whole brain, cerebral cortices, cerebellum and the olfactory bulbs were manually labeled on the atlas. The labels were then warped onto the individual spatially normalized images and manually corrected to produce standardized estimates of gray matter volumes in individual subjects.
Fig. 2.
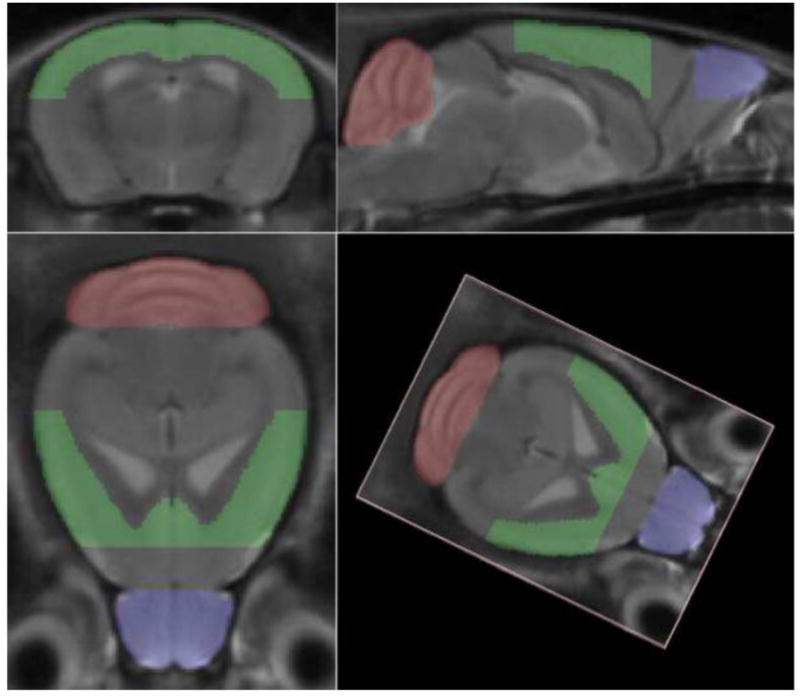
Minimum Deformation Atlas. Three orthogonal and one arbitrary views of a minimum deformation atlas that was constructed from 48 in vivo high resolution T2-weighted magnetic resonance images of mouse brain, comprising images collected from 12 mice at four time points: before disease induction (d0), twenty days post-induction (d20), forty days post-induction (d40) and eighty days post-induction (d80).
All mice were subsequently perfusion fixed and their brains scanned ex vivo. Once again, all the scans were skull-stripped and signal intensity inhomogeneities corrected. An MDA was constructed from the 108 ex vivo images collected. The MDA then served as a target space for the spatial and intensity normalization of the original images. Following creation of this ex vivo atlas, whole brain, cerebral cortices, cerebellum and the olfactory bulbs were manually labeled on the atlas. The labels were then warped onto the individual spatially normalized images and manually corrected to produce standardized estimates of gray matter volumes in individual subjects.
Brains were then sectioned and stained using antibodies to myelin basic protein (MBP; to assess myelin), neurofilament (NF200; to assess axons and cytoskeleton), synapsin-1 (SYN1; to assess synaptic numbers) and neuronal nuclei (NeuN; to assess neuronal cell numbers).
Mice
Female C57BL/6 mice, 15 weeks old, were purchased from the Jackson Laboratory. All studies were performed in accordance with approval from the relevant institutional authority.
Antigen
Myelin oligodendrocyte glycoprotein (MOG) peptide 35–55 was purchased at greater than 98% purity (Chiron Mimotopes, Emeryville, CA).
EAE
Mice were immunized with MOG peptide 35–55 (300 μg/mouse) and Mycobacterium tuberculosis (500 μg/mouse) emulsified in Complete Freund’s Adjuvant (CFA; Difco Laboratories, Detroit, MI) subcutaneously, in a volume of 0.1 ml/mouse over two sites: the right draining inguinal and axillary lymph nodes. One week later a booster immunization was delivered subcutaneously, over the contralateral draining lymph nodes. Pertussis toxin (500 ng/mouse) (PTX; List Biological Laboratories, Inc., Campbell, CA) was injected intraperitoneally on days 0 and 2 (Liu et al., 2003; Suen et al., 1997). In addition, two sets of 5 mice (10 total) were treated with PTX and CFA for use as healthy controls. EAE was graded on a scale of 0 to 5, based on difficulty with ambulation, as described in (Pettinelli and McFarlin, 1981). These clinical scores were summed over time to produce the cumulative disease score for each individual.
In Vivo Magnetic Resonance Imaging
Mice were anesthetized with isofluorane and received a bolus of sterile saline solution prior to imaging to prevent dehydration. The mice were maintained at 37°C and their breathing monitored during imaging to monitor distress. Magnetic resonance imaging was performed using a 200 mm horizontal bore 7.0 T Bruker imaging spectrometer with a micro-imaging gradient insert with a maximum gradient strength of 100 G/cm and 30 mm birdcage RF coil (Bruker Instruments, Billerica, MA). Imaging parameters were as follows: T2-weighted multiple echo spin echo pulse sequence (8 echoes), matrix dimensions = 128 × 64 × 265; field of view = 1.92 cm × 0.96 cm × 3.84 cm; repetition time (TR) = 5741.1 ms; apparent time to echo (apparent TE) = 50 ms; number of averages = 16. Spatial resolution was 150 μm3 per voxel.
Ex Vivo Magnetic Resonance Imaging
Mice were perfused intracardially and post-fixed with 4% paraformaldehyde (Sigma-Aldrich, St. Louis, MO). After post-fixation the brains were incubated in PBS for 10–15 days prior to imaging. Magnetic resonance imaging was performed using a 200 mm horizontal bore 7.0 T Bruker imaging spectrometer with a micro-imaging gradient insert with a maximum gradient strength of 100 G/cm and 30 mm birdcage RF coil (Bruker Instruments, Billerica, MA). The brains were held in custom-made delrin holders in test tubes filled with Fomblin Perfluoropolyether (PFPE) YO4 grade (Ausimont USA, Inc., Thorofare, NJ) and maintained at 4°C. Imaging parameters were as follows: T2-weighted RARE 3D imaging protocol (8 echoes), matrix dimensions = 100 × 512 × 150; FOV = 0.64 cm × 3.3 cm × 0.97 cm; repetition time (TR) = 5741.1 ms; apparent time to echo (apparent TE) = 50 ms; number of averages = 80. Typical spatial resolution was approximately 64 μm3 per voxel.
Image Processing
MR images were skull-stripped using the Brain Surface Extractor (BSE) within BrainSuite 2 (Shattuck and Leahy, 2001). Residual non-brain signal was removed by manually editing the masks using BrainSuite 2. After skull-stripping, signal intensity inhomogeneities were corrected using N3 correction (Sled et al., 1998). A minimum deformation atlas (MDA) was produced as described by (MacKenzie-Graham et al., 2004). Images were spatially normalized with a 6-parameter rigid-body transformation to register individual images to the MDA using Alignlinear (AIR) (Woods et al., 1998a; Woods et al., 1998b). This transformation was selected to align all the images in a common space, yet preserve volumetric differences between individual mice. An intensity rescaling cost function was used in order to intensity normalize the images. All automated image processing was performed using the LONI Pipeline Processing Environment (Rex et al., 2003) on an 8-processor core Mac Pro computer (Apple, Cupertino, CA).
Anatomical Labels
Anatomical labels based on the Mouse Atlas Project 2003 mouse brain atlas (MacKenzie-Graham et al., 2004) were warped out to the individual mouse brain images as described (MacKenzie-Graham et al., 2009). A blinded expert neuroanatomist using BrainSuite 2 manually corrected labeled anatomical structures on the MDA. Whole brain (BR) labels comprised gray matter, white matter and the ventricular system. The label extended along the spinal cord 300 um beyond the cerebellum. For clarity and consistency, our cerebral cortex (CTX) label was bounded ventrally by the plane inferior to the most anterior point of the corpus callosum at midline. Importantly, this label contained both the somatosensory regions (primary and secondary) and the motor cortex (primary and secondary), but excluded the olfactory bulb. The olfactory bulb (OLF) label included gray matter, white matter and the anterior portions of the lateral ventricles. The plane described above also forms the ventral border of the olfactory bulb label. Whole cerebellum (CB) labels included cerebellar cortex, deep cerebellar nuclei and cerebellar white matter. Additional anatomical information was obtained from Franklin and Paxinos mouse brain atlas (Franklin and Paxinos, 2008).
A common criticism of in vivo MRI is the reproducibility of the imaging data from one acquisition to another. To address this possible confound, five untreated female C57BL/6J mice were scanned in vivo and brain volumes were measured. The average brain volume was 491 mm3 with a standard error of 4.7 mm3 (95% confidence interval, 482–500). To establish scan-rescan reliability a single untreated female C57BL/6J mouse was imaged in vivo four times on separate days. The average brain volume was 488 mm3 with a standard error of 1.8 mm3 (95% confidence interval, 484–492; data not shown).
Immunohistochemistry
After magnetic resonance imaging, brains were removed from the skull and prepared for sectioning. 50 μm sagittal frozen sections were cut using a CM3050S cryostat (Leica Microsystems, Wetzlar, Germany). Free-floating sections were permeabilized in 0.3% Triton X-100 in PBS and blocked with 10% normal goat serum (Vector Laboratories, Burlingame, CA). Sections were pre-incubated with primary antibodies in PBS solution containing 2% NGS for 2 hours at room temperature, then overnight at 4°C. The following primary antibodies were used: rabbit anti-Beta-3 tubulin (1:500) (Sigma-Aldrich), rat anti-MBP (1:500) (Millipore Billerica, MA), rabbit anti-NF200 (1:1000) (Sigma-Aldrich), mouse anti-NeuN (1:500) (Millipore) or rabbit anti-SYN1 (1:500) (Millipore). Fluorescence secondary antibody labeling included antibodies conjugated to Cy3 and Cy5 (Millipore). To visualize individual cells, 4′,6′-diamidino-2-phenylindole dihydrochloride (2ng/ml) (DAPI; Invitrogen, Carlsbad, CA) was added for 15 minutes prior to final washes after secondary antibody addition. The sections were mounted on slides, dried, and coverslipped with fluoromount G (Fisher Scientific, Pittsburgh, PA). Chromogen immunohistochemistry was performed, after avidin-biotin block, by incubating with the primary antibody followed by a biotinylated secondary antibody. A streptavidin-peroxidase conjugate was added, followed by the addition of the 3,3′-Diaminobenzidine (DAB; Sigma-Aldrich). The sections were mounted, dehydrated and coverslipped with Permount (Fisher Scientific).
Histology
Sections were mounted and silver-stained using the Gallyas silver stain for myelin as described (Gallyas, 1979). The sections were then dehydrated and coverslipped with Permount (Fisher Scientific).
Microscopy and Analysis
Confocal images of immunostained sections were photographed using a spin-disc (Olympus, Center Valley, PA) with a digital camera (Hamamatsu Photonics, Bridgewater, NJ). All images were collected using the same acquisition parameters. Photomicrographs of each representative experimental group were collected and analyzed with ImageJ software (v1.45a).
The amount of myelin and cytoskeletal integrity in cortical gray matter was quantified in anti-MBP and anti-NF200 staining using optical density measurements. Confocal stacks of immunolabeled images from each animal were processed with a series of manual and automated procedures that included the following steps: (1) the images were oriented in the same direction, (2) the RGB channels of the images were split and converted to 8 bit grayscale images in ImageJ and (3) threshold density was calculated and reported as a percentage of total area.
Presynaptic synapsin-1 puncta were evaluated in 60X confocal images of the cerebral cortex containing the motor and somatosensory regions. Images were oriented in the same direction and the RGB channels of the images were split and converted to 8 bit grayscale images in ImageJ. Three to five brain sections (50 μm thick) 200 μm apart were analyzed from each animal (normal: n = 8; control: n = 10; EAE: n = 9) and three stacks of 10–12 images were taken for each brain section. All sections counted were close to midline. In every analysis, the same areas from EAE and control mice were assessed. Size threshold range was determined by sampling puncta from various animals and averaging both upper and lower threshold limits: minimum size (0.816 μm2) and maximum size (3.264 μm2). This range was then used to filter for size throughout the experiment. The number of puncta in each optical image was averaged across z-stack, brain section and animal to attain a composite average of presynaptic puncta in different group conditions. The experimenter was blind to group conditions throughout the analyses.
Cell Counts
Cerebral cortex neurons were quantified by counting NeuN+ cell bodies in 10X confocal images of the cerebral cortex containing the motor and somatosensory regions. Dehydration in chromogen-stained sections does not permit many z-planes to be available, so we counted neurons in a projected image. Three to five brain sections (50 μm thick) 200 μm apart were analyzed from each animal (normal: n = 8; control: n = 10; EAE: n = 9). All sections counted were close to midline. In every analysis, the same areas from EAE and control mice were assessed. Only cells with their entire nucleus present in the section were counted. The experimenter was blind to group conditions throughout the analyses.
Statistics
Global and regional brain volume changes in EAE mice and control animals were compared with repeated measures ANOVAs using PASW (SPSS Inc., Chicago, IL). If Mauchly’s test indicated that the assumption of sphericity had been violated (p < 0.05), then the degrees of freedom were corrected using the Huynh-Feldt estimates of sphericity. Regression analysis and Welch’s t-tests were performed in Excel 2004 (Microsoft, Redmond, WA). All results are presented as mean ± SEM.
Results
In Vivo Gray Matter Atrophy
Whole brain volumes of both healthy controls and mice with EAE were plotted against the disease duration (starting with the scans prior to disease induction) (Fig. 3A). In order to quantify the significance of the decreases in whole brain volume observed in individual animals, a repeated-measures ANOVA was performed to assess the effect of time on whole brain volume in mice with EAE. Brain volume remained stable over time in control animals but showed a gradual decrease in the EAE group (time x group interaction p = 0.001). The volume of the whole brain of mice eighty days after disease induction (d80) was 493 mm3 (3.8 mm3) in healthy controls and 473 mm3 (5.6 mm3) in mice with EAE indicating a 4.0% decrease (p = 0.006) in volume. Whole brain volumes of each mouse with EAE were then plotted against the disease duration. All of the mice with EAE demonstrated a decrease in whole brain volume as disease progressed, although the individual decreases in volume progressed differently in each animal (Fig. 3B). These results demonstrate that whole brain volume decreases over time in mice with EAE, although the rate of the atrophy varies from mouse to mouse.
Fig. 3.

Progressive Gray Matter Atrophy In Vivo. (A) A graph of the mean whole brain volume in healthy controls (solid line) and mice with EAE (dashed line) at d0, d20, d40 and d80 plotted against disease duration. (B) A graph of whole brain volume of each individual mouse with EAE measured using in vivo MRI at d0, d20, d40 and d80 plotted against disease duration. (C) Dot plot of the decrease in volume of whole brain of mice with EAE from d0 to d80 plotted against the cumulative disease score did not demonstrate a significant correlation (y = −0.12x + 1.3, R2 = 0.27, n = 9, p = 0.2). (D) A graph of the mean cerebral cortex volume in healthy controls (solid line) and mice with EAE (dashed line) at d0, d20, d40 and d80 plotted against disease duration. (E) A graph of cerebral cortex volume of each individual mouse with EAE measured using in vivo MRI at d0, d20, d40 and d80 plotted against disease duration. (F) Dot plot of the decrease in volume of the cerebral cortex of mice with EAE from d0 to d80 plotted against the cumulative disease score did not demonstrate any correlation (y = −0.0049x − 2.6, R2 = 0.02, n = 9, p = 0.7). (G) A graph of the mean whole cerebellar volume in healthy controls (solid line) and mice with EAE (dashed line) at d0, d20, d40 and d80 plotted against disease duration. (H) A graph of whole cerebellum volume of each individual mouse with EAE measured using in vivo MRI at d0, d20, d40 and d80 plotted against disease duration. (I) Dot plot of the decrease in volume of the cerebellum from d0 to d80 plotted against the cumulative disease score demonstrated a very strong correlation (y = −0.058 + 5.6, R2 = 0.67, n = 9, p = 0.007). (J) A graph of the mean olfactory bulb volume in healthy controls (solid line) and mice with EAE (dashed line) at d0, d20, d40 and d80 plotted against disease duration. (K) A graph of olfactory bulb volume of each individual mouse with EAE measured using in vivo MRI at d0, d20, d40 and d80 plotted against disease duration. Individual disease courses are represented as lines of differing colors. Each color represents a single animal and is used consistently.
Cerebral cortex volumes of healthy controls and mice with EAE were plotted against disease duration and a similar pattern was observed (Fig. 3C). Cerebral cortex volumes were stable in the control group while gradually decreasing in EAE animals (time x group interaction p = 0.002). The volume of the cerebral cortex at eighty days after disease induction (d80) was 72.5 mm3 (0.5 mm3) in healthy controls and 68.9 mm3 (0.8 mm3) in mice with EAE indicating a 5.0% decrease (p = 0.002) in volume. Cerebral cortex volumes of each mouse with EAE were also plotted against disease duration and individual decreases in volume progressed differently in each animal (Fig. 3D). These results show that cerebral cortex volume decreases over time in mice with EAE, although the rate of the atrophy varies from mouse to mouse.
Similarly, a progressive loss of cerebellar volume during EAE was observed (time x group interaction p = 0.004) (Fig. 3E). The volume of the whole cerebellum at eighty days after disease induction (d80) was 53.8 mm3 (1.0 mm3) in healthy controls and 48.2 mm3 (0.8 mm3) in mice with EAE, indicating a 10.4% decrease (p = 0.0002) in volume. Again, when cerebellar volume was plotted against disease duration in mice with EAE, volume decreases over time were observed (Fig. 3F). These results were consistent with our previous work using ex vivo MRI (MacKenzie-Graham et al., 2006; MacKenzie-Graham et al., 2009) and demonstrated that whole cerebellar volume decreases over time in mice with EAE, although the rate of the atrophy varies from mouse to mouse.
To ascertain if the volume decreases observed were localized or the result of a more generalized phenomenon such as dehydration, the volume of a control structure, the olfactory bulb, from both controls and mice with EAE was plotted against the disease duration (Fig. 3G). The mice with EAE did not demonstrate any appreciable change in olfactory bulb volume as disease progressed (time x group interaction p = 0.6). Mice with EAE did not exhibit a consistent decrease in volume over time (Fig. 3H) as had been observed in other anatomical structures. This data shows that the decreases in volume are localized.
Disease and Atrophy
We were interested in seeing if there was a relationship between the severity of disease and the amount of atrophy, so a regression analysis was performed to determine if cumulative disease score correlated with the decrease in volume at d80 in whole brain, cerebral cortex and cerebellum. Interestingly, there was no significant correlation between cumulative disease score and volume change in whole brain (y = −0.12x + 1.3, R2 = 0.27, n = 9, p = 0.2) (Fig. 3C) or cerebral cortex (y = −0.0049x − 2.6, R2 = 0.02, n = 9, p = 0.7) (Fig. 3F). However, there was a very strong correlation between the cumulative disease score and the decrease in volume of the cerebellum (y = −0.058 + 5.6, R2 = 0.67, n = 9, p = 0.007) (Fig. 3I).
Ex Vivo Gray Matter Atrophy
After in vivo MRI, the mice were sacrificed and MR imaged ex vivo. We found a significant reduction in whole brain volume in mice with EAE compared to controls (Fig. 4A). The volume of the brain in control mice had mean of 490 ± 3.3 mm3. Mice with EAE had a mean brain volume of 478 ± 4.1 mm3. This reflected a 2.4% decrease in brain volume (p = 0.02). We did not find a significant reduction in cerebral cortex volume in mice with EAE compared to controls (Fig. 4B). The volume of the cerebral cortex in control mice had mean of 71.6 ± 0.62 mm3. Mice with EAE had a mean cerebral cortex volume of 70.9 ± 0.78 mm3. Consistent with the literature (MacKenzie-Graham et al., 2006; MacKenzie-Graham et al., 2009), we found a significant reduction in cerebellar volume in mice with EAE compared to controls (Fig. 4C). The volume of the cerebellum in control mice had mean of 53.1 ± 0.4 mm3. Mice with EAE had a mean cerebellar volume of 50.6 ± 1.0 mm3. This reflected a 4.7% decrease in cerebellar volume (p = 0.02). We did not find a significant reduction in olfactory bulb volume in mice with EAE compared to controls (Fig. 4D). The volume of the olfactory bulb in control mice had mean of 14.9 ± 0.2 mm3. Mice with EAE had a mean cerebral cortex volume of 14.7 ± 0.2 mm3. These data suggest that in vivo assessment of gray matter atrophy in the cerebral cortex may be more sensitive than ex vivo measurements.
Fig. 4.
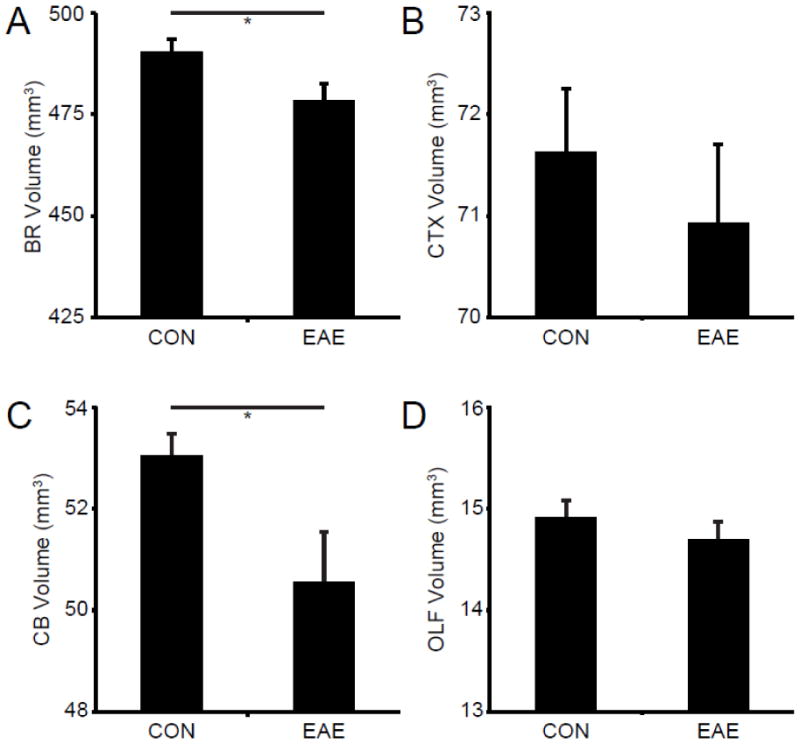
Gray Matter Atrophy Ex Vivo. (A) A graph of the mean whole brain volume in healthy controls (CON) and mice with EAE (EAE) ex vivo at d80. (B) A graph of the mean cerebral cortex volume in healthy controls and mice with EAE ex vivo at d80. (C) A graph of the mean whole cerebellar volume in healthy controls and mice with EAE ex vivo at d80. (D) A graph of the mean olfactory bulb volume in healthy controls and mice with EAE ex vivo at d80. Asterisks indicate significance (* p < 0.05).
EAE in the cerebral cortex
Previous work by our group has described cortical gray matter and callosal white matter demyelinating lesions in mice with this model of EAE (Mangiardi et al., 2010). Mice with EAE showed demyelination, inflammation, and synaptic protein decreases. Furthermore, inflammatory demyelinating lesions and axon degeneration were also described in the corpus callosum. In order to investigate the etiology of the atrophy we observed in vivo with MRI, we sectioned the tissue derived from the mice scanned and evaluated myelin and cytoskeletal integrity, synaptic protein expression, and neuronal number. Demyelination was readily observed in the cerebral cortex of mice with EAE (Fig. 5).
Fig. 5.
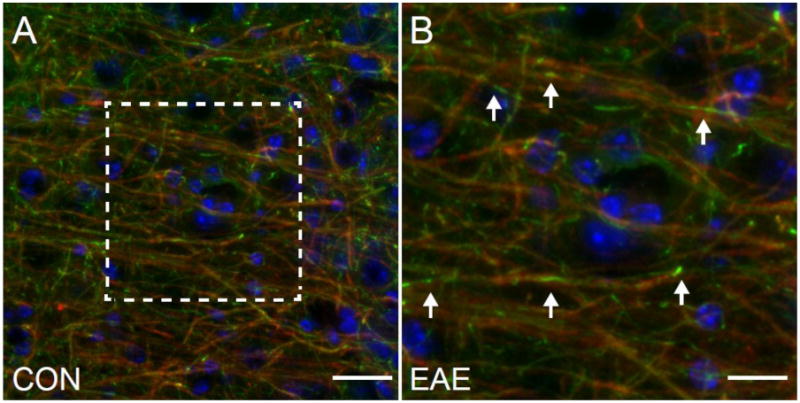
Demyelination in the Cerebral Cortex in EAE. (A) An MBP (red)/NF200 (green)/DAPI (blue) immunostained confocal image at 40X magnification in the cerebral cortex of a mouse with EAE (d80). Scale bar = 25 um. (B) Image magnification of the boxed area in A. Arrows indicate the sites of localized demyelination. Scale bar = 12.5 um.
Myelin and Cytoskeletal Integrity
We have previously demonstrated pathological correlates of gray matter atrophy in the cerebella of mice with EAE (MacKenzie-Graham et al., 2009). Once we had established that gray matter atrophy was occurring in the cerebral cortices of mice with EAE, we looked for pathological correlates in tissue collected from the mice that had been MR imaged. First we stained tissue with antibodies to myelin basic protein (MBP) to assess the state of myelin and captured confocal images using the same acquisition parameters. We observed decreased myelin staining density in the cerebral white matter (data not shown) and in the cerebral cortex (Fig. 6B) of mice with EAE compared to healthy controls (Fig. 6A). To verify our results we used the Gallyas silver stain for myelin. Once again we observed decreased myelin density in the cerebral white matter (data not shown) and in the cerebral cortex (Fig. 6C) of mice with EAE compared to healthy controls (Fig. 6D).
Fig. 6.
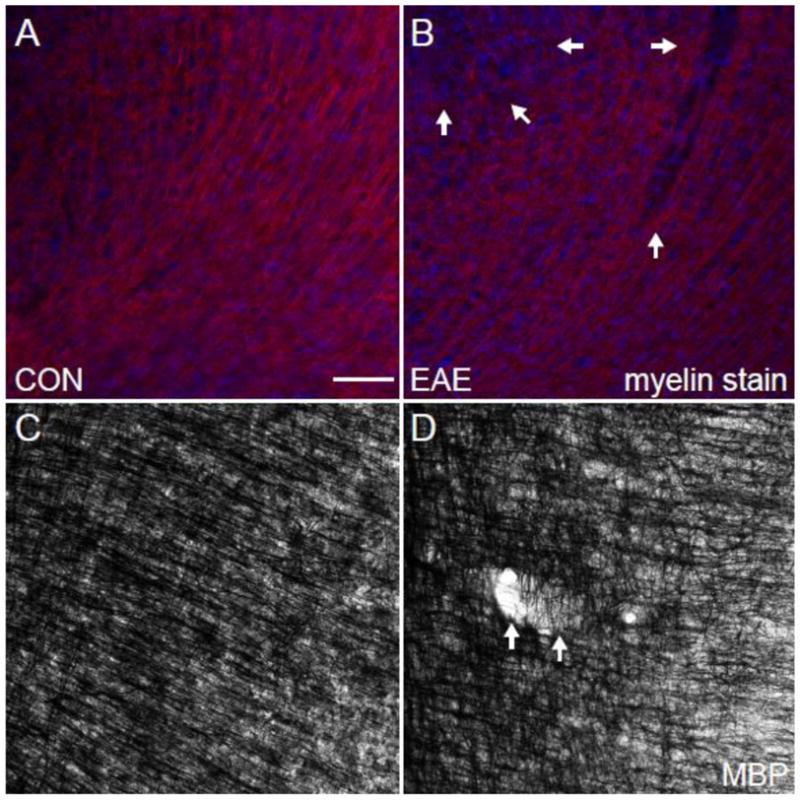
Myelin in the Cerebral Cortex in EAE. (A) An MBP (red)/DAPI (blue) immunostained confocal image at 10X magnification in the cerebral cortex of a healthy control mouse. (B) An MBP (red)/DAPI (blue) immunostained confocal image at 10X magnification in the cerebral cortex of a mouse with EAE (d80). (C) A Myelin-stained bright field image at 10X magnification in the cerebral cortex of a healthy control mouse. (D) A Myelin-stained brightfield confocal image at 10X magnification in the cerebral cortex of a mouse with EAE (d80). Arrows indicate the sites of cortical lesions. Scale bar = 100 um.
One possible neuropathological correlate of cortical atrophy is a disruption of the cellular cytoskeleton, both axonal projections and dendritic arborization. To address this possibility we stained the tissue with antibodies to beta-3 tubulin and neurofilament (NF200) and acquired confocal images using similar acquisition parameters. We observed decreased beta-3 tubulin staining density in the cerebral cortex (Fig. 7B) of mice with EAE compared to healthy controls (Fig. 7A). We also observed decreased neurofilament staining density in the cerebral cortex (Fig. 7D) of mice with EAE compared to healthy controls (Fig. 7C). These findings are consistent with previous studies (Mangiardi et al., 2010; Ziehn et al., 2010).
Fig. 7.
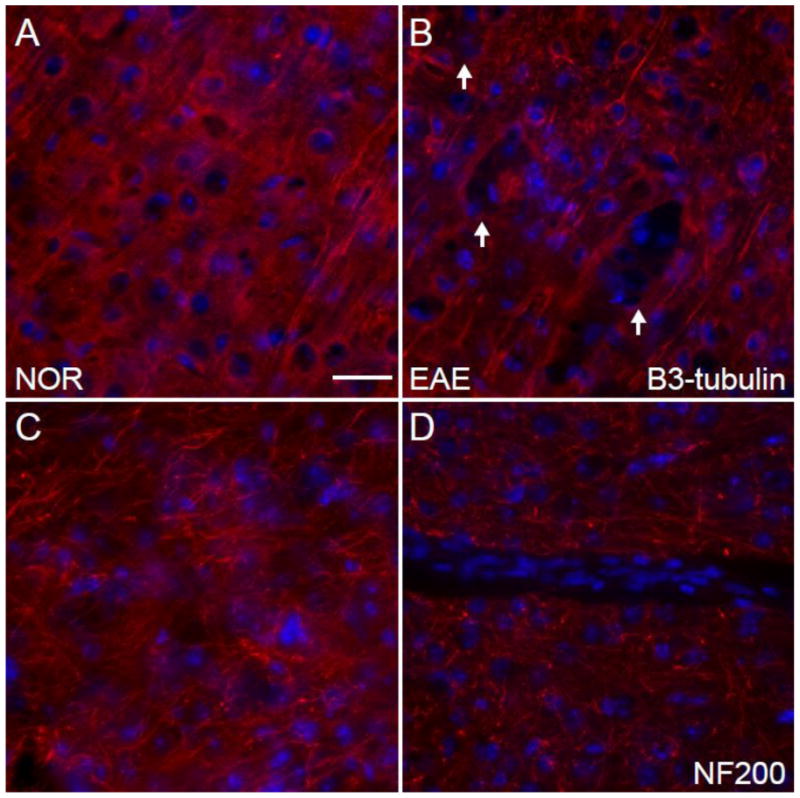
Cytoskeleton in the Cerebral Cortex in EAE. (A) A beta-3 tubulin (red)/DAPI (blue) immunostained confocal image at 10X magnification in the cerebral cortex of a healthy control mouse. (B) A beta-3 tubulin (red)/DAPI (blue) immunostained confocal image at 10X magnification in the cerebral cortex of a mouse with EAE (d80). (C) An NF200 (red)/DAPI (blue) immunostained confocal image at 10X magnification in the cerebral cortex of a healthy control mouse. (D) An NF200 (red)/DAPI (blue) immunostained confocal image at 10X magnification in the cerebral cortex of a mouse with EAE (d80). Scale bar = 100 um.
Synapses
Atrophy of the cerebral cortex in mice with EAE may be due to the loss of synapses. To assess the level of synaptic protein expression we stained the tissue with antibodies to synapsin-1 and acquired confocal images using similar acquisition parameters. We observed decreased synapsin-1 puncta density in the cerebral cortex (Fig. 8B) of mice with EAE compared to healthy controls (Fig. 8A). These findings are consistent with previous studies (Mangiardi et al., 2010; Ziehn et al., 2010).
Fig. 8.
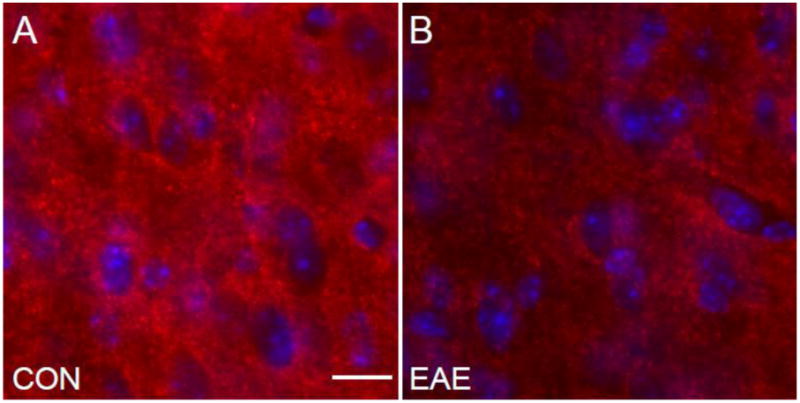
Synapses in the Cerebral Cortex in EAE. (A) A synapsin-1 (red)/DAPI (blue) immunostained confocal image at 60X magnification in the cerebral cortex of a healthy control mouse. (B) A synapsin-1 (red)/DAPI (blue) immunostained confocal image at 60X magnification in the cerebral cortex of a mouse with EAE (d80). Scale bar = 17 um.
Neuronal Number
Our previous studies have demonstrated a strong correlation between gray matter atrophy in the cerebellum and Purkinje cell loss in mice with EAE (MacKenzie-Graham et al., 2009). Thus, we hypothesized that neuronal loss in the cerebral cortex would correlate strongly with gray matter atrophy in that structure. To address this possibility we stained the tissue with antibodies to NeuN and acquired confocal images using the same acquisition parameters. We observed decreased NeuN+ cell density in the cerebral cortex (Fig. 9B) of mice with EAE compared to healthy controls (Fig. 9A). To verify our results we performed chromogen immunohistochemistry for NeuN. Once again we observed decreased NeuN+ cell density in the cerebral cortex (Fig. 9C) of mice with EAE compared to healthy controls (Fig. 9D).
Fig. 9.
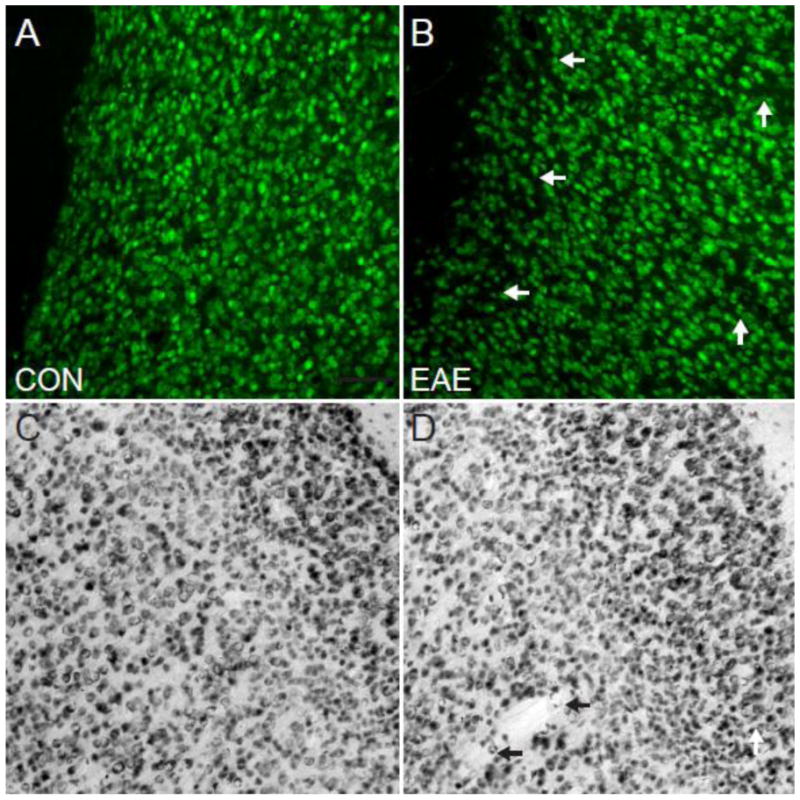
Neurons in the Cerebral Cortex in EAE. (A) A NeuN chromogen-stained brightfield image at 10X magnification in the cerebral cortex of a healthy control mouse. (B) A NeuN chromogen-stained brightfield image at 10X magnification in the cerebral cortex of a mouse with EAE (d80). (C) A NeuN (red)/DAPI (blue) immunostained confocal image at 10X magnification in the cerebral cortex of a healthy control mouse. (D) A NeuN (red)/DAPI (blue) immunostained confocal image at 10X magnification in the cerebral cortex of a mouse with EAE (d80). Arrows indicate the sites of cortical lesions. Scale bar = 100 um.
Correlations with Cortical Volume
Our previous studies have demonstrated a strong correlation between gray matter atrophy in the cerebellum and Purkinje cell loss in mice with EAE (MacKenzie-Graham et al., 2009). We performed regression analyses to determine which histological finding correlated most strongly with cortical atrophy. Regression analysis demonstrated that MBP staining density in the cerebral cortex had a direct correlation with the volume of the cerebral cortex (y = 0.39 + 64, R2 = 0.47, n = 9, p = 0.043) (Fig. 10A). These data indicate that myelin loss is associated with gray matter atrophy in the cerebral cortex of mice with MOG-induced EAE. Regression analysis demonstrated that NF200 staining density in the cerebral cortex had a direct correlation with the volume of the cerebral cortex (y = 0.18 + 55, R2 = 0.45, n = 9, p = 0.046) (Fig. 10B). These data indicate that neurofilament staining density decreases are associated with gray matter atrophy in the cerebral cortex of mice with MOG-induced EAE. Regression analysis demonstrated that synapsin-1 puncta density in the cerebral cortex had a strong correlation with the volume of the cerebral cortex (y = 0.00024 + 53, R2 = 0.53, n = 9, p = 0.026) (Fig. 10C). These data indicate that synapse density loss is associated with gray matter atrophy in the cerebral cortex of mice with MOG-induced EAE. Regression analysis demonstrated that NeuN+ cell density in the cerebral cortex had a very strong correlation with the volume of the cerebral cortex (y = 0.0067 + 32, R2 = 0.62, n = 9, p = 0.012) (Fig. 10D). These data indicate that neuronal numbers correlated most strongly with gray matter atrophy in the cerebral cortex of mice with MOG-induced EAE.
Fig. 10.
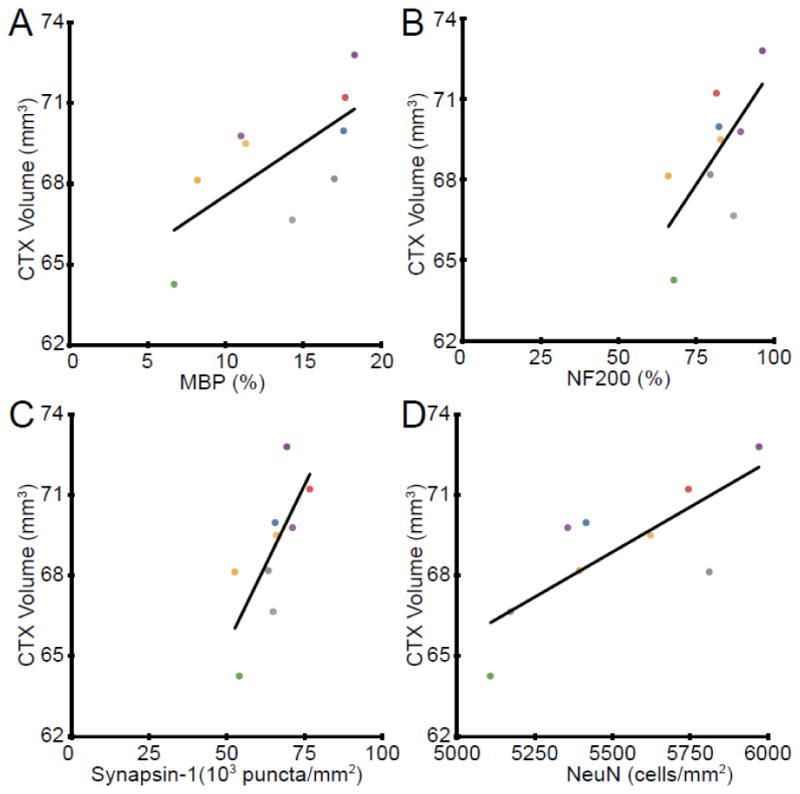
Correlations with Cerebral Volume. (A) Dot plot of the cerebral cortex (CTX) volume plotted against MBP staining density in the cerebral cortex demonstrated a direct correlation (y = 0.39 + 64, R2 = 0.47, n = 9, p = 0.043). (B) Dot plot of the cerebral cortex volume plotted against NF200 staining density in the cerebral cortex demonstrated a direct correlation (y = 0.18 + 55, R2 = 0.45, n = 9, p = 0.046). (C) Dot plot of the cerebral cortex (CTX) volume plotted against Synapsin-1 puncta density in the cerebral cortex demonstrated a direct correlation (y = 0.00024 + 53, R2 = 0.53, n = 9, p = 0.026). (D) Dot plot of the cerebral cortex (CTX) volume plotted against NeuN+ cell density in the cerebral cortex demonstrated a direct correlation (y = 0.0067 + 32, R2 = 0.62, n = 9, p = 0.012). Each color represents a single animal and is used consistently.
Discussion
MS is an inflammatory, demyelinating disease of the CNS that results in damage to myelin, oligodendrocytes, axons and neurons. Inflammation, demyelination and neurodegeneration are intimately tied together (Geurts and Barkhof, 2008) and increasingly sophisticated imaging and analysis techniques are making it possible to determine precisely where and when it occurs. Here we have demonstrated that, in the most widely used model for MS, we can visualize progressive loss of gray matter in the cerebral cortex in vivo. Cross modality correlation demonstrated a direct correlation between myelin, neurofilament, synaptic density and neuronal number with gray matter atrophy in the cerebral cortices of mice with EAE.
Gray matter atrophy is detectable from the earliest stages of MS, particularly in the cerebral cortex (De Stefano et al., 2003) and progresses relentlessly during the course of disease (De Stefano et al., 2010). Atrophy measures have been particularly useful in extending our understanding of the relationship between brain structure and cognition in MS. Cortical atrophy has been found in cognitively impaired MS patients and this was significantly correlated with lower performance on tests of attention/concentration and verbal fluency (Amato et al., 2004; Amato et al., 2007; Amato et al., 2008). In addition to atrophy visualized by MRI, cortical pathology in MS has also begun to be studied widely (Siffrin et al., 2010). Neocortical lesions are common in patients with MS and cortical thinning of approximately 10% has been reported (Wegner et al., 2006). Our finding of cortical atrophy in EAE is timely since recent work shows lesions in cortex in EAE mice similar in distribution to MS lesions (Mangiardi et al., 2010). These lesions were characterized by neuronal loss and synaptic stripping in the setting of T lymphocytes and activated microglia. Our findings are consistent with this earlier work. Cortical lesions and atrophy have been widely described in the MS literature. Our data using the MS model demonstrate that cortical lesions and atrophy can occur when an immune response to a myelin peptide attacks an otherwise normal CNS.
Here we report progressive atrophy in whole brain, cerebral cortex and whole cerebellum during the course of disease. We have previously reported that there was no atrophy observed in the cerebral cortex of mice with EAE compared to healthy controls using ex vivo MRI (MacKenzie-Graham et al., 2006). We reiterate this ex vivo finding in this report, which may appear to be at odds with our in vivo findings. Our in vivo analysis has the added benefit of being able to observe the brain in homeostatic conditions. As such, the brains scanned exhibited full ventricles and anatomical structures that border them had not expanded into the partially drained ventricles when blood pressure (and consequently cerebrospinal fluid (CSF) pressure) dropped upon death. Additionally, our ex vivo brains contained differing amounts of CSF trapped inside the ventricles, complicating alignments and the comparison of structures that border them. Further, we noted in this study that individual animals exhibit different levels of atrophy at each time point. This inherent variability in the progression of atrophy during disease decreases the significance of comparisons made to normal controls in a cross-sectional ex vivo study. The ability to evaluate atrophy in the context of individual mice using in vivo MRI was an extremely powerful tool for visualizing these decreases over time, especially since the first evaluation was prior to disease induction. In this experimental design the first time-point (d0) is effectively a control for later measurements. The use of repeated measures also increased the statistical power of our findings. Using this longitudinal approach we observed that all mice with EAE demonstrate a progressive decrease in cerebral cortex volume over time.
We have demonstrated that there was no direct correlation between cumulative disease score and atrophy in whole brain, cerebral cortex and olfactory bulb, even though there was a very strong correlation between cumulative disease score and the decrease in cerebellar volume at d80. This is probably due to the fact that standard EAE clinical disease scores are principally a measure of coordination, sensory and motor ability. This suggests that not all atrophy is equal and some regions are more vulnerable and clinically relevant than others. This finding is consistent with human studies demonstrating a correlation between cerebellar or infratentorial atrophy and cerebellar functional subscales (Calabrese et al., 2010; Edwards et al., 1999; Liu et al., 1999). We hypothesize that a cognitive evaluation independent of motor function may correlate with cerebral cortex atrophy.
T2 hyperintensities were observed in the white matter of the cerebellum at d20 in mice with EAE, consistent with previous findings in ex vivo mouse brains (MacKenzie-Graham et al., 2006). However, the lower resolution and signal-to-noise in this in vivo acquisition prevented a systematic assessment of lesion burden. Future studies will include improved in vivo image acquisition to assay the relationship between localized lesion burden and gray matter atrophy.
A recently published study by Pirko, et al. demonstrated brain atrophy, inferred from ventricular volume measurements in the Theiler’s murine encephalitis virus (TMEV) model of MS. Consistent with our findings, this inferred atrophy correlated strongly with clinical disability (Pirko et al., 2010).
Examination of the pathological correlates of gray matter atrophy in the cerebral cortex showed strong correlations with myelin levels, neurofilament levels, synaptic density and neuronal number. These findings are consistent with previous work that has demonstrated decreases in all these measures in EAE (Mangiardi et al., 2010; Pomeroy et al., 2008, 2010; Ziehn et al., 2010). Interestingly, synaptic density and neuronal number demonstrated the strongest correlation with gray matter atrophy in the cerebral cortex, but only neuronal number remained statistically significant after the application of the Bonferroni correction for multiple comparisons. This is consistent with our findings that Purkinje cell number was inversely proportional to gray matter atrophy in the cerebellar cortex (MacKenzie-Graham et al., 2009).
Conclusions
In summary, we have demonstrated for the first time that atrophy of the cerebral cortex occurs progressively in vivo during autoimmune mediated demyelination. Understanding the progression of disease will permit the future design of rational neuroprotective strategies to prevent gray matter atrophy and disability accumulation during EAE, and possibly MS. This is the first report of progressive cortical atrophy in vivo in a mouse model of MS, but the methodology is applicable to any neurological disease with a neurodegenerative component. In vivo imaging is more sensitive to changes that occur in neurodegenerative disease models where disease progression varies from one animal to another. This model can now be used as a tool to further discern the mechanisms leading to cortical atrophy as well as to screen treatments to prevent it.
Acknowledgments
This work was generously supported by the National Multiple Sclerosis Society (NMSS) grant FG 1759A1/1 (AMG), NMSS grant RG 4033 (RRV) and NIH K24 NS062117 (RRV) as well as funds from the Skirball Foundation, the Hilton Foundation and the Sherak Family Foundation. Dr. Mackenzie-Graham would like to acknowledge Dr. John Mazziotta for his continued advice and support.
Footnotes
Publisher's Disclaimer: This is a PDF file of an unedited manuscript that has been accepted for publication. As a service to our customers we are providing this early version of the manuscript. The manuscript will undergo copyediting, typesetting, and review of the resulting proof before it is published in its final citable form. Please note that during the production process errors may be discovered which could affect the content, and all legal disclaimers that apply to the journal pertain.
References
- Ahrens ET, Laidlaw DH, Readhead C, Brosnan CF, Fraser SE, Jacobs RE. MR microscopy of transgenic mice that spontaneously acquire experimental allergic encephalomyelitis. Magnetic Resonance in Medicine. 1998;40:119–132. doi: 10.1002/mrm.1910400117. [DOI] [PubMed] [Google Scholar]
- Amato MP, Bartolozzi ML, Zipoli V, Portaccio E, Mortilla M, Guidi L, Siracusa G, Sorbi S, Federico A, De Stefano N. Neocortical volume decrease in relapsing-remitting MS patients with mild cognitive impairment. Neurology. 2004;63:89–93. doi: 10.1212/01.wnl.0000129544.79539.d5. [DOI] [PubMed] [Google Scholar]
- Amato MP, Portaccio E, Goretti B, Zipoli V, Battaglini M, Bartolozzi ML, Stromillo ML, Guidi L, Siracusa G, Sorbi S, Federico A, De Stefano N. Association of neocortical volume changes with cognitive deterioration in relapsing-remitting multiple sclerosis. Arch Neurol. 2007;64:1157–1161. doi: 10.1001/archneur.64.8.1157. [DOI] [PubMed] [Google Scholar]
- Amato MP, Portaccio E, Stromillo ML, Goretti B, Zipoli V, Siracusa G, Battaglini M, Giorgio A, Bartolozzi ML, Guidi L, Sorbi S, Federico A, De Stefano N. Cognitive assessment and quantitative magnetic resonance metrics can help to identify benign multiple sclerosis. Neurology. 2008;71:632–638. doi: 10.1212/01.wnl.0000324621.58447.00. [DOI] [PubMed] [Google Scholar]
- Badea A, Ali-Sharief AA, Johnson GA. Morphometric analysis of the C57BL/6J mouse brain. Neuroimage. 2007;37:683–693. doi: 10.1016/j.neuroimage.2007.05.046. [DOI] [PMC free article] [PubMed] [Google Scholar]
- Bermel RA, Bakshi R. The measurement and clinical relevance of brain atrophy in multiple sclerosis. Lancet Neurol. 2006;5:158–170. doi: 10.1016/S1474-4422(06)70349-0. [DOI] [PubMed] [Google Scholar]
- Bock NA, Kovacevic N, Lipina TV, Roder JC, Ackerman SL, Henkelman RM. In vivo magnetic resonance imaging and semiautomated image analysis extend the brain phenotype for cdf/cdf mice. Journal of Neuroscience. 2006;26:4455–4459. doi: 10.1523/JNEUROSCI.5438-05.2006. [DOI] [PMC free article] [PubMed] [Google Scholar]
- Borg J, Chereul E. Differential MRI patterns of brain atrophy in double or single transgenic mice for APP and/or SOD. Journal of Neuroscience Research. 2008;86:3275–3284. doi: 10.1002/jnr.21778. [DOI] [PubMed] [Google Scholar]
- Budde MD, Kim JH, Liang HF, Russell JH, Cross AH, Song SK. Axonal injury detected by in vivo diffusion tensor imaging correlates with neurological disability in a mouse model of multiple sclerosis. NMR Biomed. 2008;21:589–597. doi: 10.1002/nbm.1229. [DOI] [PMC free article] [PubMed] [Google Scholar]
- Calabrese M, Mattisi I, Rinaldi F, Favaretto A, Atzori M, Bernardi V, Barachino L, Romualdi C, Rinaldi L, Perini P, Gallo P. Magnetic resonance evidence of cerebellar cortical pathology in multiple sclerosis. Journal of Neurology, Neurosurgery and Psychiatry. 2010;81:401–404. doi: 10.1136/jnnp.2009.177733. [DOI] [PubMed] [Google Scholar]
- De Stefano N, Giorgio A, Battaglini M, Rovaris M, Sormani MP, Barkhof F, Korteweg T, Enzinger C, Fazekas F, Calabrese M, Dinacci D, Tedeschi G, Gass A, Montalban X, Rovira A, Thompson A, Comi G, Miller DH, Filippi M. Assessing brain atrophy rates in a large population of untreated multiple sclerosis subtypes. Neurology. 2010;74:1868–1876. doi: 10.1212/WNL.0b013e3181e24136. [DOI] [PubMed] [Google Scholar]
- De Stefano N, Matthews PM, Filippi M, Agosta F, De Luca M, Bartolozzi ML, Guidi L, Ghezzi A, Montanari E, Cifelli A, Federico A, Smith SM. Evidence of early cortical atrophy in MS: relevance to white matter changes and disability. Neurology. 2003;60:1157–1162. doi: 10.1212/01.wnl.0000055926.69643.03. [DOI] [PubMed] [Google Scholar]
- Delatour B, Guegan M, Volk A, Dhenain M. In vivo MRI and histological evaluation of brain atrophy in APP/PS1 transgenic mice. Neurobiol Aging. 2006;27:835–847. doi: 10.1016/j.neurobiolaging.2005.04.011. [DOI] [PubMed] [Google Scholar]
- Edwards SG, Gong QY, Liu C, Zvartau ME, Jaspan T, Roberts N, Blumhardt LD. Infratentorial atrophy on magnetic resonance imaging and disability in multiple sclerosis. Brain. 1999;122 (Pt 2):291–301. doi: 10.1093/brain/122.2.291. [DOI] [PubMed] [Google Scholar]
- Fisher E, Rudick RA, Simon JH, Cutter G, Baier M, Lee JC, Miller D, Weinstock-Guttman B, Mass MK, Dougherty DS, Simonian NA. Eight-year follow-up study of brain atrophy in patients with MS. Neurology. 2002;59:1412–1420. doi: 10.1212/01.wnl.0000036271.49066.06. [DOI] [PubMed] [Google Scholar]
- Franklin KBJ, Paxinos G. The Mouse Brain in Stereotaxic Coordinates. 3. Academic Press; New York: 2008. [Google Scholar]
- Gallyas F. Silver staining of myelin by means of physical development. Neurological Research. 1979;1:203–209. doi: 10.1080/01616412.1979.11739553. [DOI] [PubMed] [Google Scholar]
- Geurts JJ, Barkhof F. Grey matter pathology in multiple sclerosis. Lancet Neurol. 2008;7:841–851. doi: 10.1016/S1474-4422(08)70191-1. [DOI] [PubMed] [Google Scholar]
- Jacobs RE, Ahrens ET, Dickinson ME, Laidlaw D. Towards a microMRI atlas of mouse development. Computerized Medical Imaging and Graphics. 1999;23:15–24. doi: 10.1016/s0895-6111(98)00059-7. [DOI] [PubMed] [Google Scholar]
- Kovacevic N, Henderson JT, Chan E, Lifshitz N, Bishop J, Evans AC, Henkelman RM, Chen XJ. A three-dimensional MRI atlas of the mouse brain with estimates of the average and variability. Cerebral Cortex. 2005;15:639–645. doi: 10.1093/cercor/bhh165. [DOI] [PubMed] [Google Scholar]
- Lau JC, Lerch JP, Sled JG, Henkelman RM, Evans AC, Bedell BJ. Longitudinal neuroanatomical changes determined by deformation-based morphometry in a mouse model of Alzheimer’s disease. Neuroimage. 2008;42:19–27. doi: 10.1016/j.neuroimage.2008.04.252. [DOI] [PubMed] [Google Scholar]
- Levy H, Assaf Y, Frenkel D. Characterization of brain lesions in a mouse model of progressive multiple sclerosis. Exp Neurol. 2010 doi: 10.1016/j.expneurol.2010.08.017. [DOI] [PubMed] [Google Scholar]
- Liu C, Edwards S, Gong Q, Roberts N, Blumhardt LD. Three dimensional MRI estimates of brain and spinal cord atrophy in multiple sclerosis. Journal of Neurology, Neurosurgery and Psychiatry. 1999;66:323–330. doi: 10.1136/jnnp.66.3.323. [DOI] [PMC free article] [PubMed] [Google Scholar]
- Liu HB, Loo KK, Palaszynski K, Ashouri J, Lubahn DB, Voskuhl RR. Estrogen receptor alpha mediates estrogen’s immune protection in autoimmune disease. J Immunol. 2003;171:6936–6940. doi: 10.4049/jimmunol.171.12.6936. [DOI] [PubMed] [Google Scholar]
- Ma Y, Hof PR, Grant SC, Blackband SJ, Bennett R, Slatest L, McGuigan MD, Benveniste H. A three-dimensional digital atlas database of the adult C57BL/6J mouse brain by magnetic resonance microscopy. Neuroscience. 2005;135:1203–1215. doi: 10.1016/j.neuroscience.2005.07.014. [DOI] [PubMed] [Google Scholar]
- MacKenzie-Graham A, Lee EF, Dinov ID, Bota M, Shattuck DW, Ruffins S, Yuan H, Konstantinidis F, Pitiot A, Ding Y, Hu G, Jacobs RE, Toga AW. A multimodal, multidimensional atlas of the C57BL/6J mouse brain. J Anat. 2004;204:93–102. doi: 10.1111/j.1469-7580.2004.00264.x. [DOI] [PMC free article] [PubMed] [Google Scholar]
- MacKenzie-Graham A, Tinsley MR, Shah KP, Aguilar C, Strickland LV, Boline J, Martin M, Morales L, Shattuck DW, Jacobs RE, Voskuhl RR, Toga AW. Cerebellar cortical atrophy in experimental autoimmune encephalomyelitis. Neuroimage. 2006;32:1016–1023. doi: 10.1016/j.neuroimage.2006.05.006. [DOI] [PubMed] [Google Scholar]
- MacKenzie-Graham A, Tiwari-Woodruff SK, Sharma G, Aguilar C, Vo KT, Strickland LV, Morales L, Fubara B, Martin M, Jacobs RE, Johnson GA, Toga AW, Voskuhl RR. Purkinje cell loss in experimental autoimmune encephalomyelitis. Neuroimage. 2009;48:637–651. doi: 10.1016/j.neuroimage.2009.06.073. [DOI] [PMC free article] [PubMed] [Google Scholar]
- Mangiardi M, Crawford DK, Xia X, Du S, Simon-Freeman R, Voskuhl RR, Tiwari-Woodruff SK. An Animal Model of Cortical and Callosal Pathology in Multiple Sclerosis. Brain Pathol. 2010 doi: 10.1111/j.1750-3639.2010.00444.x. [DOI] [PMC free article] [PubMed] [Google Scholar]
- Miller DH, Barkhof F, Frank JA, Parker GJ, Thompson AJ. Measurement of atrophy in multiple sclerosis: pathological basis, methodological aspects and clinical relevance. Brain. 2002;125:1676–1695. doi: 10.1093/brain/awf177. [DOI] [PubMed] [Google Scholar]
- Morrissey SP, Stodal H, Zettl U, Simonis C, Jung S, Kiefer R, Lassmann H, Hartung HP, Haase A, Toyka KV. In vivo MRI and its histological correlates in acute adoptive transfer experimental allergic encephalomyelitis. Quantification of inflammation and oedema. Brain. 1996;119 (Pt 1):239–248. doi: 10.1093/brain/119.1.239. [DOI] [PubMed] [Google Scholar]
- Peterson LK, Fujinami RS. Inflammation, demyelination, neurodegeneration and neuroprotection in the pathogenesis of multiple sclerosis. J Neuroimmunol. 2007;184:37–44. doi: 10.1016/j.jneuroim.2006.11.015. [DOI] [PMC free article] [PubMed] [Google Scholar]
- Pettinelli CB, McFarlin DE. Adoptive transfer of experimental allergic encephalomyelitis in SJL/J mice after in vitro activation of lymph node cells by myelin basic protein: requirement for Lyt 1+ 2- T lymphocytes. J Immunol. 1981;127:1420–1423. [PubMed] [Google Scholar]
- Pirko I, Johnson AJ, Chen Y, Lindquist DM, Lohrey AK, Ying J, Dunn RS. Brain atrophy correlates with functional outcome in a murine model of multiple sclerosis. Neuroimage. 2010 doi: 10.1016/j.neuroimage.2010.08.055. [DOI] [PMC free article] [PubMed] [Google Scholar]
- Pirko I, Nolan TK, Holland SK, Johnson AJ. Multiple sclerosis: pathogenesis and MR imaging features of T1 hypointensities in a [corrected] murine model. Radiology. 2008;246:790–795. doi: 10.1148/radiol.2463070338. [DOI] [PubMed] [Google Scholar]
- Pomeroy IM, Jordan EK, Frank JA, Matthews PM, Esiri MM. Diffuse cortical atrophy in a marmoset model of multiple sclerosis. Neuroscience Letters. 2008;437:121–124. doi: 10.1016/j.neulet.2008.03.069. [DOI] [PMC free article] [PubMed] [Google Scholar]
- Pomeroy IM, Jordan EK, Frank JA, Matthews PM, Esiri MM. Focal and diffuse cortical degenerative changes in a marmoset model of multiple sclerosis. Mult Scler. 2010;16:537–548. doi: 10.1177/1352458509360362. [DOI] [PMC free article] [PubMed] [Google Scholar]
- Rex DE, Ma JQ, Toga AW. The LONI Pipeline Processing Environment. Neuroimage. 2003;19:1033–1048. doi: 10.1016/s1053-8119(03)00185-x. [DOI] [PubMed] [Google Scholar]
- Rudick RA, Fisher E, Lee JC, Simon J, Jacobs L. Use of the brain parenchymal fraction to measure whole brain atrophy in relapsing-remitting MS. Multiple Sclerosis Collaborative Research Group. Neurology. 1999;53:1698–1704. doi: 10.1212/wnl.53.8.1698. [DOI] [PubMed] [Google Scholar]
- Shattuck DW, Leahy RM. Automated graph-based analysis and correction of cortical volume topology. IEEE Trans Med Imaging. 2001;20:1167–1177. doi: 10.1109/42.963819. [DOI] [PubMed] [Google Scholar]
- Siffrin V, Vogt J, Radbruch H, Nitsch R, Zipp F. Multiple sclerosis - candidate mechanisms underlying CNS atrophy. Trends in Neurosciences. 2010;33:202–210. doi: 10.1016/j.tins.2010.01.002. [DOI] [PubMed] [Google Scholar]
- Sled JG, Zijdenbos AP, Evans AC. A nonparametric method for automatic correction of intensity nonuniformity in MRI data. IEEE Trans Med Imaging. 1998;17:87–97. doi: 10.1109/42.668698. [DOI] [PubMed] [Google Scholar]
- Suen WE, Bergman CM, Hjelmstrom P, Ruddle NH. A critical role for lymphotoxin in experimental allergic encephalomyelitis. J Exp Med. 1997;186:1233–1240. doi: 10.1084/jem.186.8.1233. [DOI] [PMC free article] [PubMed] [Google Scholar]
- Trapp BD, Ransohoff R, Rudick R. Axonal pathology in multiple sclerosis: relationship to neurologic disability. Curr Opin Neurol. 1999;12:295–302. doi: 10.1097/00019052-199906000-00008. [DOI] [PubMed] [Google Scholar]
- Wegner C, Esiri MM, Chance SA, Palace J, Matthews PM. Neocortical neuronal, synaptic, and glial loss in multiple sclerosis. Neurology. 2006;67:960–967. doi: 10.1212/01.wnl.0000237551.26858.39. [DOI] [PubMed] [Google Scholar]
- Woods RP, Grafton ST, Holmes CJ, Cherry SR, Mazziotta JC. Automated image registration: I. General methods and intrasubject, intramodality validation. Journal of Computer Assisted Tomography. 1998a;22:139–152. doi: 10.1097/00004728-199801000-00027. [DOI] [PubMed] [Google Scholar]
- Woods RP, Grafton ST, Watson JD, Sicotte NL, Mazziotta JC. Automated image registration: II. Intersubject validation of linear and nonlinear models. Journal of Computer Assisted Tomography. 1998b;22:153–165. doi: 10.1097/00004728-199801000-00028. [DOI] [PubMed] [Google Scholar]
- Wuerfel J, Tysiak E, Prozorovski T, Smyth M, Mueller S, Schnorr J, Taupitz M, Zipp F. Mouse model mimics multiple sclerosis in the clinico-radiological paradox. Eur J Neurosci. 2007;26:190–198. doi: 10.1111/j.1460-9568.2007.05644.x. [DOI] [PubMed] [Google Scholar]
- Zhang J, Peng Q, Li Q, Jahanshad N, Hou Z, Jiang M, Masuda N, Langbehn DR, Miller MI, Mori S, Ross CA, Duan W. Longitudinal characterization of brain atrophy of a Huntington’s disease mouse model by automated morphological analyses of magnetic resonance images. Neuroimage. 2010;49:2340–2351. doi: 10.1016/j.neuroimage.2009.10.027. [DOI] [PMC free article] [PubMed] [Google Scholar]
- Ziehn MO, Avedisian AA, Tiwari-Woodruff S, Voskuhl RR. Hippocampal CA1 atrophy and synaptic loss during experimental autoimmune encephalomyelitis, EAE. Lab Invest. 2010;90:774–786. doi: 10.1038/labinvest.2010.6. [DOI] [PMC free article] [PubMed] [Google Scholar]
- Zivadinov R, Bakshi R. Central nervous system atrophy and clinical status in multiple sclerosis. J Neuroimaging. 2004a;14:27S–35S. doi: 10.1177/1051228404266266. [DOI] [PubMed] [Google Scholar]
- Zivadinov R, Bakshi R. Role of MRI in multiple sclerosis II: brain and spinal cord atrophy. Front Biosci. 2004b;9:647–664. doi: 10.2741/1262. [DOI] [PubMed] [Google Scholar]