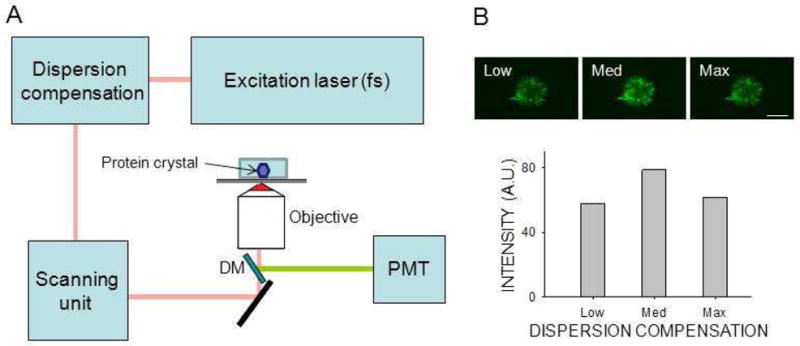
Figure 1.

Crystal detection by non–linear imaging. Non–linear images were obtained with a Leica TCS SP2 in an epi configuration equipped with galvanometer driven scanners. (A) Diagram of the system. Infrared light from a tunable pulsed femtosecond (fs) laser was pre–compensated to minimize the impact of system dispersion. Incident light was focused on the sample with a high NA objective. The non–linear signal from the sample was collected by PMT without de–scanning, after separation of excitation light by a dichroic mirror (DM). (B) Top row: two–photon excitation images of protein crystals in mesophase obtained at three different dispersion compensation settings. Bottom row: Non–linear signal intensity is shown as a function of dispersion compensation. Optimal dispersion compensation setting increased the signal by 36 %. Scale bar: 150 μm.
