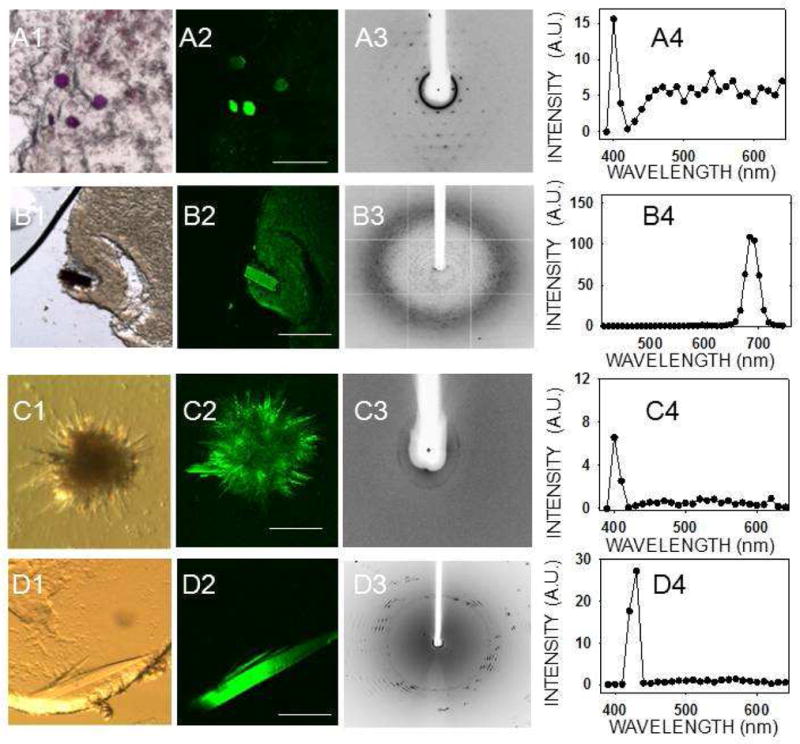
Figure 2.

TPM imaging of membrane protein crystals in mesophase. Bright field image (1), TPM image (2), X–ray diffraction image (3) and two–photon–excited emission spectrum (4) of membrane protein crystals in mesophase. (A) Bacteriorhodopsin, (B) RC crystals, and both (C) and (D) are 5-HT4R crystals grown from mesophase trials. Spectra in (A4) and (C4) were recorded with 810 nm and those in (B4) and (D4) with 850 nm excitation. Scale bars are 150 μm in (A2), (C2), and (D2) and 300 μm in (B2).
