

Abstract
The ability to recognize the behavioral significance, or category membership, of sensory stimuli is critical for interpreting the meaning of events in our environment. Prior neurophysiological studies of visual categorization found categorical representations of stimuli in prefrontal cortex (PFC), an area closely associated with cognitive and executive functions. Recent studies have also identified neuronal category signals in parietal areas typically associated with visual-spatial processing. It has been proposed that category-related signals in parietal cortex and other visual areas may result from “top-down” feedback from PFC. We directly compared neuronal activity in the lateral intraparietal (LIP) area and PFC in monkeys performing a visual motion categorization task. Here we show that LIP shows stronger, more reliable, and shorter latency category signals than PFC. This suggests that LIP is strongly involved in visual categorization, and argues against the idea that parietal category signals arise from feedback from PFC during this task.
The ability to make binary categorical decisions about continuously varying sensory stimuli, such as whether a piece of fruit is “ripe” or “unripe” or whether a baseball pitch is a “ball” or “strike”, is critical for selecting appropriate behavioral responses and is observed in a wide range of animals including insects1, birds2, non-human primates2,3,4,5, and humans6. Neurophysiological studies have identified neuronal representations that reflect the category membership of stimuli5,7,8 or abstract encoding of task rules9 in the prefrontal cortex (PFC), an area closely associated with higher cognitive and executive functions. Neuronal category10,11 and rule signals12 have also been observed in posterior parietal areas most often associated with visual-spatial processing related to attention and saccadic eye movements. In a recent study, monkeys were trained to group 360° of motion directions into two 180°-wide categories. After training, activity in the lateral intraparietal (LIP) area showed strong category encoding—neuronal responses were very similar for stimuli in the same category and differed sharply between stimuli in opposite categories. In contrast, neurons in the middle temporal (MT) area, a key motion processing area13 that provides input to LIP14, were strongly direction selective but their activity did not reflect the learned categories.
How are feature representations in early visual areas transformed into abstract and experience-dependent representations like those observed in LIP and PFC? It has been proposed that decisions about the category membership or abstract significance of stimuli may be generated in PFC, and that PFC could be a source for such representations observed in earlier visual areas7,12,15,16,17 including LIP and inferior temporal cortex. Alternatively, category signals could be generated in brain areas such as LIP that are more closely connected with earlier sensory processing areas14.
We directly compared the activity of LIP and PFC neurons in two monkeys trained to perform a visual category-matching task in which a set of continuously varying motion directions were divided into two categories by a learned category boundary. We found that, while both areas showed a clear and significant encoding of the learned categories, category effects in LIP were stronger, more reliable, and appeared with a shorter latency than PFC. Furthermore, LIP showed a closer coupling with the monkeys’ trial-by-trial decisions about the category of “ambiguous” stimuli with directions on the category boundary. Together, these results suggest that LIP category signals are unlikely to originate in PFC during this task, and that parietal cortex plays a central role in visual categorization and category-based decision making.
Results
Delayed match-to-category task
We trained two monkeys to group 360° of motion directions into two categories defined by a learned category boundary10 (Fig. 1a). During neurophysiological recordings, six evenly spaced motion directions were used as sample and test stimuli in addition to two directions that were on the category boundary and had ambiguous category membership (Fig 1a). Monkeys performed a delayed match-to-category (DMC) task (Fig. 1b) in which a sample stimulus (650 ms) was followed by a memory delay (1,000 ms) and a test stimulus (650 ms). The monkeys had to release a manual touch-bar if the test was a category match to the sample. If the test was a non-match (on 50% of trials), it was followed by an additional delay (150 ms) and a second test stimulus (650 ms) that was always a category match to the sample and required a lever release. Advantages of this task are that the monkeys’ motor responses indicated “match” and were not rigidly associated with either category, and could not be planned until the appearance of the test stimulus.
Figure 1. Delayed match-to-category (DMC) task.
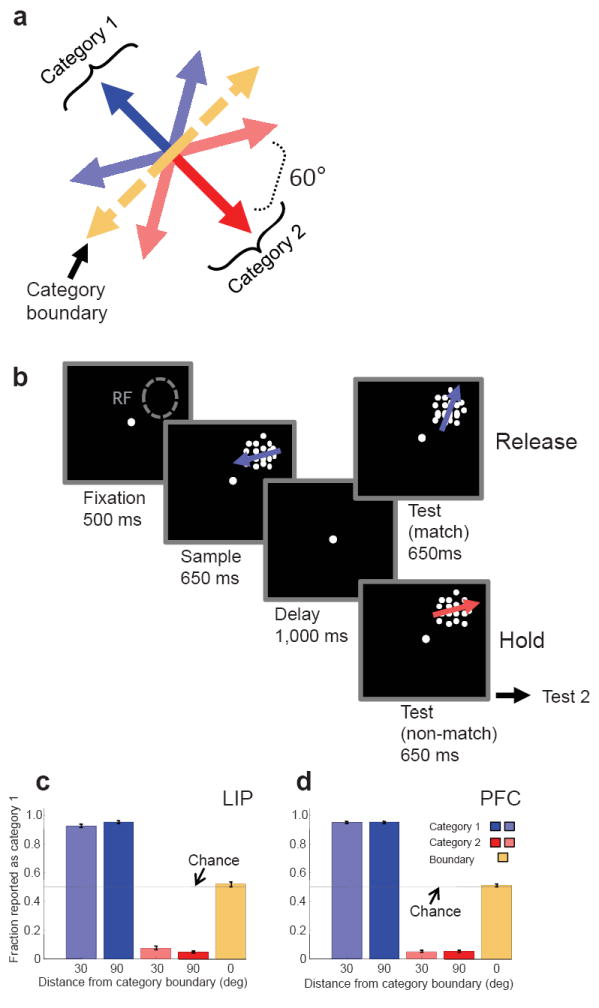
(a) Monkeys grouped 6 motion directions into two categories (corresponding to the red and blue arrows) separated by a learned “category boundary”. Two additional directions were shown as sample stimuli that were on the category boundary and had ambiguous category membership (the two yellow arrows). (b) Monkeys performed a delayed match-to-category (DMC) task, and had to indicate (by releasing a lever) whether sample and test stimuli were in the same category. “RF” indicates the position of a neuron’s receptive field. (c,d) The monkeys’ average categorization performance (proportion of directions classified as C1) during LIP (c) and PFC (d) recordings is shown is shown as a function of distance from the category boundary.
During recordings, the monkeys correctly categorized each of the six directions of sample stimuli with greater than 90% accuracy, and performed at chance (50%) for the two directions that were on the category boundary (Fig. 1c,d). The monkeys’ accuracies and reaction times were very similar for the two categories and during LIP and PFC recordings sessions (Table 1 and Fig. 1c,d). We conducted LIP and PFC recordings conducted after the animals were fully trained, and recording sessions from the two areas were interleaved (see Supplemental Info). Thus, any differences between LIP and PFC activity are unlikely to be related to differences in behavioral performance or amount of training.
Table 1. Behavioral performance of each monkey during LIP and PFC recordings.
Accuracy does not include on-boundary directions, and excludes fixation breaks. Reaction times are shown for correct trials where test stimulus #1 was a category match. The standard deviation of all values is shown in parentheses.
| Monkey B | Monkey J | |
|---|---|---|
| Accuracy LIP (% correct) | 93% (5%) | 96% (4%) |
| Accuracy PFC (% correct) | 92% (4%) | 97% (3%) |
| Reaction Time LIP (ms) | 237 ms (31 ms) | 287 ms (42 ms) |
| Reaction Time PFC (ms) | 225 ms (30 ms) | 281 ms (44 ms) |
Single neuron activity in LIP and PFC
We recorded from 76 LIP (Monkey B: N=32; Monkey J: N=44) and 447 PFC (Monkey B: N=205; Monkey J: N=242) neurons during DMC task performance. MRI images showing the locations of LIP and PFC recording chambers appear in Supp. Fig. 1. Many neurons showed activity that reflected the learned categories in both LIP (# of category selective neurons: Sample, N=44/76; Delay, N=50/76; Test, N=42/76) and PFC (Sample: N=90/447, Delay: N=89/447, Test: N=84/447) according to an unpaired T-Test (P<0.01) which compared activity to the two categories, and the fraction of selective neurons was greater in LIP than PFC in all three task epochs (Chi Square Test, P<0.0001 in all epochs). Many neurons in both areas showed binary-like category selectivity in that they responded strongly and uniformly to the three directions in their preferred category and had uniformly weaker responses to directions in the non-preferred category (Fig. 2).
Figure 2. Examples of category selective LIP and PFC neurons.

The responses of three LIP (a–c) and three PFC (d–f) neurons are shown. The red and blue traces indicate the three directions in category 1 and category 2, respectively. The pale red and blue traces represent directions closer to the category boundary, and the dark traces represent directions in the center of each category. Each neuron shows a tendency for strong selectivity for sample category during the sample, delay and/or test epochs. Data is shown only for correct trials.
Comparing category selectivity strength in LIP and PFC
The strength and reliability of neuronal category encoding were quantified using two complementary techniques. The first is an ROC-based analysis which, for each neuron, measured the degree of overlap in neuronal responses to the two categories across all trials (see Methods). ROC values could vary from 1.0 (very strong selectivity) to 0.5 (no selectivity), and indicate the reliability with which an ideal observer could read out category information given a neuron’s firing rate on a single trial. Average fixation period ROC values greater than 0.5 are expected because raw ROC values (which can vary from 0.0 to 1.0) are rectified about 0.5, and this does not indicate any neuronal bias or anticipatory category signals (see Methods). The second technique is a category-tuning index (CTI) which tests the influence of the category boundary on average neuronal firing rates (averaged across trials for each direction), by computing the difference in firing rates between pairs of directions that are in the same vs. different categories5,10,17 (see Methods). The CTI can vary from 1.0 (strong category selectivity) to -1.0 (no activity difference between categories and a large difference within categories), and indicates the difference in firing rate between vs. within categories but does not measure the reliability of neuronal category effects.
Because a different proportion of neurons in LIP and PFC were category selective, we focused the analysis on neuronal populations in each area that were selected by a common criterion—neurons that differentiated among the six sample directions during the sample, delay, and/or test epochs according to one-way analysis of variance (ANOVA comparing responses to the six directions) at P<0.01 (see Table 2). ROC and CTI values were significantly greater in all three task epochs compared to the same neurons during the fixation epoch in LIP (Fig. 3; paired T-Test, P<0.0005 in all three epochs) and PFC (Fig. 3; paired T-Test, P<10 −7 in all three epochs). Furthermore, category selectivity was significantly stronger in LIP than PFC during all three task epochs according to the ROC analysis (Fig. 3a; LIP vs. PFC Wilcoxon rank sum test, Sample: P = 0.005; Delay: P = 0.018; Test: P = 0.002; Supp. Fig.2). This suggests that the strength of category encoding, in terms of the ability to read out the sample category from neuronal activity on a trial-by-trial basis, is significantly stronger in LIP than in PFC. The CTI also revealed significantly stronger category-selectivity in LIP than PFC during the test-epoch (Fig 3b; Supp. Fig. 3; rank sum test, P = 0.003), and a non-significant trend toward stronger selectivity in LIP than PFC during the sample (rank sum test, P = 0.296) and delay (rank sum test, P = 0.124).
Table 2. Incidence of direction selectivity and category selectivity in PFC and LIP.
The values below indicate the number (or percentage) of neurons significant at P<0.01.
| Sample | Delay | Test | Any Epoch (# of Neurons) | |
|---|---|---|---|---|
| LIP (N=76) | ||||
| Direction-selective (One-way ANOVA across 6 directions) | 54 (71%) | 50 (66%) | 33 (43%) | 67 (88%) |
| Category selective (T-Test, C1 vs. C2) | 44 (58%) | 50 (66%) | 42 (55%) | 66 (87%) |
| PFC (N=447) | ||||
| Direction-selective (One-way ANOVA across 6 directions) | 87 (19%) | 84 (19%) | 65 (15%) | 155 (35%) |
| Category selective (T-Test, C1 vs. C2) | 90 (20%) | 89 (20%) | 84 (19%) | 174 (39%) |
Figure 3. Strength of category selectivity across LIP and PFC populations.
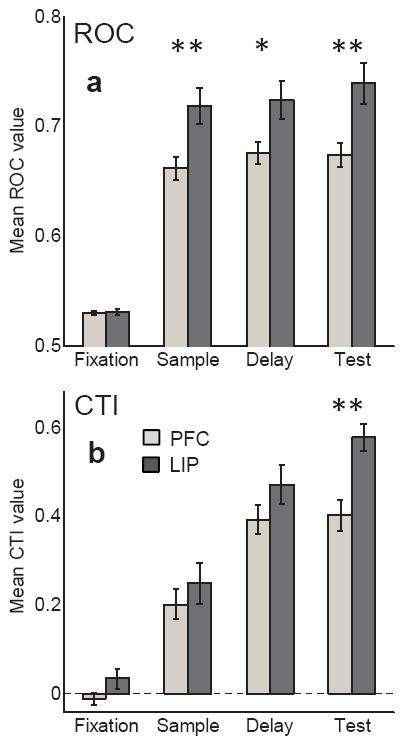
The strength of category selectivity was measured using (a) ROC and (b) CTI analysis. ROC values for individual neurons could vary from 0.5 to 1.0. Average fixation period ROC values greater than 0.5 are expected because raw ROC values (which can vary from 0.0 to 1.0) are rectified about 0.5, and this does not indicate any neuronal bias or anticipatory category signals (see Methods). CTI values could vary from −1.0 to 1.0. For both measures, greater positive values indicate stronger category selectivity, and mean values are shown for LIP (dark gray) and PFC (light gray) across all direction selective (according to one-way ANOVA) neurons in each epoch. During the fixation epoch, ROC and CTI values are shown for neurons that were direction selective in any epoch. Error bars indicate the standard error of the mean. Asterisks denote the level of significance of T-Test (LIP vs. PFC) significance (* = P<0.05; ** = P<0.01).
Comparing the timing of category signals in LIP and PFC
We examined the time-course of category selectivity in each brain area using “sliding” versions of the ROC and CTI (see Methods) applied to the neural populations that were direction selective (one-way ANOVA across the six sample directions, P<0.01) in the sample, delay, and/or test epochs (LIP: N=67/76; PFC: N=155/447). Interestingly, both selectivity measures show that category selectivity appeared with a shorter latency in LIP than PFC following the onset of the sample (Fig. 4) stimulus. We quantified the latency of category selectivity for each LIP and PFC neuron by evaluating the time at which the ROC or CTI crossed an arbitrary threshold (3.0 standard deviations above the mean value during the fixation epoch for 2 consecutive time bins) in the early sample period (the initial 500 ms of sample presentation; see Methods). Across all neurons for which a latency was defined (i.e. the selectivity threshold was crossed at some point during the early sample period), category selectivity emerged significantly earlier in LIP (ROC: mean = 112 ms; CTI: mean = 153 ms) than PFC (ROC: mean = 185 ms; CTI: mean = 226 ms) according to a Wilcoxon rank sum test (ROC: P = 0.00001; CTI: P = 0.002; Fig. 4).
Figure 4. Time-course of LIP and PFC category selectivity.

The time-course of category selectivity across direction-selective LIP and PFC populations was determined by “sliding” ROC (a) and CTI (c) analyses. The shaded gray area around the solid traces (the mean ROC or CTI value) indicates the standard error of the mean. Average fixation period ROC values greater than 0.5 are expected because raw ROC values (which can vary from 0.0 to 1.0) are rectified about 0.5, and this does not indicate any neuronal bias or anticipatory category signals (see Methods). (b,d) Cumulative latency distributions, across all neurons that showed significant category selectivity prior to 500 ms after sample onset according to (b) ROC (LIP: N = 62; PFC: N = 243) and (d) CTI (LIP: N = 39; PFC: N = 181) analysis, shows the fraction of LIP and PFC neurons that had become category selective by each time-point. (e,f) Scatter plots show the relationship between category selectivity strength and category selectivity latency for LIP (e) and PFC (f) neurons. (g,h) Scatter plots show the relationship between firing rate and category selectivity latency for LIP (g) and PFC (h) neurons. For panels e–h, linear regression fits are indicated by the dotted line.
One concern is that the observed latency difference between LIP and PFC could be related to differences in the strength of category selectivity or firing rates between the two areas (see Supp. Fig. 4). For example, neurons with higher firing rates or stronger selectivity might show shorter-latency effects. However, this seemed unlikely in this study since neurons with weak selectivity or low firing rates sometimes showed short-latency selectivity, and vice versa (Fig. 4e–h; Supp. Fig. 5). To examine this issue directly, we employed a general linear model to conduct an analysis of covariance (ANCOVA). This approach allows the statistical significance of an effect of interest (e.g. the difference in latency between LIP and PFC) to be determined while accounting for the variance from multiple co-varying factors (e.g. strength of category selectivity and strength of firing rate of each neuron). We applied the ANCOVA separately to both the ROC and CTI latency results (i.e. the same results and neuronal populations shown in Figs. 4b,d), and found that in both cases there was a significant main effect of brain area (ANCOVA with latency as the dependent variable and selectivity strength and firing rate as covariates, LIP vs. PFC, ROC: P = 0.0039; CTI: P = 0.0052) indicating that the difference in latency between LIP and PFC is very unlikely to be related to differences in firing rate or selectivity strength. We obtained similar results using a different analysis approach in which we compared the latencies of neuronal sub-populations with equal firing rates or strengths of selectivity (see Supp. Fig. 6 and Supplemental Information).
Decision-related responses to ambiguous stimuli
We examined whether neuronal category representations can reflect the monkeys’ trial-by-trial categorization decisions about stimuli with ambiguous category membership by examining the responses of 66 LIP and 324 PFC neurons that were tested with two sample directions that were on the category boundary (i.e. the two yellow arrows on Fig. 1a; see Methods and Supplemental Information). A number of neurons in LIP and PFC which were category selective for the non-ambiguous sample directions also reflected the monkeys’ classifications of the ambiguous sample directions (Fig. 5a–d). However, category signals for the ambiguous stimuli were, on average, stronger and more consistent in LIP than PFC. For each neuron that was direction selective (ANOVA on 6 sample directions, P<0.01) in each epoch on non-ambiguous trials, we calculated the category 1 (C1) vs. category 2 (C2) ROC value on ambiguous trials (sorted according to the monkeys’ behavioral report on each trial). ROC values near 0.0 and 1.0 indicate a strong preference for C1 and C2, respectively. We then separated neurons by whether they preferred C1 or C2 on non-ambiguous trials to determine whether they showed consistent category preferences on ambiguous and non-ambiguous trials (Figs. 5e,f). Across the population, LIP showed strong and reliable category selectivity for the ambiguous stimuli which agreed with neurons’ category preferences for non-ambiguous directions during the sample (Fig. 5e; Mean ROC value: C1=0.45, C2=0.53; T-Test, P=0.031) and delay (C1=0.43, C2=0.60; T-Test, P=0.000016) epochs, and a non-significant trend in the test (C1=0.48, C2=0.60; T-Test, P=0.058) epoch. In contrast, the PFC population showed only a weak and non-significant trend toward reflecting the monkeys’ classifications of ambiguous stimuli during the sample (Fig. 5f; Mean ROC value: C1=0.48, C2=0.50; C1 vs. C2 T-Test, P=0.251), delay (C1=0.49, C2=0.51; T-Test, P=0.296), and test (C1=0.47, C2=0.52; T-Test, P=0.058) epochs. Distributions of ROC values for individual direction selective LIP and PFC neurons are shown in Supplemental Fig. 7. ROC values on ambiguous trials were also computed as a percentage of those observed on non-ambiguous trials. Across the same populations shown in Fig. 5e and 5f, ROC-value percentages were greater in LIP than PFC during the sample (LIP: 18.4%; PFC: 8.9%), delay (LIP: 39.4%; PFC: 7.1%), and test (LIP: 22.5%; PFC: 14.2%) epochs. Thus, in addition to showing stronger and shorter latency category selectivity, LIP also shows a more reliable encoding of the monkeys’ trial-by-trial classifications of ambiguous stimuli.
Figure 5. Neuronal activity to on-boundary directions with ambiguous category membership.

(a–d) Examples of single LIP (a–b) and PFC (c–d) neurons to ambiguous sample directions (solid red and blue traces, activity sorted according to monkeys’ reports of category membership on each trial) and non-ambiguous directions (dotted red and blue traces, activity averaged across the three directions in each category). (e,f) Population average category selectivity (ROC) on ambiguous trials is shown for LIP (e) and PFC (f). Neurons are sorted according to whether they preferred Category 1 (blue) or Category 2 (red) on non-ambiguous trials. ROC values of 0.0 and 1.0 indicate strong selectivity for Category 1 and Category 2, respectively. Error bars show the standard error of the mean.
Discussion
Prior work found that activity in area MT, a cortical area critically involved in visual motion processing13 which is directly interconnected with LIP14, showed strong direction tuning during the DMC task, but did not exhibit an obvious influence of the learned categories10. A long-term goal of our work is to understand how basic visual feature representations, like those in MT, are transformed by learning into more abstract representations as observed in LIP and PFC. Our current findings regarding the timing and strength of category selectivity suggest that category signals in LIP during the motion-DMC task are unlikely to arise via top-down inputs from PFC. One possibility is that direction tuning in MT is transformed into category tuning in LIP by learning-dependent changes in the direct synaptic connections between MT and LIP10,18. Alternatively, this transformation may involve multiple interconnected processing stages in and around the parietal cortex including the medial superior temporal19, ventral intraparietal20,21, and 7a12,22 areas. Thus, additional studies will be needed in the future to understand the relative roles of LIP and other interconnected parietal areas.
Studies of visual-shape categorization compared activity in PFC and inferior temporal cortex (ITC) and found strong category signals in PFC, while ITC neurons typically showed stronger shape and/or feature tuning and much weaker category effects. As we observed in both PFC and LIP in the present study, many PFC neurons in our prior shape-categorization studies showed strong category selectivity that was almost “binary”. In contrast, even the ITC neurons that showed the strongest category selectivity also showed a greater degree of variability among stimuli in each category, consistent with neurons showing an influence of both the category boundary and tuning for stimulus features7. ITC only showed strong binary-like category signals about the sample stimulus during the test period, which was very late in the trial (> 1.0 sec following sample onset) 7. Together, these results suggested that ITC was unlikely to be a source for such category signals to PFC and other areas.
Neuronal recordings in the present study were conducted once the monkeys were fully trained, so the roles of LIP and PFC during the learning process are unclear. One possibility is that PFC may be more involved during earlier stages of categorization training, and strong category effects in LIP might emerge only after the monkeys have completed the learning process. This is consistent with the idea that, as a task becomes more practiced and familiar, neuronal activation migrates away from areas more involved in executive control (such as PFC) and toward more posterior cortical areas (such as parietal or premotor cortex) or subcortical structures as task performance becomes less effortful and more automatic. However, strong category effects in LIP were evident after only 2–3 weeks of training on the motion-DMC task in a prior study10, suggesting that extremely long training durations (e.g. more than two weeks) are not required to observe LIP category signals. Whether category signals could develop over shorter time-scales (e.g. within a single training session) remains to be determined.
A related question concerns the roles of LIP and PFC during tasks using variable decision criteria or category boundaries. Such tasks are known to rely on PFC23, and studies using more dynamic tasks have found strong category or rule signals in PFC9,24 and the frontal eye fields8 which closely tracked the monkeys’ rapidly changing decision criteria. While LIP has not been directly tested during more dynamic categorization tasks, it is likely that LIP would reflect rapidly changing task rules or decision criteria for two reasons. First, our finding that LIP showed a stronger coupling than PFC with the monkeys’ trial-by-trial decisions about the category of ambiguous boundary-sample stimuli (Fig. 5) suggests that LIP direction tuning is not fixed, and can reflect the monkeys’ changing decision criteria. Second, a prior study12 found that activity in parietal area 7a reflected the rule required to solve a visual discrimination task when the rule was varied from trial to trial.
The strength of category signals in LIP and that they were observed in a majority of neurons raises a question about their relationship with well-known signals in LIP for spatial attention25 and eye movements26. Recent work has implicated the parietal cortex (including area LIP) in non-spatial cognitive processing27, including a recent study which showed that category signals are observed even when stimuli are presented outside LIP neurons’ receptive fields 17, suggesting an independent encoding of spatial and non-spatial factors. Although, it is unclear how spatial and non-spatial signals are combined in LIP and read-out by downstream areas.
A final question is to understand the relationship between the neuronal category signals observed in the present student and during other types of categorization and decision-making tasks. Category signals may be but one example of a more general “abstract framework” for decision making between discrete alternatives28. If so, neuronal category tuning might be closely related to decision-related signals observed in LIP during perceptual-decision tasks29, which recent results suggest are not necessarily tied to specific motor plans30. Finally, the generalized nature of LIP category encoding was underscored by recent work showing that motion category signals like those observed in the current study were also observed—often in the same neurons—for learned shape pairings11. The shape-pair and motion-category signals in LIP during that study appeared with a similar strength and time-course, suggesting that LIP’s role in visual categorization extends to tasks using both spatial and non-spatial visual stimuli. Together, these results suggest that parietal cortex, and LIP in particular, is an important processing stage for visual categorization and category-based decision making.
METHODS
Behavioral task and stimulus display
We trained monkeys to indicate whether a test stimulus was in the same category as a previously presented sample stimulus by releasing a lever. Stimuli were high contrast, 9.0° diameter random dot movies composed of 190 dots/frame which moved at 12°/sec with 100% coherence. Monkeys maintained gaze fixation within a 2.0° radius of a fixation point. Identical stimuli, timings, and rewards were used for PFC and LIP recordings and for the two monkeys.
Gaze positions were measuredusing an EyeLink 1000 optical eye tracker (SR Research Ltd., Ontario, Canada) at a sampling rate of 1.0 KHz and stored for offline analysis. Monkeylogic software (http://www.monkeylogic.net) was used to control task events, stimuli, rewards, and to monitor and store behavioral events31 Stimuli were displayed on a 21” color CRT monitor (1280x1024 resolution, 75 Hz, 57 cm viewing distance).
Electrophysiological recording
Two male monkeys (Macaca Mulatta, 8.0–10.0 kg) were implanted with a headpost and two recording chambers. Stereotaxic coordinates for chamber placement were determined from MRI images (Supp. Fig. 1). PFC chambers were centered on the principal sulcus and anterior to the arcuate sulcus, ~27.0 mm anterior to the intra-aural line. LIP chambers were positioned over the intraparietal sulcus (IPS) centered ~3.0 mm posterior to the intra-aural line. All procedures were in accordance with the University of Chicago’s Animal Care and Use Committee and National Institutes of Health guidelines.
LIP recordings were conducted using single 75 μm tungsten microelectrodes (FHC Inc, Bowdoin, ME), a dura piercing guide tube, and a Kopf (David Kopf Instruments, Tujunga, CA) hydraulic microdrive system. PFC recordings were made using 250 μm dura-piercing tungsten microelectrodes (FHC Inc, Bowdoin, ME) and a custom manual microdrive system which allowed simultaneous recordings from up to 16 electrodes. Neurophysiological signals were amplified, digitized, and stored for offline spike sorting (Plexon Inc, Dallas, TX) to verify the quality and stability of neuronal isolations (see Supplemental Information). Recordings were usually made from either LIP or PFC, though simultaneous recordings from both areas were made on a subset (N=5) of sessions.
Receptive field mapping and stimulus placement
PFC and IPS neurons were tested with a memory-saccade task. Most IPS (and some PFC) neurons were also tested with a sparse noise stimulus during passive fixation10,17. Neurons were considered to be in LIP if they showed spatially selective visual responses and/or delay activity during the memory-saccade task or were located between such neurons. Stimuli during the DMC task were always presented within LIP receptive fields. PFC and LIP neurons were not pre-screened for direction or category selectivity.
Slightly different approaches were used to map neurons’ receptive fields in LIP and PFC in an effort to maximize neuronal responses during the DMC task. Responses during the memory-saccade and sparse noise tasks were analyzed in real-time to estimate the position of LIP receptive fields and to guide DMC stimulus placement. The typical eccentricity of stimulus placement for LIP recordings was ~6.0° to 10.0°. PFC responses during the memory-saccade task were less effective in guiding DMC stimulus placement as PFC responses are often highly task dependent32. For most PFC recordings (N=55/86 sessions), sample and test stimuli were presented in blocks of 30 trials at three non-overlapping locations in the contralateral visual field centered 7.0° from fixation, which covered much of the contralateral visual field on the CRT. For the remaining PFC recording sessions (31/86), stimuli were shown at a single fixed location (7.0° from fixation along the horizontal axis in the contralateral visual field). For PFC data with stimuli shown at three locations, each neuron’s receptive field was defined as the location (of the three) which elicited the greatest average firing rate during the sample and delay, and only trials with stimuli at that location were used for subsequent analyses. Similar results were observed using only the one-location or three-location PFC datasets, or using PFC data for which stimuli were presented at the worst of the three locations.
Data analysis
The patterns of behavioral and neuronal results were similar and all main effects were observed in both monkeys. Thus the two datasets were combined for all population analyses. Firing rates were computed for each neuron in four time windows corresponding to the four phases of the task – fixation, sample, delay and test. The fixation epoch was a 500 ms window ending at sample onset. The sample epoch was a 650 ms window that began 80 ms after sample onset (to account for neuronal response latencies). The delay epoch was an 800 ms window beginning 300 ms following sample-offset, and the test epoch was 300 ms in duration beginning at test onset. The test epoch was necessarily shorter since the match trials ended with the monkey’s lever-release. For trials in which the sample was not on the category-boundary, neuronal activity was analyzed only on correct trials. For the trials in which the sample direction was on the category boundary, we analyzed neuronal activity for both rewarded and non-rewarded trials provided the monkey successfully maintained fixation.
The strength and time-course of category selectivity was evaluated using a receiver-operating characteristic (ROC) analysis33,34,7 and a category-tuning index (CTI). The ROC analysis was applied to the distribution of firing rates on each trial during each analysis epoch. The area under the ROC curve is a value between 0.0 and 1.0 indicating the performance of an ideal observer in assigning category membership based on each neuron’s trial-by-trial firing rates. Values of 0.0 and 1.0 correspond to strong selectivity (non-overlapping responses) for categories one and two, respectively. Values of 0.5 indicate complete overlap in the distributions of firing rates to the two categories (i.e. no category selectivity). Raw ROC values were rectified about 0.5, yielding values that varied from 0.5 (no selectivity) to 1.0 (strong selectivity for either category). Average fixation period ROC values greater than 0.5 are expected because of this rectification operation (e.g. a raw ROC value of 0.49 becomes 0.51 after the rectification), and this does not indicate any neuronal bias or anticipatory category signals. The CTI measured the difference in firing rate (averaged across all trials for each direction) for each neuron between pairs of directions in different categories (a between category difference or BCD) and the difference in activity between pairs of directions in the same category (a within category difference or WCD). The CTI was defined as the difference between BCD and WCD divided by their sum. Values of the index could vary from +1.0 (strong binary-like differences in activity to directions in the two categories) to −1.0 (large activity differences between directions in the same category, no difference between categories). A CTI value of 0.0 indicates the same difference in firing rate between and within categories.
The time-course of category selectivity was determined by computing the ROC or CTI using a 200 ms analysis window that was stepped in 10 ms intervals over the course of the trial. For each neuron, the latency of category selectivity was defined as the first time bin at which the mean fixation period ROC or CTI value was exceeded by 3.0 standard deviations for 2 consecutive time bins prior to 500 ms of after sample onset. Similar results were observed with various latency thresholds, window widths, and step-sizes.
On each boundary-sample trial, we inferred the monkeys’ category-assignment of the sample stimulus according to the category membership of the first test stimulus and whether the monkey released the lever during its presentation. Ambiguous-sample trials were then divided into two groups according to the monkeys’ report about the sample category (see Supplemental Information). Each neuron’s preferred category was determined by its average firing rate on non-ambiguous trials. To analyze the strength of category selectivity for the ambiguous-sample trials, we focused on neurons that were direction selective (according to a one-way ANOVA across six directions at P<0.01) on non-ambiguous trials. The raw ROC was computed separately for neurons that preferred category 1 or category 2 on non-ambiguous trials, giving ROC values that varied from 0.0 (strong selectivity for C1) to 1.0 (strong selectivity for C2). This analysis was applied separately to the sample, delay and test epochs.
Supplementary Material
Figure S1. Recording Locations. Anatomical MRI images show approximate locations of LIP (a) and PFC (b) recordings as indicated by the superimposed yellow arrows. LIP recordings targeted the lateral bank of the intraparietal sulcus approximately 1.0–7.0 mm posterior to the intra-aural line. PFC recordings were accessed via chambers centered over the principal sulcus and anterior to the arcuate sulcus, approximately 27 mm anterior from the intra-aural line. PFC recordings were focused on the cortex between the two arrows.
Figure S2. Distributions of ROC values across LIP and PFC populations. An ROC analysis measured the strength of category selectivity of individual neurons (see Methods). ROC values for individual neurons could vary from 0.5 (no selectivity) to 1.0 (perfect category selectivity). (a–h) The gray bars show index values across the population of direction selective (according to one-way ANOVA at P<0.01) LIP (a–d) and PFC (e–h) neurons in each epoch. During the fixation epoch (a,e), ROC values are shown for all direction selective neurons (in any epoch).
Figure S3. Distributions of category tuning index (CTI) values across LIP and PFC populations. A category tuning index was computed that measured the strength of category selectivity of individual neurons (see Methods). Positive values of the index indicate larger activity differences between categories and/or more similar activity within categories. The gray bars show index values across the populations of direction selective neurons (according to a one-way ANOVA at P<0.01) in LIP (a–d) and PFC (e–h) in each epoch. During the fixation epoch (a,e), CTI values are shown for all direction selective neurons (in any epoch).
Figure S4. Average firing rates across LIP and PFC populations. Traces show the average firing rates across all neurons that were direction selective (according to one-way ANOVA at P<0.01) during any epoch in (a) LIP (N=67) and (b) PFC (N=155) using a 35 ms smoothing window. The shaded gray area around the solid traces indicates the standard error of the mean.
Figure S5. Relationship of category selectivity latency with category selectivity strength and firing rate. (a,b) Scatter plots show the relationship between firing rate and category selectivity latency for LIP (a) and PFC (b) neurons using the category tuning index based latency measure. (c,d) Scatter plots show the relationship between category selectivity strength and category selectivity latency for LIP (c) and PFC (d) neurons using the category tuning index based measure. For panels a–d, linear regression fits are indicated by the dotted line.
Figure S6. Controls for the relationship of category selectivity latency with category selectivity strength and firing rate. (a,b) The ROC value and latency of category selectivity is shown for all neurons included in the ROC latency analysis described in the main manuscript. The black points indicate neurons that were excluded in the latency control analyses in the supplemental info. The populations of LIP (a) and PFC (b) neurons in red have the same average category index value. (c,d) The average firing rate (during 80–500 ms after sample onset) and latency of category selectivity is shown for all neurons included in the ROC latency analysis described in the main manuscript. The black points indicate neurons that were excluded in the latency control analyses in the supplementary info. The populations of LIP (c) and PFC (d) neurons in red have the same average firing rate.
Figure S7. Category selectivity on ambiguous boundary trials. Each point on the scatter plots indicates the ROC value (comparing activity on Category 1 and Category 2 trials) of an individual LIP (a) or PFC (b) neuron on ambiguous boundary trials during the sample, delay, or test epochs. ROC values of 0.0 and 1.0 indicate strong selectivity for Category 1 and Category 2, respectively, on ambiguous trials (sorted according to the monkeys’ classification on each trial). Neurons’ category preferences on non-ambiguous trials are indicated by the color of each point (blue=Category 1; red=Category 2). All direction selective neurons (according to a one-way ANOVA at P<0.01) in each epoch are shown. This is the same data used to compute the mean values shown in Figs. 5e,f.
Acknowledgments
We thank Steve McClellan for animal training and technical assistance, Gang Huang, Chris Rishel, and Stephanie Thomas, for technical assistance, and staff of The University of Chicago Animal Resources Center for expert veterinary assistance. We also thank the following for helpful discussions and/or comments on an earlier version of this manuscript: John Assad, Jamie Fitzgerald, Todd Herrington, Guilhem Ibos, Jillian McKee, Earl Miller, Chris Pack, Maximilian Riesenhuber, and Arup Sarma. This work was supported by NIH R01 EY019041. Additional support was provided by an NSF CAREER award, the Alfred P. Sloan Foundation, and The Brain Research Foundation.
Footnotes
Author Contributions: D.J.F and S.K.S. designed the experiments, analyzed the data, and wrote the manuscript. S.K.S. trained the animals and performed all neurophysiological recordings. D.J.F. assisted in animal training and neurophysiological recordings.
References
- 1.Wyttenbach RA, May ML, Hoy RR. Categorical perception of sound frequency by crickets. Science. 1996;273:1542–1544. doi: 10.1126/science.273.5281.1542. [DOI] [PubMed] [Google Scholar]
- 2.Roberts WA, Mazmanian DS. Concept learning at different levels of abstraction by pigeons, monkeys, and people. J Exp Psychol Anim Behav Process. 1988;14:247–260. [Google Scholar]
- 3.Vogels R. Categorization of complex visual images by rhesus monkeys. Eur J Neurosci. 1999;11:1223–1238. doi: 10.1046/j.1460-9568.1999.00530.x. [DOI] [PubMed] [Google Scholar]
- 4.Fabre-Thorpe M, Richard G, Thorpe SJ. Rapid categorization of natural images by rhesus monkeys. Neuroreport. 1998;9:303–308. doi: 10.1097/00001756-199801260-00023. [DOI] [PubMed] [Google Scholar]
- 5.Freedman DJ, Riesenhuber M, Poggio T, Miller EK. Categorical representation of visual stimuli in the primate prefrontal cortex. Science. 2001;291:312–316. doi: 10.1126/science.291.5502.312. [DOI] [PubMed] [Google Scholar]
- 6.Ashby FG, Maddox WT. Human category learning. Annu Rev Psychol. 2005;56:149–178. doi: 10.1146/annurev.psych.56.091103.070217. [DOI] [PubMed] [Google Scholar]
- 7.Freedman DJ, Riesenhuber M, Poggio T, Miller EK. A comparison of primate prefrontal and inferior temporal cortices during visual categorization. J Neurosci. 2003;23:5235–5246. doi: 10.1523/JNEUROSCI.23-12-05235.2003. [DOI] [PMC free article] [PubMed] [Google Scholar]
- 8.Ferrera VP, Yanike M, Cassanello C. Frontal eye field neurons signal changes in decision criteria. Nat Neurosci. 2009;12:1458–1462. doi: 10.1038/nn.2434. [DOI] [PMC free article] [PubMed] [Google Scholar]
- 9.Wallis JD, Anderson KC, Miller EK. Single neurons in prefrontal cortex encode abstract rules. Nature. 2001;411:953–956. doi: 10.1038/35082081. [DOI] [PubMed] [Google Scholar]
- 10.Freedman DJ, Assad JA. Experience-dependent representation of visual categories in parietal cortex. Nature. 2006;443:85–88. doi: 10.1038/nature05078. [DOI] [PubMed] [Google Scholar]
- 11.Fitzgerald JK, Freedman DJ, Assad JA. Generalized Associative Representations in Parietal Cortex. Nat Neurosci. 2011;14:1075–1079. doi: 10.1038/nn.2878. [DOI] [PMC free article] [PubMed] [Google Scholar]
- 12.Stoet G, Snyder LH. Single neurons in posterior parietal cortex of monkeys encode cognitive set. Neuron. 2004;42:1003–1012. doi: 10.1016/j.neuron.2004.06.003. [DOI] [PubMed] [Google Scholar]
- 13.Born RT, Bradley DC. Structure and Function of Visual Area MT. Annu Rev Neurosci. 2005;28:157–189. doi: 10.1146/annurev.neuro.26.041002.131052. [DOI] [PubMed] [Google Scholar]
- 14.Lewis JW, Van Essen DC. Corticocortical connections of visual, sensorimotor, and multimodal processing areas in the parietal lobe of the macaque monkey. J Comp Neurol. 2000;428:112–137. doi: 10.1002/1096-9861(20001204)428:1<112::aid-cne8>3.0.co;2-9. [DOI] [PubMed] [Google Scholar]
- 15.Jiang X, Bradley E, Rini RA, Zeffiro T, VanMeter J, Riesenhuber M. Categorization Training Results in Shape- and Category-Selective Human Neural Plasticity. Neuron. 2007;53:891–903. doi: 10.1016/j.neuron.2007.02.015. [DOI] [PMC free article] [PubMed] [Google Scholar]
- 16.Shadlen MN, Kiani R, Hanks TD, Churchland AK. Neurobiology of Decision Making: An Intentional Framework. In: Engel C, Singer W, editors. Better Than Conscious? Decision Making, the Human Mind, and Implications for Institutions. MIT Press; 2008. pp. 71–102. [Google Scholar]
- 17.Freedman DJ, Assad JA. Distinct encoding of spatial and nonspatial visual information in parietal cortex. J Neurosci. 2009;29:5671–5680. doi: 10.1523/JNEUROSCI.2878-08.2009. [DOI] [PMC free article] [PubMed] [Google Scholar]
- 18.Ferrera VP, Grinband J. Walk the line: parietal neurons respect category boundaries. Nat Neurosci. 2006;9:1207–1208. doi: 10.1038/nn1006-1207. [DOI] [PubMed] [Google Scholar]
- 19.Williams ZM, Elfar JC, Eskandar EN, Toth LJ, Assad JA. Parietal activity and the perceived direction of ambiguous apparent motion. Nat Neurosci. 2003;6:616–623. doi: 10.1038/nn1055. [DOI] [PubMed] [Google Scholar]
- 20.Cook EP, Maunsell JH. Attentional modulation of behavioral performance and neuronal responses in middle temporal and ventral intraparietal areas of macaque monkey. J Neurosci. 2002;22:1994–2004. doi: 10.1523/JNEUROSCI.22-05-01994.2002. [DOI] [PMC free article] [PubMed] [Google Scholar]
- 21.Nieder A, Diester I, Tudusciuc O. Temporal and spatial enumeration processes in the primate parietal cortex. Science. 2006;313:1431–1435. doi: 10.1126/science.1130308. [DOI] [PubMed] [Google Scholar]
- 22.Merchant H, Crowe DA, Robertson MS, Fortes AF, Georgopoulos AP. Top-down spatial categorization signal from prefrontal to posterior parietal cortex in the primate. Front Syst Neurosci. 2011;5:69. doi: 10.3389/fnsys.2011.00069. [DOI] [PMC free article] [PubMed] [Google Scholar]
- 23.Miller EK, Cohen JD. An integrative theory of prefrontal cortex function. Ann Rev Neurosci. 2001;24:167–202. doi: 10.1146/annurev.neuro.24.1.167. [DOI] [PubMed] [Google Scholar]
- 24.Roy JE, Riesenhuber M, Poggio T, Miller EK. Prefrontal cortex activity during flexible categorization. J Neurosci. 2010;30:8519–8528. doi: 10.1523/JNEUROSCI.4837-09.2010. [DOI] [PMC free article] [PubMed] [Google Scholar]
- 25.Bisley JW, Goldberg ME. Attention, intention, and priority in the parietal lobe. Annu Rev Neurosci. 2010;33:1–21. doi: 10.1146/annurev-neuro-060909-152823. [DOI] [PMC free article] [PubMed] [Google Scholar]
- 26.Snyder LH, Batista AP, Andersen RA. Intention-related activity in the posterior parietal cortex: a review. Vision Res. 2000;40:1433–1441. doi: 10.1016/s0042-6989(00)00052-3. [DOI] [PubMed] [Google Scholar]
- 27.Gottlieb J, Snyder LH. Spatial and non-spatial functions of the parietal cortex. Curr Opin Neurobio. 2010;20:731–740. doi: 10.1016/j.conb.2010.09.015. [DOI] [PMC free article] [PubMed] [Google Scholar]
- 28.Freedman DJ, Assad JA. A Proposed Common Neural Mechanisms for Categorization and Perceptual Decisions. Nat Neurosci. 2011;14:143–146. doi: 10.1038/nn.2740. [DOI] [PubMed] [Google Scholar]
- 29.Gold JI, Shadlen MN. The neural basis of decision making. Annu Rev Neurosci. 2007;30:535–574. doi: 10.1146/annurev.neuro.29.051605.113038. [DOI] [PubMed] [Google Scholar]
- 30.Bennur S, Gold JI. Distinct Representations of a Perceptual Decision and the Associated Oculomotor Plan in the Monkey Lateral Intraparietal Area. J Neurosci. 2011;31:913–921. doi: 10.1523/JNEUROSCI.4417-10.2011. [DOI] [PMC free article] [PubMed] [Google Scholar]
- 31.Asaad WF, Eskandar EN. A flexible software tool for temporally-precise behavioral control in Matlab. J Neurosci Methods. 2008;174:245–258. doi: 10.1016/j.jneumeth.2008.07.014. [DOI] [PMC free article] [PubMed] [Google Scholar]
- 32.Asaad WF, Rainer G, Miller EK. Task-specific neural activity in the primate prefrontal cortex. J Neurophysiol. 2000;84:451–459. doi: 10.1152/jn.2000.84.1.451. [DOI] [PubMed] [Google Scholar]
- 33.Green DM, Swets JA. Signal Detection Theory and Psychophysics. New York: J Wiley & Sons; 1966. [Google Scholar]
- 34.Tolhurst DJ, Movshon JA, Dean AF. The statistical reliability of signals in single neurons in cat and monkey visual cortex. Vision Res. 1983;23:775–785. doi: 10.1016/0042-6989(83)90200-6. [DOI] [PubMed] [Google Scholar]
Associated Data
This section collects any data citations, data availability statements, or supplementary materials included in this article.
Supplementary Materials
Figure S1. Recording Locations. Anatomical MRI images show approximate locations of LIP (a) and PFC (b) recordings as indicated by the superimposed yellow arrows. LIP recordings targeted the lateral bank of the intraparietal sulcus approximately 1.0–7.0 mm posterior to the intra-aural line. PFC recordings were accessed via chambers centered over the principal sulcus and anterior to the arcuate sulcus, approximately 27 mm anterior from the intra-aural line. PFC recordings were focused on the cortex between the two arrows.
Figure S2. Distributions of ROC values across LIP and PFC populations. An ROC analysis measured the strength of category selectivity of individual neurons (see Methods). ROC values for individual neurons could vary from 0.5 (no selectivity) to 1.0 (perfect category selectivity). (a–h) The gray bars show index values across the population of direction selective (according to one-way ANOVA at P<0.01) LIP (a–d) and PFC (e–h) neurons in each epoch. During the fixation epoch (a,e), ROC values are shown for all direction selective neurons (in any epoch).
Figure S3. Distributions of category tuning index (CTI) values across LIP and PFC populations. A category tuning index was computed that measured the strength of category selectivity of individual neurons (see Methods). Positive values of the index indicate larger activity differences between categories and/or more similar activity within categories. The gray bars show index values across the populations of direction selective neurons (according to a one-way ANOVA at P<0.01) in LIP (a–d) and PFC (e–h) in each epoch. During the fixation epoch (a,e), CTI values are shown for all direction selective neurons (in any epoch).
Figure S4. Average firing rates across LIP and PFC populations. Traces show the average firing rates across all neurons that were direction selective (according to one-way ANOVA at P<0.01) during any epoch in (a) LIP (N=67) and (b) PFC (N=155) using a 35 ms smoothing window. The shaded gray area around the solid traces indicates the standard error of the mean.
Figure S5. Relationship of category selectivity latency with category selectivity strength and firing rate. (a,b) Scatter plots show the relationship between firing rate and category selectivity latency for LIP (a) and PFC (b) neurons using the category tuning index based latency measure. (c,d) Scatter plots show the relationship between category selectivity strength and category selectivity latency for LIP (c) and PFC (d) neurons using the category tuning index based measure. For panels a–d, linear regression fits are indicated by the dotted line.
Figure S6. Controls for the relationship of category selectivity latency with category selectivity strength and firing rate. (a,b) The ROC value and latency of category selectivity is shown for all neurons included in the ROC latency analysis described in the main manuscript. The black points indicate neurons that were excluded in the latency control analyses in the supplemental info. The populations of LIP (a) and PFC (b) neurons in red have the same average category index value. (c,d) The average firing rate (during 80–500 ms after sample onset) and latency of category selectivity is shown for all neurons included in the ROC latency analysis described in the main manuscript. The black points indicate neurons that were excluded in the latency control analyses in the supplementary info. The populations of LIP (c) and PFC (d) neurons in red have the same average firing rate.
Figure S7. Category selectivity on ambiguous boundary trials. Each point on the scatter plots indicates the ROC value (comparing activity on Category 1 and Category 2 trials) of an individual LIP (a) or PFC (b) neuron on ambiguous boundary trials during the sample, delay, or test epochs. ROC values of 0.0 and 1.0 indicate strong selectivity for Category 1 and Category 2, respectively, on ambiguous trials (sorted according to the monkeys’ classification on each trial). Neurons’ category preferences on non-ambiguous trials are indicated by the color of each point (blue=Category 1; red=Category 2). All direction selective neurons (according to a one-way ANOVA at P<0.01) in each epoch are shown. This is the same data used to compute the mean values shown in Figs. 5e,f.