

Abstract
Aims
To investigate with high geographical resolution the small-scale spatial and temporal distribution of the pathogen Vibrio vulnificus throughout the water column in a temperate Texas bay where numerous V. vulnificus infections had been reported by the regional media the previous Summer.
Methods and Results
Surface and bottom water samples were collected from 19 sites between Apr 2005 and Oct 2006 from Matagorda Bay, TX. Physicochemical parameters were measured and V. vulnificus were analyzed using quantitative polymerase chain reaction (Q-PCR) as a means of overcoming constraints of traditional culturing techniques. V. vulnificus was detected through out the year, although it’s temporal and spatial distribution was patchy. V. vulnificus abundances at individual sites ranged from <10 to >1.1×10³ cells mL−1. No statistically reliable predictive model related to the physicochemical parameters could be developed for this pathogen.
Conclusions
This study demonstrates year round detection of V. vulnificus while likely in the viable but non-culturable (VBNC) state during the winter months and emphasizes why physicochemical factors are insufficient metrics for robust regression modeling of this pathogen.
Significance and Impact of the Study
This study provides an effective new tool, Q-PCR, to study environmental distribution of V. vulnificus and that in light of the patchy distribution observed, new reliable approaches and a mechanistic understanding of pathogen ecology need to be considered to effectively model the aquatic distribution of V. vulnificus.
INTRODUCTION
Vibrio vulnificus is gram-negative opportunistic human pathogen that thrives in warm estuarine environments and has been isolated from estuarine water and sediment as well as the oysters, fish and microfauna therein (Lipp et al. 2001; Pfeffer et al. 2003). While it is commonly associated with food borne illness, open wound infections and septicemia can be contracted by exposure to contaminated water, animals or objects. Septicemia due to V. vulnificus accounts for 95% of seafood related deaths with a mortality rate approaching 50% (Oliver 2005; Jones and Oliver 2009). Furthermore, oral consumption of V. vulnificus can result in severe systemic infection and formation of legions on patient extremities; wound infection upon exposure often involves varying degrees of tissue damage which can require amputation (Oliver 2005; Jones and Oliver 2009). Risk of aggressive infections upon exposure in the aquatic environment necessitates the study of V. vulnificus ecology in estuaries and coastal waters popular for recreation, tourism and aquaculture.
Vibrios are found in aquatic environments, in particular, estuaries, marine coastal waters and sediments, as well as aquaculture settings in temperate and tropical climates (Kelly 1982; Tamplin et al. 1982; Kaysner et al. 1987; Wright et al. 1996; Hoi et al. 1998; Motes et al. 1998; Barbieri et al. 1999; Hervio-Heath et al. 2002; Lin et al. 2003; Pfeffer et al. 2003; Panicker et al. 2004; Hsieh et al. 2008). Salinity and temperature are often considered the two centrally determinant variables concerning V. vulnificus abundance and distribution in both oysters and seawater (Kelly 1982; O’Neill et al. 1992; Tamplin and Capers 1992; DePaola et al. 1994; Motes et al. 1998; Lin et al. 2003; Pfeffer et al. 2003). Optimal environmental conditions for predictive distribution modeling of V. vulnificus are estimated at salinities between 6–16 and temperatures ranging from 18–30°C (Kelly 1982; Tamplin et al. 1982; Oliver et al. 1983; Kaysner et al. 1987; Kaspar and Tamplin 1993; Pfeffer et al. 2003). Several studies report difficulty recovering isolates at temperatures below 15°C; this is attributed to the broadly reported phenomenon of V. vulnificus entering a viable but non-culturable (VBNC) state (Kelly 1982; Kaysner et al. 1987; Lin et al. 2003; Lin and Schwarz 2003; Pfeffer et al. 2003).
Current predictive models rely on temperature as the dominant parameter influencing V. vulnificus variability in oysters in the Gulf of Mexico (Motes et al. 1998) and within the water column in a North Carolina estuary (Pfeffer et al. 2003), while salinity proved to be more important in determining prevalence and distribution of V. vulnificus in the water column of Charlotte Harbor, FL (Lipp et al. 2001). The inconsistencies between these findings suggest that geographic location and the estuarine conditions thereof, influence which environmental variables have the greatest impact on density and distribution of V. vulnificus and the predictive power of regression models based therein.
Previous studies examining V. vulnificus ecology rely on standard culturing techniques that require large sample volumes and are limited in the ability to detect V. vulnificus that are in the VBNC state. Despite the reported simplicity of resuscitating V. vulnificus from VBNC (Whitesides and Oliver 1997; Oliver 2005), there remains concern about the population dynamics at play in this resuscitation response. Molecular methods based on extraction of nucleic acids directly from the environment offer rapid and efficient means of overcoming such limitations in traditional culturing techniques. Quantitative Polymerase Chain Reaction (Q-PCR) has been utilized as a means of enumerating specific genes from environmental DNA samples (Mincer et al. 2007; Wetz et al. 2008); furthermore, such molecular techniques have been demonstrated as effective in qualitatively detecting V. vulnificus cells that are in the VBNC state (Warner and Oliver 1998). Primers targeting the V. vulnificus cytolysin (Panicker et al. 2004) unique to V. vulnificus (Gray and Kreger 1985; Wright et al. 1985), allow for sensitive and specific detection of V. vulnificus in environmentally derived samples (Warner and Oliver 1998; Lee et al. 1999; Fischer-Le Saux et al. 2002; Parvathi et al. 2004). The goal of this study is to constrain conditions that influence V. vulnificus ecology by examining small-scale distribution patterns of V. vulnificus using direct quantification of DNA from environmental samples. These findings will be valuable for maintenance of economically and recreationally important bays by providing stakeholders critical information to evaluate the geographic and temporal distribution and density of V. vulnificus in an effort to mitigate the risk of infection.
MATERIALS AND METHODS
Sample Collection
A spatial and temporal study of V. vulnificus distribution was conducted in Matagorda Bay, Texas, chosen for its association with contracted infections the previous Summer, and for the gradient of environmental variables observed therein. Samples were collected from Apr 2005 to Oct 2006 from 19 different locations (surface and bottom samples at 16 locations; 35 sites total; Table 1). The physicochemical parameters of depth, temperature, dissolved oxygen concentration, salinity, and pH were measured prior to collecting water at each site using a Manta Water Quality Multiprobe™ and the Amphibian™ data logger (Eureka Environmental Engineering, Austin, TX). Water samples were collected using a vertical water sampler that integrated ~60 cm of the water column. One sample was collected mid-column from shallow water sites (<1 m, n=3); surface and bottom samples were collected from deep-water columns (>1 m; n=16) and where strong salinity gradients were observed. All samples were stored on ice in acid washed 1 L polypropylene bottles for transport to the laboratory.
Table 1.
GPS coordinates of sampling sites near the shoreline and within both PowderhorLake and Matagorda Bay.
| Site | Coordinates | |
|---|---|---|
| Near Shore | ||
| LM/A | 28°30.231"N | 96°28.001"W |
| LM/B | 28°30.560"N | 96°28.683"W |
| LM/C | 28°30.771"N | 96°28.966"W |
| LM/CD | 28°31.110"N | 96°28.890"W |
| LM/D | 28°31.678"N | 96°30.047"W |
| LM/E | 28°33.589"N | 96°31.798"W |
| CASE | 28°28.757"N | 96°25.982"W |
| CLKS | 28°26.600"N | 96°24.400"W |
| Powderhorn Lake | ||
| PL/A | 28°30.449"N | 96°29.313"W |
| PL/B | 28°30.046"N | 96°29.916"W |
| PL/C | 28°29.579"N | 96°30.823"W |
| PL/D | 28°28.978"N | 96°32.256"W |
| Matagorda Bay | ||
| SO/01 | 28°27.014"N | 96°22.852"W |
| SO/02 | 28°29.504"N | 96°25.397"W |
| SO/03 | 28°30.818"N | 96°27.377"W |
| SO/04 | 28°33.208"N | 96°30.532"W |
| SO/05 | 28°31.521"N | 96°28.377"W |
| SO/06 | 28°23.280"N | 96°23.587"W |
Bacterial Enumeration
Samples were fixed with 0.22 µm filtered borate buffered formalin (2% final concentration) at 4°C for > 1 hr but < 24 hrs to ensure fixation while limiting the adverse effects of storage on bacterial estimates (Turley and Hughes 1992). Sub-samples were stained with 4’, 6’-diamidino-2-phenylindole (DAPI, Sigma; 1 µg ml−1 final) and incubated in the dark for 15 minutes. Stained samples were concentrated onto 25 mm diameter, 0.22 µm pore sized black polycarbonate filters (Millipore) (Porter and Feig 1980) which were mounted on to microscope slides and stored at −20°C (Turley and Hughes 1992). Bacteria were enumerated on a Zeiss Axioplan Imaging 2 microscope (Zeiss filter set 02; G 365nm/ LP 420nm), counting a minimum of 200 cells and seven fields to ensure statistical validity of counts (Kirchman et al. 1982).
DNA Extraction
Samples for DNA extraction were prepared immediately upon return to the laboratory by concentrating 50–200 ml of environmentally derived water samples onto Supor® 200 polyethersulfone filters (0.2 µm; Pall Corp.) and stored at −80°C. DNA was extracted using a modified protocol from Boström et al. (2004) designed for Q-PCR analysis with small sample volumes. After proteinase K and SDS lysis, lysate was passed through a silica membrane (UniPrep Spin Filters; modified; Genesee Scientific) to reduce carryover of detritus and suspended sediments. Filters were rinsed with 500 µl of TE buffer (10 mM Tris-HCl pH 8.0, 1mM EDTA), which was transferred through the spin column and pooled with the lysate. The sample was then precipitated, ethanol washed and dried, and suspended in 50 µl of PCR grade water for storage at −20°C.
Total DNA was quantified using Quanti-iT™ PicoGreen® dsDNA Reagent (Molecular Probes) following the manufacturer’s instructions for 200 µl volumes in Microfluor® 1, black 96-well micro-titer plates (Thermo Scientific) on a SpectraMax Gemini EM spectrofluorometer (excitation/emission - 480/520 nm) available through Molecular Devices, Inc. (Carlsbad, CA). Samples were diluted to 10 ng µl−1 in PCR grade water for further analysis.
Quantitative Polymerase Chain Reaction (Q-PCR)
The V. vulnificus cytolysin gene was targeted for Q-PCR analysis as it is a conserved and ubiquitous region among V. vulnificus strains regardless of isolation origin (Wright et al. 1985). A 205 base pair segment between nucleotides 785–990 of the gene was amplified using the primers L-vvh (5’-TTCCAACTTCAAACCGAACTATGA-3’) and R-vvh (5’-ATTCCAGTCGA TGCGAATACGTTG-3’; Integrated DNA Technologies, Inc. Coralville, IA; GenBank accession no. M34670), which demonstrated high sensitivity and 100% specificity for environmental and clinical strains of V. vulnificus using samples isolated from biotic and aquatic sources (Panicker et al. 2004). These primers were shown to be specific exclusively for V. vulnificus as compared to other Vibrio species as well as non-vibrio species (Panicker and Bej 2005). Q-PCR was performed with 7.5 µl Power SYBR® Green PCR Master Mix (Applied Biosystems), 300 nM of each optimized primer, 300 ng µl−1 final concentration BSA, 4.25 µl ddH2O and 10 ng template DNA at a total reaction volume of 15 µl. The assay was conducted on an ABI 7900HT Fast Real-Time PCR System (Applied Biosystems), with an initial denaturation at 95°C for 10 min followed by 40 cycles of 95°C for 15 s and 60°C for 1 min followed by a dissociation curve under the conditions of 95°C for 15 s, 60°C for 15 s, and a final 95°C for 15 s.
The standards were prepared using DNA extracted from V. vulnificus isolates obtained from the laboratory of Dr. John Schwarz at Texas A&M University, Galveston. Standard curves were prepared following a protocol provided by Applied Biosystems (http://docs.appliedbiosystems.com/pebiodocs/04371090.pdf). Two sequenced V. vulnificus genomes (V. vulnificus CMCP6; GenBank accession no. AE0169795.2 and V. vulnificus YJ016 GenBank accession no. BA000037.2) were used to estimate the 5.15 Mbp genome length for calculating genome copy number per standard reaction. A single set of standards was prepared by spiking environmental DNA from Matagorda Bay (Oct 18th, 2006) with serially diluted V. vulnificus DNA (3 to 300,000 V. vulnificus genome copies) for a total of 10 ng µl−1 DNA, and individual aliquots were stored at −80°C. V. vulnificus abundance in 10 ng of template DNA was extrapolated based on the standard curve with the System Software application for absolute quantification on the PCR platform. The dissociation curve was used to analyze the specificity of detected products. The specific melting temperature in the dissociation curve was determined to be 82°C, and non-specific binding occurred at 73°C. The melting curve analysis for the standard curve consistently showed specific binding for samples with > 300 genome copies (~100 cells mL−1); inconsistent amplification and non-specific binding were occasionally observed in standard samples with < 30 genome copies. Only samples with specific amplification in duplicate were considered positive for V. vulnificus.
V. vulnificus abundance in the water column was calculated as the ratio of V. vulnificus copies to total bacterial copies in the template DNA, and multiplying that ratio by the bacterial abundance for the respective sample using the equation AVv = CVv ÷ CTB × BA; where AVv is the abundance of V. vulnificus (cells mL−1), CVv is the number V. vulnificus copies in 10 ng of environmental DNA, CTB is the number of copies of total bacteria in 10 ng of environmental DNA, and BA is total bacterial abundance as determined by direct counts. Using this equation, it is assumed that all 10 ng of template DNA was of bacterial origin; hence V. vulnificus abundances are likely underestimates.
Statistical Analysis
The non-parametric Spearman’s Correlation was used to correlate environmental parameters and V. vulnificus abundance. Step-wise multiple regression analysis was used for predictive modeling of V. vulnificus abundance in the measured environmental variables. Statistical analyses were performed using SPSS (SPSS Inc, Release 14.0). All sample dates were used for detection frequency and distribution analyses; only seventeen dates were included in correlation analyses with physicochemical parameters due to lost environmental data for May 27th and Aug 9th, 2005.
RESULTS
Q-PCR Quantification of V. vulnificus in Aquatic Systems
Vibrio vulnificus was detected at every site at least once throughout the sampling period with a minimum of one site positive for V. vulnificus each date sampled. The highest concentration of V. vulnificus observed at a single site was approximately 1.1×10³ cells mL−1 (Aug 24th, 2005), followed by 5.2×10² cells mL−1 (Jul 25th, 2005), both with temperatures >30°C and salinities >27 (Randa et al. 2004). The remaining samples had V. vulnificus concentrations less than 500 cells mL−1. The highest average concentrations for both V. vulnificus and total bacteria occurred in late Jul 2005 (82 cells mL−1; 8.1×10⁶ cells mL−1, respectively). Abundances remained high through Aug 2005 (76 cells mL−1; 6.6×10⁶ cells mL−1, respectively) and were followed by a steep decline in V. vulnificus counts in Sep 2005. While total bacterial abundance increased from Winter through Summer 2006, neither V. vulnificus nor total bacterial abundances reached the same densities as those observed in 2005.
Spatial and Temporal Variation of V. vulnificus
The results of this study suggest that distribution of V. vulnificus in Matagorda Bay is spatially and temporally heterogeneous. This study relied on regular collection of surface and bottom water samples from 16 locations as well as single mid-column samples from three additional locations over a small geographical region that encompassed southeastern Matagorda Bay (Fig. 1). Detection of V. vulnificus varied between sites and between depths within the same location, and was variable between surface and bottom locations on the same sampling date and in shallow water (<2 m). V. vulnificus abundance variation was also seen between adjacent sites occasionally observing sites with high concentrations of V. vulnificus near sites where V. vulnificus was below detectable limits; this variation resulted in detection rates at ≥50% for only two of the 35 regularly sampled sites (Fig. 1).
Figure 1.

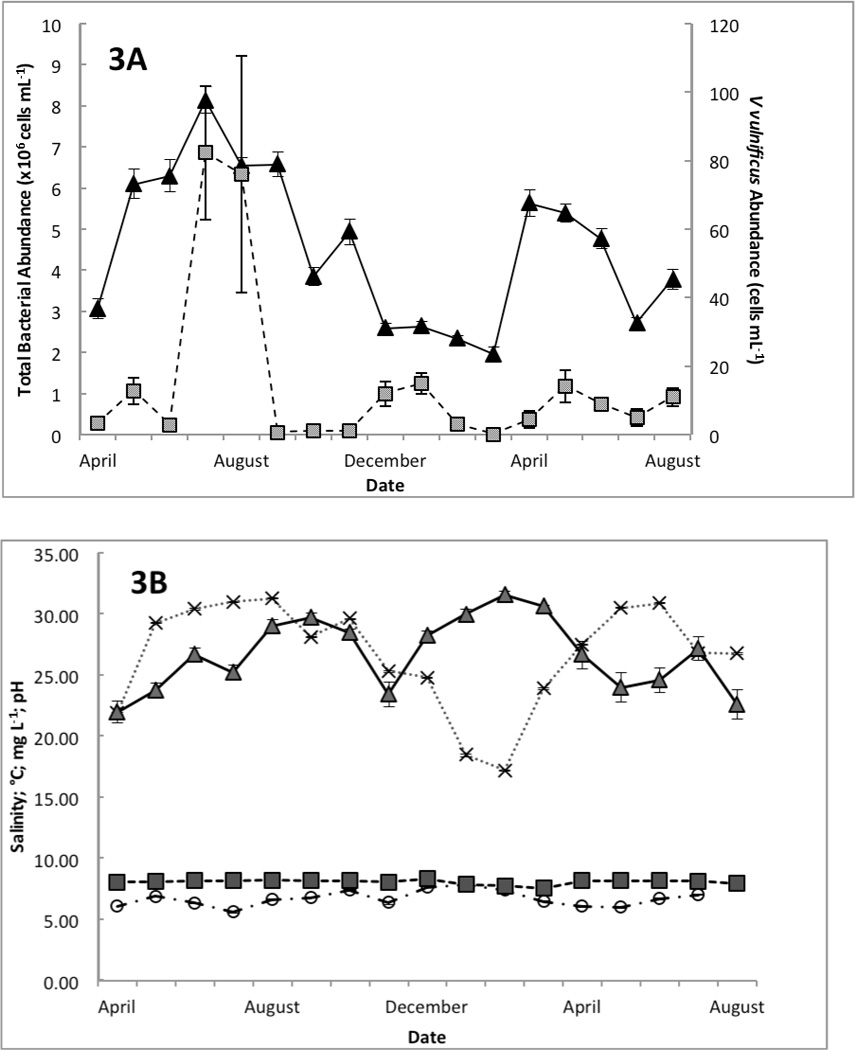
In addition to spatial patchiness, V. vulnificus detection was discontinuous over time. Two sampling dates with high detection frequencies, late Jul–Aug 2005 (69% and 63%, respectively) were flanked by sample dates with low detection frequencies, early Jul and Aug 2005 (17% and 27%, respectively; Fig. 2). Contrary to expectations of high abundances and detection during the summer months, the highest detection frequency between sample sites (79%) occurred in Jan 2006 (Fig. 2), one of the two sampling dates when water temperatures were lowest (<20°C) and salinities were relatively high (>30; Fig. 3B).
Figure 2.

Figure 3.
Environmental Variables
Over the 18-month sampling period, a range of environmental variables was measured in Matagorda Bay. Total bacterial abundance averages for each sampling trip ranged from 1.9×10⁶–8.1×10⁶ cells mL−1 (Fig. 3A), while average V. vulnificus concentrations ranged from <1 cell mL−1 to 82 cells mL−1. Total bacteria and V. vulnificus abundances peaked on Jul 25th, 2005, and were lowest on Apr 4th, 2006 (Fig. 3A). V. vulnificus demonstrates a weakly positive correlation with total bacterial abundance (p<0.05; r= 0.097). The highest and lowest concentrations of both total bacteria and V. vulnificus occurred on the same sampling dates despite any significant variation in the measured physicochemical parameters; similar trends in V. vulnificus and total bacteria dual density peaks were not observed for the duration of the sampling period. Bacterial abundance increased from winter into the summer of 2006 while V. vulnificus abundances did not fluctuate as dramatically (Fig. 3A). This lack of correlation strength, influenced by the leveling of V. vulnificus densities into the Summer 2006, indicates that subpopulations other than V. vulnificus respond more favorably to changes in this estuarine system.
Throughout the sampling period the average temperatures remained within the optimal range (15–32°C) for V. vulnificus (Fig. 3B). Daily temperatures were uniform across the bay, but differed significantly between sampling dates (p<0.001, two-tailed t-test). A slight positive correlation between temperature and V. vulnificus concentrations in the water column was observed in this study (p<0.05, r= 0.100).
Salinity ranged from 3 to 35, with the lower values observed in Powderhorn Lake. Vibrio vulnificus was detected across the entire range, and no correlation was observed.
A statistically significant difference in dissolved oxygen concentration was observed over time (p<0.01) with the lowest average concentrations in Aug 2005 and the highest in Feb 2006 (Fig. 3B). A slight negative correlation was observed between V. vulnificus abundance in the water column and dissolved oxygen concentration (p<0.05, r= −0.096).
Across the sampling region in Matagorda Bay, a slight positive correlation between V. vulnificus abundance and pH in the water column was observed (p<0.05, r= 0.104). A pH gradient was observed in the current study with the lowest pH values consistently measured in Powderhorn Lake, the sampling region closest to a freshwater source. The pH was consistently lower than the rest of the sample region (p<0.05) and pH values varied temporally (p<0.05) with the lowest average pH (<8.0) being observed during Winter 2006 (Fig. 3C).
DISCUSSION
Q-PCR Quantification of V. vulnificus in Aquatic Systems
Vibrio vulnificus abundance estimates using Q-PCR were similar to past estuarine studies where standard culturing techniques were employed for enumeration (Lipp et al. 2001; Pfeffer et al. 2003; Blackwell and Oliver 2008; Ramirez et al. 2008); and while two Matagorda Bay samples had V. vulnificus abundances greater than 500 cells mL−1, most samples had <100 cells mL−1. In comparison to studies employing traditional culturing techniques, the greatest abundance of V. vulnificus found by Lipp et al. (2001) was 190 CFU mL−1 of seawater with a mean of 12 CFU mL−1, and Wright et al. (1996) detected between 40–600 CFU mL−1 of seawater. Previous environmental surveys demonstrate that V. vulnificus was cultured from as many as 95% of estuarine samples collected in Florida (Lipp et al. 2001), while a west-coast study cultured V. vulnificus in <6% of their samples (Kaysner et al. 1987). In Matagorda Bay, V. vulnificus was detected in nearly 35% of total estuarine samples analyzed by molecular detection, which is comparable to a study in Galveston Bay, TX where V. vulnificus was cultivated from 45% of samples (Lin et al. 2003). The detection frequency similarities between these studies suggest that Q-PCR is applicable for detecting V. vulnificus in environmentally derived samples.
Despite using a culture independent technique, our results fall within the previously reported environmental values for V. vulnificus that were enumerated via traditional cultivation. While both methods have different limitations, there was congruence between the abundance values we observed and those reported in the literature. One specific limitation of traditional culturing is that it does not select for VBNC unless resuscitation incubation is used (Whitesides and Oliver 1997; Oliver 2005). Further, particle associated V. vulnificus will not be spatially separated on agar plates. While the molecular based techniques overcome these limitations, there is concern of DNA extraction efficiency, distribution of target genes, discrimination of live versus dead cells and the risk of amplifying free DNA from the aquatic environment. Nevertheless, the molecular technique affords the ability to store samples until processing. In the short term, samples can be stored on ice during travel time back to the laboratory, which may elevate concerns for growth and entrance into the VBNC state. In the long term, extracted DNA samples can be archived and resampled for post-hoc analysis.
Spatial and Temporal Variation of V. vulnificus
Heidelberg et al. (2002) reported on V. vulnificus patchiness on a scale similar to this study using culture techniques, and reported increased community composition of related taxa in cold-water conditions as well as dramatic fluctuations in densities from week to week. However, small-scale spatial patchiness, as seen here, has not commonly been reported in previous environmental studies. This may be influenced by employment of culture-based detection methods and examination of larger spatial scales with fewer sites (Kelly 1982; Tamplin et al. 1982; Oliver et al. 1983; O'Neill et al. 1992; Lipp et al. 2001; Lin et al. 2003; Pfeffer et al. 2003), thereby not encountering the same level of variability reported in previous environmental studies of V. vulnificus distribution.
The observed temporal patterns are contrary to previous reports that suggest high salinities are only tolerated by V. vulnificus when water temperatures are also high (Randa et al. 2004). Though the lowest temperatures observed during this study remained within the optimal growth range for V. vulnificus, these results highlight the very real potential of Q-PCR as a sensitive and efficient tool for detection of environmentally derived bacterial samples as well as an effective means of assessing V. vulnificus in the VBNC state. The findings reported here further support the recent observation of V. vulnificus year round (Ramirez et al. 2009). It is broadly reported that microorganisms are not homogenously distributed throughout aquatic systems (Seymour et al. 2005) and many bacterial species have been demonstrated as patchy in seawater even at the millimeter scale (Long and Azam 2001). The increased spatial and temporal sampling resolution further reveal heterogeneous distribution of V. vulnificus in the geographically distant estuarine systems of Matagorda Bay, TX and Chesapeake Bay (Heidelberg et al. 2002) as compared to other studies with less resolution (Kelly 1982; Kaysner et al. 1987; Wright et al. 1996; Lipp et al. 2001; Lin et al. 2003; Pfeffer et al. 2003).
Environmental Variables
Temperature has previously been reported as significantly influencing V. vulnificus density (Lipp et al. 2001; Lin et al. 2003; Pfeffer et al. 2003). We observed slight positive correlation which may have been due to the lack of variability beyond the optimal temperature range for V. vulnificus throughout the course of the sampling period. Temperature was incorporated into a step-wise multiple regression analysis for V. vulnificus abundance and subsequently resulted in a weak model accounting for less than 2% of total density variation in V. vulnificus (data not shown). One Chesapeake Bay study supports these findings suggesting that there is no significant correlation between water temperature and V. vulnificus concentrations when temperatures range between 8–26°C (Wright et al. 1996). On the contrary, Pfeffer et al. (2003) found temperature alone to account for 47% of V. vulnificus variability in a North Carolina estuary, but cite no significant correlation with salinity. However, the sampling regime of the latter study was limited to six sites in close proximity to fresh water (Pfeffer et al. 2003), thereby lacking a salinity gradient. These collective findings suggest that the importance of any given physicochemical parameter is influenced by geographic location of sample site and study area. Throughout this study, salinity differed across the sampling region (p<0.01), with the lowest average salinities consistently within the adjacent Powderhorn Lake, which measured the lowest mean salinity of 14.9 (Oct 2006).
In Jul 2004, prior to the initial sampling season, several Vibrio infections were reported in the Matagorda Bay area following a month of heavy rainfall. The recorded annual rainfall for this area in 2004 was 164.3 cm (Lower Colorado River Association - River Operation Center) and freshwater inflow during summer 2004 averaged 0.403 km3 mo−1 (USGS National Water Information System) which is relatively high compared to 2005 and 2006 when sampling occurred (99.5 cm yr−1, 0.066 km3 mo−1; 143.6 cm yr−1 and 0.050 km3 mo−1, respectively). The reduced frequency of precipitation events over the sampling period resulted in higher than typical salinities, which remained above the optimum range for V. vulnificus (6–16) during most of the study (Fig. 3B). Nevertheless, V. vulnificus was detected over a broad range of salinities (Table 2) and exhibited a slight negative correlation (p<0.05, r= −0.104).
Table 2.
Comparison of environmental parameter mean values and ranges between sites positive and sites negative for V. vulnificus.
| Water parameter | Mean values for parameters measured | |
|---|---|---|
| Positive sites (range) | Negative sites (range) | |
| Temperature °C | 26.75 (16.68–31.72) | 26.9 (16.67–31.94) |
| Salinity | 26.32 (6.52–34.95) | 26.93 (2.90–35.2) |
| Dissolved Oxygen (mg L−1) | 6.63 (4.53 – 8.39) | 6.77 (4.44 – 8.57) |
| pH | 8.13 (7.65–8.51) | 8.09 (7.12–8.54) |
| Total Bacteria | 4.82×10⁶ (1.03×10⁶–1.39×10⁷) | 4.57×10⁶ (7.3×10⁵–1.07×10⁷) |
The averages and ranges for environmental parameters do not significantly differ between the positive and negative sites.
The correlation between salinity and V. vulnificus in Matagorda Bay is similar to that found by Lin et al. (2003); the weak relationship is attributed to the salinity range (5–25) observed in Galveston Bay, TX. Previous distribution patterns show V. vulnificus decreasing in concentration along increasing salinity gradients (Kelly 1982; Wright et al. 1996). Wright et al. (1996) sampled eight sites in Chesapeake Bay, finding that V. vulnificus was more prevalent in the four sites closer to fresh water than those near the Atlantic Ocean. Lipp et al. (2001) determined that while temperature plays an important role, salinity was the most important variable determining the distribution of V. vulnificus in the water column for their study. A similar predictable trend was not observed in Matagorda Bay, as the highest concentrations were found at sites when temperatures were high; however, salinity was also high compared to previous reports. In the current study, salinity had only a weak correlation to V. vulnificus distribution and may have been influenced by Powderhorn Lake having the lowest salinities and the highest concentration of suspended materials in the water (data not shown), suggesting a potential role of colonization of suspended solids in the distribution of V. vulnificus.
We report a slight negative correlation of V. vulnificus and dissolved oxygen concentrations. This is in stark contrast to the recent report by Ramirez et al. (2009) conducting research in south Texas coastal waters where significant correlations were observed between V. vulnificus abundance and the physicochemical parameters of dissolved oxygen and salinity. However, a strong negative correlation (p<0.01, r= −0.634) was observed between dissolved oxygen concentration and water temperature as cold water holds more oxygen and may account for the correlation between dissolved oxygen and V. vulnificus. Similar to Pfeffer et al. (2003), dissolved oxygen was negatively correlated to V. vulnificus abundance in the water column, most likely due to lower dissolved oxygen concentrations facilitated by higher temperatures.
Environmental V. vulnificus densities tend to increase with higher temperature and decrease with rising salinities. However, these variables do not exclusively account for all of the variation in V. vulnificus abundance and distribution in the geographically distinct regions from which it has been isolated. Patchy distribution of V. vulnificus was observed across the measured environmental parameters of this study as concentrations varied between sites and dates in which measured environmental parameters were similar (Table 2). The inability to construct a predictive model based on these parameters suggests that there are additional factors that may contribute to V. vulnificus abundance and distribution such as episodic storm events and riverine inflow (Wetz et al. 2008). Given the apparent relationship between rainfall and V. vulnificus abundance, it would serve to assess rain threshold levels related to peak densities of this aquatic pathogen as several studies have described the correlation between rainfall and abundance of bacterial pathogens (Lipp et al. 2001; Boehm et al. 2002; Ackerman and Weisberg 2003; Schiff et al. 2003).
Considerations for Pathogen Ecology
While the physicochemical parameters constrain pathogen abundances and define their functional niche, biotic interactions within these parameters establish their realized niche. Beyond standard physicochemical parameters, the quantity and the quality of dissolved organic carbon (DOC) may influence the presence and abundance of pathogens in the environment. Certain bacterial species thrive in the presence of particulate substrates and the chitinous exoskeleton of aquatic copepods, offering concentrated nutrients and a source of attachment; ultimately resulting in enhanced population densities and facilitating survival in estuarine environments (Blokesch and Schoolnik 2007; Hsieh et al. 2007). Such ideal conditions promote colonization and subsequently, competition in pathogenic bacteria (Lyons et al. 2007).
Production of natural antimicrobial compounds can limit the growth of some bacterial species and affect community composition in a given environment. Production of such antimicrobial agents has been observed in Vibrios, and can have significant implications for the success of certain bacterial species in the environment, especially those commonly associated with marine particles or surfaces (Long and Azam 2001; Grossart et al. 2004). On the contrary, the close proximity of individuals of the same species may result in the accumulation of signaling molecules, resulting in bacterial communication through quorum sensing which has been identified as an important component in virulence expression for several species including V. vulnificus (Kim et al. 2003). Finally, the importance of trophic interactions regulating population growth should be considered. Heterotrophic protist grazing has been shown to influence V. cholerae proliferation and distribution (Worden et al. 2006) and may similarly influence population size and environmental distribution of other aquatic pathogens. Further, co-occurrence with aquatic amoeba may be implicit in the distribution and population growth dynamics of V. vulnificus. The aquatic protozoan Acanthamoeba as has recently been reported as playing a significant role influencing population densities and virulence of Vibrios as well as other gram-negative aquatic pathogens (Abd et al. 2005; Sandstrom et al. 2010).
Given the variability and multiplicity of factors influencing V. vulnificus distribution, density and subsequent patchiness, it may be prudent to employ more sophisticated modeling tools to assess these population dynamics. One model recently devised and validated is the classification and regression tree (CART) analysis in ecological forecasting of beach contamination for the development of reliable early warning systems (Fletcher et al. 2009). This robust decision node analytical tool links monitoring data with predictive models to estimate bacterial load in aquatic reservoirs as related to complex physicochemical parameters and the high-order interactions therein (De’ath and Fabricius 2000; Fletcher et al. 2009; EPA 2010). Such pre-emptive, predictive tools have proven reliable for multiple fresh water and salt-water beach sites in several states for tracking fecal indicator bacteria (FIB) contamination in an effort to mitigate the risk of infection (EPA 2010). Regarding Vibrio specific forecasting, multivariate empirical habitat modeling has recently been employed in an effort to predict distribution of V. cholerae and V. vulnificus in surface waters of the Chesapeake Bay based on ambient temperature and salinity (Constantin de Magny et al. 2009; Jacobs et al. 2010). Once validated, such early warning models may improve understanding of in situ variability of aquatic pathogen distribution and identify hotspots of bacterial occurrence within environmental reservoirs.
It is imperative to gain a mechanistic understanding of V. vulnificus response to the physicochemical and biotic variables within estuarine systems. The nearly identical mean values of measured environmental parameters between sites positive and negative for V. vulnificus detection (Table 2) suggests that these physicochemical factors alone are inadequate determinants of distribution, which appears patchy, situational and site specific. It is evident that merely presenting a range of preferred conditions based on empirical data hinders the ability to reliably predict pathogen proliferation and the subsequent threat posed to patrons of aquatic environments. As such, it is necessary to monitor small-scale, micro-dynamics such as chemoecology (i.e. communication and interactions at the molecular level) and trophic-level interactions, and to embed them into large-scale phenomena such as tidal flux and aquatic circulation patterns. An interdisciplinary approach combining intensive spatial and temporal sampling with mechanistic interactions and hydrodynamics is needed to govern understanding and enhance predictive models of Vibrio vulnificus and other aquatic pathogens.
ACKNOWLEDGMENTS
This work was supported by NSF-MCB-0729594 and an EPA- Formosa Plastics Environmental Trust Fund grant to RAL; and the National Institute of Health-Texas A&M University's Center for Environmental and Rural Health grant #5P30E509106 awarded to K. Elgethun and RAL; the Texas Water Resources Institute Mills Scholarship program to SLMF. The views expressed are those of the author and not the funding agencies.
We thank Genomics Facility in the Center for Environmental Research and Health at Texas A&M for use of facilities and equipment and guidance with Q-PCR. We thank Captain Mike Powell, Erin Johnson, Chrissy Wiederwohl and Laura Rubiano-Gomez for extensive sampling assistance, and lastly three anonymous reviewers for their valuable feedback.
REFERENCES
- Abd H, Saeed A, Weintraub A, Nair GB, Sandstrom G. Vibrio cholerae O1 strains are facultative intracellular bacteria, able to survive and multiply symbiotically inside the aquatic free-living amoeba Acanthamoeba castellanii. FEMS Microbiol Ecol. 2007;60:33–39. doi: 10.1111/j.1574-6941.2006.00254.x. [DOI] [PubMed] [Google Scholar]
- Ackerman D, Weisberg SB. Relationship between rainfall and beach bacterial concentrations on Santa Monica Bay beaches. J WaterHealth. 2003;01:85–89. [PubMed] [Google Scholar]
- Barbieri E, Falzano L, Fiorentini C, et al. Occurrence, diversity, and pathogenicity of halophilic Vibrio spp. and non-O1 Vibrio cholerae from estuarine waters along the Italian Adriatic Coast. Appl Environ Microbiol. 1999;65:2748–2753. doi: 10.1128/aem.65.6.2748-2753.1999. [DOI] [PMC free article] [PubMed] [Google Scholar]
- Blackwell KD, Oliver JD. The ecology of Vibrio vulnificus, Vibrio cholerae, and Vibrio parahaemolyticus in North Carolina estuaries. J Microbiol. 2008;46:146–153. doi: 10.1007/s12275-007-0216-2. [DOI] [PubMed] [Google Scholar]
- Bogosian G, Aardema ND, Bourneuf EV, Morris PJL, O'Neil JP. Recovery of hydrogen peroxide-sensitive culturable cells of Vibrio vulnificus gives the appearance of resuscitation from a viable but nonculturable state. J Bacteriol. 2000;182:5070–5075. doi: 10.1128/jb.182.18.5070-5075.2000. [DOI] [PMC free article] [PubMed] [Google Scholar]
- Boström KH, Simu K, Hagstrom A, Riemann L. Optimization of DNA extraction for quantitative marine bacterioplankton community analysis. Limnol Oceanogr-Meth. 2004;2:365–373. [Google Scholar]
- Blokesch M, Schoolnik GK. Serogroup conversion of Vibrio cholerae in aquatic reservoirs. PLOS Path. 2007;3:733–742. doi: 10.1371/journal.ppat.0030081. [DOI] [PMC free article] [PubMed] [Google Scholar]
- Constantin de Magny G, Long W, Brown CW, Hood RR, Huq A, Murtugudde R, Colwell RR. Predicting the distribution of Vibrio in the Chesapeake Bay: A case study with Vibrio cholerae. Ecohealth. 2009;6:378–389. doi: 10.1007/s10393-009-0273-6. [DOI] [PMC free article] [PubMed] [Google Scholar]
- Day AP, Oliver JD. Changes in membrane fatty acid composition during entry of Vibrio vulnificus into the viable but nonculturable state. J Microbiol. 2004;42:69–73. [PubMed] [Google Scholar]
- De'ath G, Fabricius KE. Classification and regression trees: A powerful yet simple technique for ecological data analysis. Ecology. 2000;81:3178–3192. [Google Scholar]
- DePaola A, McLeroy S, McManus G. Distribution of Vibrio vulnificus phage in oyster tissues and other estuarine habitats. Appl Environ Microb. 1997;63:2464–2467. doi: 10.1128/aem.63.6.2464-2467.1997. [DOI] [PMC free article] [PubMed] [Google Scholar]
- Fischer-Le Saux M, Hervio-Heath D, Loaec S, Colwell RR, Pommepuy M. Detection of cytotoxin-hemolysin mRNA in nonculturable populations of environmental and clinical Vibrio vulnificus strains in artificial seawater. Appl Environ Microb. 2002;68:5641–5646. doi: 10.1128/AEM.68.11.5641-5646.2002. [DOI] [PMC free article] [PubMed] [Google Scholar]
- Fletcher M, Pournelle JR, Ramage D, Porter DE, Shervette V, Kelsey RH. A southeast regional testbed for integrating complex coastal and ocean information systems. Oceans; Proceedings of the MTS/IEEE Oceans 09 Conference; October 26–29, 2009; Biloxi, MS. 2009. [Google Scholar]
- Gray L, Kreger A. Purification and characterization of an extracellular cytolysin produced by Vibrio vulnificus. Infect Immun. 1985;48:62–72. doi: 10.1128/iai.48.1.62-72.1985. [DOI] [PMC free article] [PubMed] [Google Scholar]
- Grossart H-P, Schlingloff A, Bernhard M, Simon M, Brinkhoff T. Antagonistic activity of bacteria isolated from organic aggregates of the German Wadden Sea. FEMS Microbiol Ecol. 2004;47:387–396. doi: 10.1016/S0168-6496(03)00305-2. [DOI] [PubMed] [Google Scholar]
- Heidelberg JF, Heidelberg KB, Colwell RR. Seasonality of Chesapeake Bay bacterioplankton species. Appl Environ Microb. 2002;68:5488–5497. doi: 10.1128/AEM.68.11.5488-5497.2002. [DOI] [PMC free article] [PubMed] [Google Scholar]
- Hervio-Heath D, Colwell RR, Derrien A, Robert-Pillot A, Fournier JM, Pommepuy M. Occurrence of pathogenic Vibrios in coastal areas of France. J Appl Microbiol. 2002;92:1123–1135. doi: 10.1046/j.1365-2672.2002.01663.x. [DOI] [PubMed] [Google Scholar]
- Hoi L, Larsen JL, Dalsgaard I, Dalsgaard A. Occurrence of Vibrio vulnificus biotypes in Danish marine environments. Appl Environ Microb. 1998;64:7–13. doi: 10.1128/aem.64.1.7-13.1998. [DOI] [PMC free article] [PubMed] [Google Scholar]
- Hsieh JL, Fries JS, Noble RT. Vibrio and phytoplankton dynamics during the summer of 2004 in a eutrophying estuary. Ecol. Appl. 2007;17:S102–S109. [Google Scholar]
- Hsieh J, Fries J, Noble R. Dynamics and predictive modelling of Vibrio spp. in the Neuse River Estuary, North Carolina, USA. Environ Microbiol. 2008;10:57–64. doi: 10.1111/j.1462-2920.2007.01429.x. [DOI] [PubMed] [Google Scholar]
- Jackson JK, Murphree RL, Tamplin ML. Evidence that mortality from Vibrio vulnificus infection results from single strains among heterogeneous populations in shellfish. J Clin Microbiol. 1997;35:2098–2101. doi: 10.1128/jcm.35.8.2098-2101.1997. [DOI] [PMC free article] [PubMed] [Google Scholar]
- Jacobs JM, Rhodes M, Brown CW, Hood RR, Leigh A, Long W, Wood R. Oxford, MD: NOAA National Centers for Coastal Ocean Science, Center for Coastal Environmental Health and Biomolecular Research, Cooperative Oxford Laboratory; 2010. Predicting the Distribution of Vibrio vulnificus in Chesapeake Bay. NOAA Technical Memorandum NOS NCCOS 112; p. 12. [Google Scholar]
- Jones MK, Oliver JD. Vibrio vulnificus: Disease and pathogenesis. Infect Immun. 2009;77:1723–1733. doi: 10.1128/IAI.01046-08. [DOI] [PMC free article] [PubMed] [Google Scholar]
- Kaspar CW, Tamplin ML. Effects of temperature and salinity on the survival of Vibrio vulnificus in seawater and shellfish. Appl Environ Microb. 1993;59:2425–2429. doi: 10.1128/aem.59.8.2425-2429.1993. [DOI] [PMC free article] [PubMed] [Google Scholar]
- Kaysner CA, Abeyta CJ, Wekell MM, DePaola AJ, Stott RF, Leitch JM. Virulent strains of Vibrio vulnificus isolated from estuaries of the United States West Coast. Appl Environ Microb. 1987;53:1349–1351. doi: 10.1128/aem.53.6.1349-1351.1987. [DOI] [PMC free article] [PubMed] [Google Scholar]
- Kelly MT. Effect of temperature and salinity on Vibrio (Beneckea) vulnificus occurence in a Gulf Coast environment. Appl Environ Microb. 1982;44:820–824. doi: 10.1128/aem.44.4.820-824.1982. [DOI] [PMC free article] [PubMed] [Google Scholar]
- Kim SY, Lee SE, Kim YR, Kim CM, Ryu PY, Choy HE, Chung SS, Rhee JH. Regulation of Vibrio vulnificus virulence by the LuxS quorum-sensing system. Mol Microbiol. 2003;48:1647–1664. doi: 10.1046/j.1365-2958.2003.03536.x. [DOI] [PubMed] [Google Scholar]
- Kirchman DL, Sigda J, Kapuscinski R, Mitchell R. Statistical analysis of the direct count method for enumerating bacteria. Appl Environ Microb. 1982;44:376–382. doi: 10.1128/aem.44.2.376-382.1982. [DOI] [PMC free article] [PubMed] [Google Scholar]
- Lee JY, Bang YB, Rhee JH, Choi SH. Two-stage nested PCR effectiveness for direct detection of Vibrio vulnificus in natural samples. J Food Sci. 1999;64:158–162. [Google Scholar]
- Lin ML, Payne DA, Schwarz JR. Intraspecific diversity of Vibrio vulnificus in Galveston Bay water and oysters as determined by randomly amplified polymorphic DNA PCR. Appl Environ Microb. 2003;69:3170–3175. doi: 10.1128/AEM.69.6.3170-3175.2003. [DOI] [PMC free article] [PubMed] [Google Scholar]
- Lin ML, Schwarz JR. Seasonal shifts in population structure of Vibrio vulnificus in an estuarine environment as revealed by partial 16s ribosomal DNA sequencing. FEMS Microbiol Ecol. 2003;45:23–27. doi: 10.1016/S0168-6496(03)00091-6. [DOI] [PubMed] [Google Scholar]
- Lipp EK, Kurz R, Vincent R, Rodriguez-Palacios C, Farrah SR, Rose JB. The effects of seasonal variability and weather on microbial fecal pollution and enteric pathogens in a subtropical estuary. Estuaries. 2001;24:266–276. [Google Scholar]
- Lipp EK, Rodriguez-Palacios C, Rose JB. Occurrence and distribution of the human pathogen Vibrio vulnificus in a subtropical Gulf of Mexico estuary. Hydrobiologia. 2001;460:165–173. [Google Scholar]
- Long RA, Azam F. Antagonistic interactions among marine pelagic bacteria. Appl Environ Microb. 2001;67:4975–4983. doi: 10.1128/AEM.67.11.4975-4983.2001. [DOI] [PMC free article] [PubMed] [Google Scholar]
- Long RA, Azam F. Microscale patchiness of bacterioplankton assemblage richness in seawater. Aquat Microb Ecol. 2001;26:103–113. [Google Scholar]
- Long RA, Rowley DC, Zamora E, Liu J, Bartlett DH, Azam F. Antagonistic interactions among marine bacteria impede the proliferation of Vibrio cholerae. Appl Environ Microb. 2005;71:8531–8536. doi: 10.1128/AEM.71.12.8531-8536.2005. [DOI] [PMC free article] [PubMed] [Google Scholar]
- Lyons MM, Lau Y, Carden WE, Ward JE, Roberts SB, Smolowitz R, Vallino J, Allam B. Characteristics of marine aggregates in shallow-water ecosystems: implications for disease ecology. EcoHealth. 2007;4:406–420. [Google Scholar]
- Mcgovern VP, Oliver JD. Induction of cold-responsive proteins in Vibrio vulnificus. J Bacteriol. 1995;177:4131–4133. doi: 10.1128/jb.177.14.4131-4133.1995. [DOI] [PMC free article] [PubMed] [Google Scholar]
- Mincer TM, Church M, Taylor LT, Preston CM, Karl DM, De Long E. Quantitative distribution of presumptive archaeal and bacterial nitrifiers in Monterey Bay and the North Pacific Subtropical Gyre. Environ Microbiol. 2007;9:1162–1175. doi: 10.1111/j.1462-2920.2007.01239.x. [DOI] [PubMed] [Google Scholar]
- Mizunoe Y, Wai SN, Ishikawa T, Takade A, Yoshida S. Resuscitation of viable but nonculturable cells of Vibrio parahaemolyticus induced at low temperature under starvation. FEMS Microbiol Lett. 2000;186:115–120. doi: 10.1111/j.1574-6968.2000.tb09091.x. [DOI] [PubMed] [Google Scholar]
- Motes ML, DePaola AJ, Cook DW, Veazey JE, Hunsucker JC, Garthright WE, Blodgett RJ, Chirtel SJ. Influence of water temperature and salinity on Vibrio vulnificus in Northern Gulf and Atlantic Coast oysters (Crossostrea virginica) Appl Environ Microb. 1998;64:1459–1465. doi: 10.1128/aem.64.4.1459-1465.1998. [DOI] [PMC free article] [PubMed] [Google Scholar]
- Oliver JD. Wound infections caused by Vibrio vulnificus and other marine bacteria. Epidemiol Infect. 2005;133:383–391. doi: 10.1017/s0950268805003894. [DOI] [PMC free article] [PubMed] [Google Scholar]
- Oliver JD, Bockian R. In-vivo resuscitation, and virulence towards mice, of viable but nonculturable cells of Vibrio vulnificus. Appl Environ Microb. 1995;61:2620–2623. doi: 10.1128/aem.61.7.2620-2623.1995. [DOI] [PMC free article] [PubMed] [Google Scholar]
- Oliver JD, Hite F, McDougald D, Andon NL, Simpson LM. Entry into, and resuscitation from, the viable but nonculturable state by Vibrio vulnificus in an estuarine environment. Appl Environ Microb. 1995;61:2624–2630. doi: 10.1128/aem.61.7.2624-2630.1995. [DOI] [PMC free article] [PubMed] [Google Scholar]
- Oliver JD, Nilsson L, Kjelleberg S. Formation of nonculturable Vibrio vulnificus cells and its relationship to the starvation state. Appl Environ Microb. 1991;57:2640–2644. doi: 10.1128/aem.57.9.2640-2644.1991. [DOI] [PMC free article] [PubMed] [Google Scholar]
- Oliver JD, Warner RA, Cleland DR. Distribution of Vibrio vulnificus and other lactose-fermenting Vibrios in marine environments. Appl Environ Microb. 1983;45:985–998. doi: 10.1128/aem.45.3.985-998.1983. [DOI] [PMC free article] [PubMed] [Google Scholar]
- O'Neill KR, Jones SH, Grimes DJ. Seasonal Incidence of Vibio vulnificus in the Great Bay Estuary of New Hampshire and Maine. Appl Environ Microb. 1992;58:3257–3262. doi: 10.1128/aem.58.10.3257-3262.1992. [DOI] [PMC free article] [PubMed] [Google Scholar]
- Panicker G, Myers ML, Bej AK. Rapid detection of Vibrio vulnificus in shellfish and Gulf of Mexico water by real-time PCR. Appl Environ Microb. 2004;70:498–507. doi: 10.1128/AEM.70.1.498-507.2004. [DOI] [PMC free article] [PubMed] [Google Scholar]
- Parvathi A, Kumar HS, Karunasagar I, Karunasagar I. Detection and enumeration of Vibrio vulnificus in oysters from two estuaries along the southwest coast of India, using molecular methods. Appl Environ Microb. 2004;70:6909–6913. doi: 10.1128/AEM.70.11.6909-6913.2004. [DOI] [PMC free article] [PubMed] [Google Scholar]
- Pfeffer CS, Hite MF, Oliver JD. Ecology of Vibrio vulnificus in estuarine waters of eastern North Carolina. Appl Environ Microb. 2003;69:3526–3531. doi: 10.1128/AEM.69.6.3526-3531.2003. [DOI] [PMC free article] [PubMed] [Google Scholar]
- Porter KG, Feig YS. The use of DAPI for identifying and counting aquatic microflora. Limnol Oceanogr. 1980;25:943–948. [Google Scholar]
- Ramirez GD, Buck GW, Smith AK, Gordon KV, Mott JB. Incidence of Vibrio vulnificus in estuarine waters of the south Texas Coastal Bend region. J Appl Microbiol. 2009;107:2047–2053. doi: 10.1111/j.1365-2672.2009.04390.x. [DOI] [PubMed] [Google Scholar]
- Randa MA, Polz MF, Lim E. Effects of temperature and salinity on Vibrio vulnificus population dynamics as assessed by quantitative PCR. Appl Environ Microb. 2004;70:5469–5476. doi: 10.1128/AEM.70.9.5469-5476.2004. [DOI] [PMC free article] [PubMed] [Google Scholar]
- Sandstrom G, Saeed A, Abd H. Acanthamoeba polyphaga is a possible host for Vibrio cholerae in aquatic environments. Exp Parasitol. 2010;126:65–68. doi: 10.1016/j.exppara.2009.09.021. [DOI] [PubMed] [Google Scholar]
- Schiff KC, Morton J, Weisberg SB. Retrospective evaluation of shoreline water quality along Santa Monica Bay beaches. Mar Environ Res. 2003;56:245–253. doi: 10.1016/S0141-1136(02)00333-1. [DOI] [PubMed] [Google Scholar]
- Seymour JR, Patten N, Bourne DG, Mitchell JG. Spatial dynamics of virus-like particles and heterotrophic bacteria within a shallow coral reef system. Mar Ecol Prog Ser. 2005;288:1–8. [Google Scholar]
- Tamplin ML, Rodrick GE, Blake NJ, Cuba T. Isolation and characterization of Vibrio vulnificus from two Florida estuaries. Appl Environ Microb. 1982;44:1466–1470. doi: 10.1128/aem.44.6.1466-1470.1982. [DOI] [PMC free article] [PubMed] [Google Scholar]
- USEPA. Predictive tools for beach notification volume I: Review and technical protocol. EPA-823-R-10-003. 2010 November 22; [Google Scholar]
- Turley CM, Hughes DJ. Effects of storage on direct estimates of bacterial numbers of preserved seawater samples. Deep-Sea Res. 1992;39:375–394. [Google Scholar]
- Warner JM, Oliver JD. Randomly amplified polymorphic DNA analysis of starved and viable but nonculturable Vibrio vulnificus cells. Appl Environ Microb. 1998;64:3025–3028. doi: 10.1128/aem.64.8.3025-3028.1998. [DOI] [PMC free article] [PubMed] [Google Scholar]
- Wetz J, Blackwood A, Fries J, Williams Z, Noble R. Trends in total Vibrio spp. and Vibrio vulnificus concentrations in the eutrophic Neuse River Estuary, North Carolina, during storm events. Aquat Microb Ecol. 2008;53:141–149. [Google Scholar]
- Whitesides MD, Oliver JD. Resuscitation of Vibrio vulnificus from the viable but nonculturable state. Appl Environ Microb. 1997;63:1002–1005. doi: 10.1128/aem.63.3.1002-1005.1997. [DOI] [PMC free article] [PubMed] [Google Scholar]
- Worden AZ, Seidel M, Smriga S, Wick A, Malfatti F, Bartlett D, Azam F. Trophic regulation of Vibrio cholerae in coastal marine waters. Environ Microbiol. 2006;8:21–29. doi: 10.1111/j.1462-2920.2005.00863.x. [DOI] [PubMed] [Google Scholar]
- Wright AC, Morris JGJ, Maneval DRJ, Richardson K, Kaper J. Cloning of the cytotoxin-hemolysin gene of Vibrio vulnificus. Infect Immun. 1985;50:922–924. doi: 10.1128/iai.50.3.922-924.1985. [DOI] [PMC free article] [PubMed] [Google Scholar]
- Wright S, Thomas D, Marchant H, Higgins H, Mackey M, Mackey D. Analysis of phytoplankton of the Australian sector of the Southern Ocean: Comparisons of microscopy and size frequency data with interpretations of pigment HPLC data using the 'CHEMTAX' matrix factorisation program. Mar Ecol Prog Ser. 1996;144:285–298. [Google Scholar]