Abstract
We investigated the effects of laser excitation wavelength on water-window emission lines of laser-produced boron-nitride plasmas. Plasmas are produced by focusing 1064 nm and harmonically generated 532 and 266 nm radiation from a Nd:YAG laser on BN target in vacuum. Soft x-ray emission lines in the water-window region are recorded using a grazing-incidence spectrograph. Filtered photodiodes are used to obtain complementary data for water-window emission intensity and angular dependence. Spectral emission intensity changes in nitrogen Ly-α and He-α are used to show how laser wavelength affects emission. Our results show that the relative intensity of spectral lines is laser wavelength dependent, with the ratio of Ly-α to He-α emission intensity decreasing as laser wavelength is shortened. Filtered photodiode measurements of angular dependence showed that 266 and 532 nm laser wavelengths produce uniform emission.
INTRODUCTION
Soft x-rays in the water-window (WW) region, which lays between the absorption edges of oxygen (2.28 nm, 543 eV) and carbon (4.36 nm, 284 eV), are of great interest as a light source for cellular microscopy. At these wavelengths transmission through water is relatively high compared to carbon containing cellular materials (proteins, carbohydrates, lipids, etc.). This natural contrast and x-ray optics high depth of field allows for several advantages over optical microscopy and transmission electron-microscopy (TEM) commonly used in biology. Water-window transmission x-ray microscopes (TXM) and scanning transmission x-ray microscopes (STXM) have achieved high resolution (∼30 nm) using zone plate condensers and objectives,1 which is near comparable with TEM. Sample thicknesses of ∼10 μm can be used,1 and whole cell tomography is possible.2, 3, 4, 5 The energy deposited in cells during x-ray microscopy is too high for live cells to survive, but unlike with TEM which requires lengthy sample preparation that leaves artifacts, WW-microscopy can utilize cryogenically frozen fully hydrated cells that receive little structural damage during microscopy. Currently this is not a widely used form of microscopy due to the small number of facilities performing WW-microscopy. Most WW-TXM and WW-STXM is performed in large synchrotron facilities, which can provide near monochromatic x-rays but have very limited access.
An ongoing goal for WW-microscopy is the development of a compact source of WW soft x-rays (SXR) that would allow x-ray optics developed for synchrotron source microscopes to be used in a laboratory based system. The primary source requirements for TXM and STXM, that use diffractive zone-plate optics, are high brightness, uniform emission, and near monochromatic in order to achieve high transmission contrast and avoid optical aberrations that results in poor resolution. Because x-ray optics are delicate, a source that produces debris should be avoided in order to prevent damage. Several possible sources that have been investigated for laboratory WW-microscopy are laser produced plasma (LPP), discharge produced plasma,6 and electron excitation of oxygen.7
Currently LPP have been extensively studied as sources for extreme ultraviolet lithography (EUVL)8, 9, 10, 11, 12, 13 due to their compact size, high brightness, and high conversion efficiency. The properties of EUV and SXR emission from LPP depend on target material and configuration, and on laser wavelength, temporal pulse width, and spot size. The required LPP temperature for the efficient EUV emission at 13.5 nm is ∼30 eV,14 and studies showed that longer laser wavelengths provide higher conversion efficiency and less debris.12, 13, 14 An EUV emission study using CO2 laser (10.6 μm) and tin target showed that higher conversion efficiencies were attained for larger defocused spot sizes than for smaller minimal focal spot sizes.9 In order to achieve efficient emission in the WW region LPP must be heated to much higher temperatures than is required for 13.5 nm EUVL source. Laser wavelength is one of the parameters that greatly affect LPP emission intensity in the WW region, as well as the opacity of the plasma. Nitrogen has been heavily investigated for use as a LPP target due to its strong emission lines in the WW region, Ly-α (2.48 nm) and He-α (2.88 nm) lines, and investigated nitrogen target configurations have included cryogenic liquid jets,15, 16, 17, 18, 19 cryogenic solid nitrogen,20 boron-nitride,20, 21 and gas jets.22, 23, 24 The effect of laser wavelength on SXR emission from a carbon target excited by femtosecond laser pulses showed that shorter laser wavelength produced higher emission intensity, brightness, and conversion efficiency.25 Experiments with liquid nitrogen targets using femto, pico, and nanosecond laser pulses showed that pico and nanosecond pulses provided higher conversion efficiencies than femtosecond pulses.16, 17 Due to the low density of liquid and gaseous targets compared to solid targets, they have been pursued as a method to reduce the debris produced by LPP.
We investigated the role of laser wavelength on WW emission from laser produced boron-nitride plasma. A Nd:YAG laser operating in the fundamental, second and fourth harmonic (1ω, 2ω, and 4ω) was used to excite a planar boron-nitride target in vacuum. A grazing-incidence spectrograph and filtered photodiodes were used to record changes in WW emission line intensities. Filtered photodiodes were also used to measure laser wavelength effects on angular dependence of emission. Results show that laser wavelength has a significant effect on the WW line emission intensity and hence conversion efficiency, and angular emission in the WW.
EXPERIMENTAL SETUP
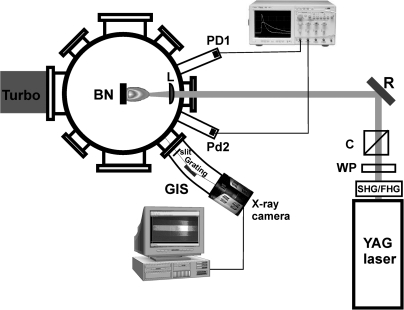
The schematic of the experimental setup is given in Fig. 1. A planar boron-nitride (BN) target of 99.98% purity was placed in a vacuum chamber at a pressure of ∼10−5 Torr. A Q-switched Nd:YAG laser (Continuum Surelite III) with a pulse length of 6 ns full-width at half-maximum (FWHM) was used to excite BN normal to the target surface and produce a plasma with emission in the WW region on approximately the same temporal scale as the laser pulse. The target was positioned at the chamber center and translated using an xyz-stage that was used to present a fresh surface for each laser pulse and ensure consistency for each measurement.
Figure 1.
(Color online) Schematic of the experimental setup. (SHG, second harmonic generator; FHG, fourth harmonic generator; WP, half-waveplate; C, cube-polarizer; R, reflective mirror; L, lens; BN, boron-nitride; PD, filtered photodiodes; GIS, grazing-incidence spectrograph.)
Laser parameters were varied by wavelength and energy. The fundamental wavelength (1ω, 1064 nm), second harmonic (2ω, 532 nm), and fourth harmonic (4ω, 266 nm) of the Nd:YAG laser were used in this experiment to determine the effects of laser wavelength. The maximum energies for 1ω, 2ω, and 4ω are 600, 240, and 90 mJ, respectively. Laser pulse energy was attenuated using a combination of half-waveplate and a cube-polarizer. For all three wavelengths plano-convex spherical lenses of focal length 100 mm were used to focus the laser on the target. Using lenses of equal focal length, smaller spot sizes can be attained for shorter wavelengths and used to compensate for lower maximum energies at higher harmonics, so equal or higher power densities can be attained. The calculated spot size radii used in this experiment are 14, 7, and 4 μm for 1ω, 2ω, and 4ω, respectively. Energy densities in the order of 1011−1013 W/cm2 were achieved for this experiment.
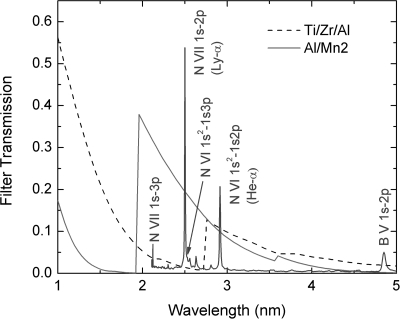
The SXR spectrum was analyzed using a grazing-incidence spectrograph with a spherical-concave grating that has a groove spacing of 1200 grooves/mm. The spectrograph was positioned at an angle of 45° to the target normal, and the center of the grating was approximately 70 cm from the LPP. The spectrograph slit width was approximately 100 μm. A back-illuminated charge-coupled device (CCD) (Princeton Instruments PIXIS-XO 1024B) was used to record the time integrated spectrum. A representative BN SXR spectrum from 2.2−5 nm is given in Fig. 2. The spectrograph can attain a spectral resolution (λ/Δλ) of ∼250 for emission lines in the WW region.
Figure 2.
(Color online) Photodiode metal filter coating transmission curves and representative BN LPP emission spectra produced by a 1ω, 1.7 × 10¹³ W/cm2 pulse, with identified major emission lines.
Filtered SXR sensitive photodiodes (AXUV100, IRD Inc.) were used for measuring photon fluences of WW emission lines. Two photodiodes with metal filter coatings (Al/Mn2 and Ti/Zr/Al) were used for measuring photon flux from Ly-α and He-α lines. The thicknesses for Al/Mn2 and Ti/Zr/Al filters are 500/500 nm and 250/100/100 nm, respectively. The x-ray transmissivity of these photodiodes compared to a representative BN plasma emission spectrum in and around the WW region is shown in Fig. 2. The Al/Mn2 filter effectively transmits the N Ly-α and N He-α emission, and the Ti/Zr/Al filter effectively transmits the N He-α and B Ly-α emission while blocking N Ly-α emission. For measuring the laser power density dependence, both photodiodes were positioned 28° from the target normal and detected a solid angle of emission of approximately 5.5π × 10−5 sr. For measuring the angular dependence of emission an AXUV100 Ti/Zr/Al was placed at 5 equally spaced angles from 20−90° of the target normal and detected a solid angle of approximately 1π × 10−3 sr.
RESULTS AND DISCUSSION
Bright, efficient, and clean WW-SXR sources are necessary for laboratory microscopy systems. In LPP systems several key parameters must be chosen which affect the SXR emission from the plasma and the cleanliness of the system. For example, the conversion efficiency (laser energy to spectral line emission energy) is dependent on several plasma parameters, with most being directly or indirectly dependent on laser excitation conditions and target properties. The prominent laser parameters that affect the plasma properties are laser wavelength and power density, which are varied in this experiment.
Water-window nitrogen-emission lines
The grazing-incidence spectrograph is used to measure changes in the BN-LPP SXR spectrum for various target excitation conditions. Of particular interest is the intensity of the N Ly-α and He-α emission lines located within the WW region. A representative BN-plasma SXR spectrum between wavelengths 2.2−5 nm is shown in Fig. 2 with major nitrogen and boron emission lines identified. Prominent identified lines shown in the spectra are NVII 1s-2p (Ly-α) and NVI 1s2-1s2p (He-α). Less prominent identified lines are NVII 1s-3p (Ly-β), NVI 1s2-1s3p (He-β), and BVI 1s-2p (Ly-α). The N Ly-α and He-α lines are the two most promising candidates for use in WW-microscopy.
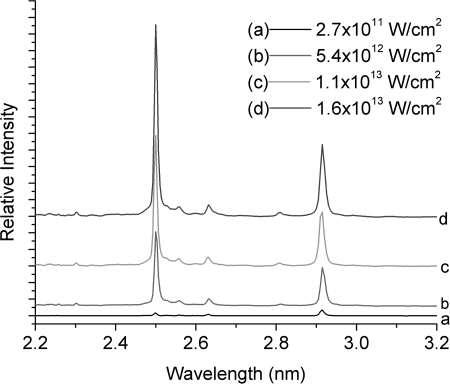
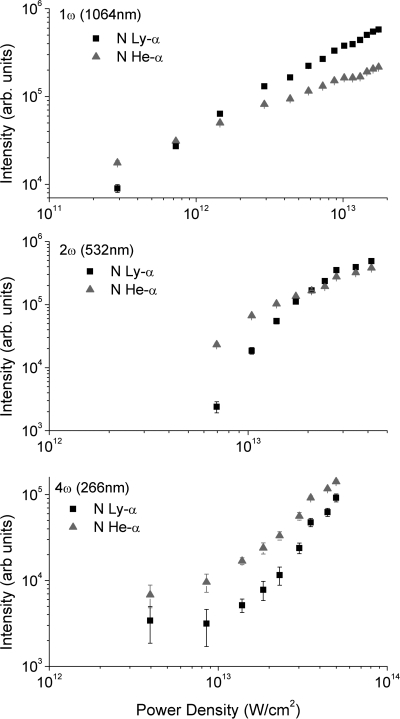
The temperature of the plasma is related to the laser power density, and higher temperatures are expected with increasing power density.26 A set of WW-spectra showing prominent N emission from BN plasma using 1ω Nd:YAG radiation at different power densities are shown in Fig. 3. It can be seen from the spectra that how N Ly-α and He-α intensity changes with increasing power density. The peak intensity for the prominent lines at various power densities is given in Fig. 4. The error bars given in the figure correspond to mean standard deviation obtained from 10 laser shots. The emission intensity trends are wavelength dependent, and both emission lines have similarly shaped trends for the laser wavelength that is used. For 1ω the intensity appears to increases in an approximately linear fashion, 2ω emission begins to reach saturation at higher power densities, and 4ω emission increases exponentially. It is expected that as power density is increased emission from both lines will reach saturation.
Figure 3.
(Color online) Nitrogen SXR-emission spectra from a BN-LPP irradiated by 1ω pulses at four different power densities.
Figure 4.
(Color online) Peak intensity of N Ly-α and He-α emission lines over laser power density for irradiation by 1ω, 2ω, and 4ω.
At low power densities, emission from N He-α is greater than from Ly-α for all laser wavelengths. As power density increases the plasma is heated to a higher temperature and the degree of ionization increases. Emission from N Ly-α increases more than from He-α as a result of the H-like ion density increasing more than the He-like ion density. For 1ω, emission from N Ly-α and He-α equalize at a power density ∼1012 W/cm2, and for 2ω they are equal at ∼2 × 10¹³ W/cm2. The emission intensity at equalization is lower for 1ω than for 2ω. As power density is increased beyond the equalization point emission from N Ly-α becomes greater than from He-α. The laser power densities used for 4ω are too low for N Ly-α emission to equalize with He-α emission, although the intensities converge as power density increases indicating that equalization does take place at a higher power density. These results show that longer laser wavelength tends to produce relatively higher N Ly-α emission than He-α, while shorter excitation wavelength produces relatively higher He-α emission.
As mentioned earlier, spectral emission from the plasma will be influenced by various laser parameters that affect the plasma properties, such as the critical density of the plasma, opacity, etc. In regions where the plasma reaches critical electron density the laser beam will be screened off from the target. The critical electron density for 1ω, 2ω, and 4ω are 1 × 1021 cm−3, 4 × 1021 cm−3, and 1.6 × 1022 cm−3, respectively. Shorter excitation wavelengths can penetrate higher density regions located closer to the target than longer wavelengths, but higher density regions are also relatively opaque and reabsorb a greater amount of plasma emission. Plasma density gradients will affect the size of the optimal heating region for a particular emission line, with lower gradient plasmas having larger optimal heating regions than higher gradient plasmas. One parameter that determines the density gradient in LPP is the spot size, where decreasing spot size increases the density gradient.9 Both laser wavelength and spot size were varied in this experiment and contribute to the trends in line emission intensity.
Ly-α and He-α relative conversion efficiency
The brightness of LPP is one of the primary factors determining their use as x-ray sources for WW-microscopy. High conversion efficiency (CE) of the spectral lines is desirable in order to increase the source brightness and system efficiency. The CE is the ratio of emission energy from the LPP to laser pulse energy. The laser energies used in these experiments are highest and lowest for 1ω and 4ω, respectively, due to the loss during harmonic conversion. Assuming that the intensity of a spectral line peak is proportional to that line’s emission energy, the line peak can be used to measure the relative CE of the laser wavelengths. We also assume that self-absorption in the plasma is negligible. Our spectrograph’s spectral resolution (∼250) is not high enough to measure the self-absorption properties of the emission lines in the LPP.
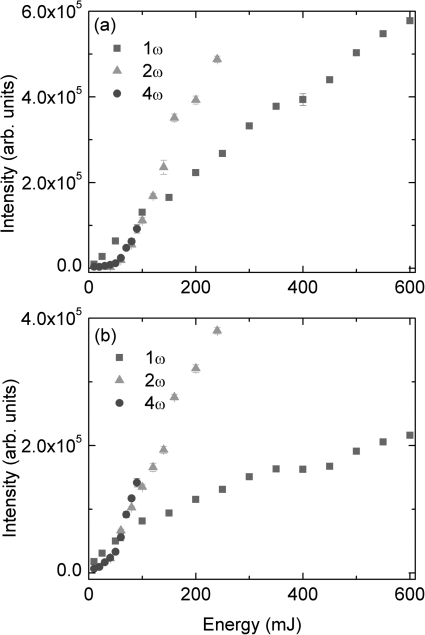
The intensity of N Ly-α and He-α emission versus laser pulse energy is given in Fig. 5a, 5b respectively for the Nd:YAG 1ω, 2ω, and 4ω laser wavelengths. 1ω produces the highest N Ly-α emission for energies less than 100 mJ, and the highest He-α emission for energies less than 50 mJ. At higher energies, 2ω produces higher emission of both lines. N He-α emission produced by 4ω exceeds emission by 2ω at 80 mJ, and a Ly-α emission by 4ω can be expected to exceed emission produced by 2ω at higher energies. According to Fig. 5, under similar laser energy deposition conditions shorter wavelength appears to provide the highest CE. For low 2ω and 4ω energies the emission line intensities follow similar trends for laser energies ≤100 mJ.
Figure 5.
(Color online) Emission intensity of the main N emission lines over energy for irradiation by 1ω, 2ω, and 4ω for (a) N Ly-α and (b) N He-α.
Figure 5 clearly shows that the WW line intensity and hence CE changes with laser energy and excitation wavelength. However, it should be mentioned that the spot sizes used for various laser excitation wavelengths are different in the present study. The optimal value of laser power density for maximum CE has a strong dependence on laser spot size.27 Nevertheless our results show the role of excitation wavelength on WW emission intensities and its energy dependence.
Filtered photodiode measurements
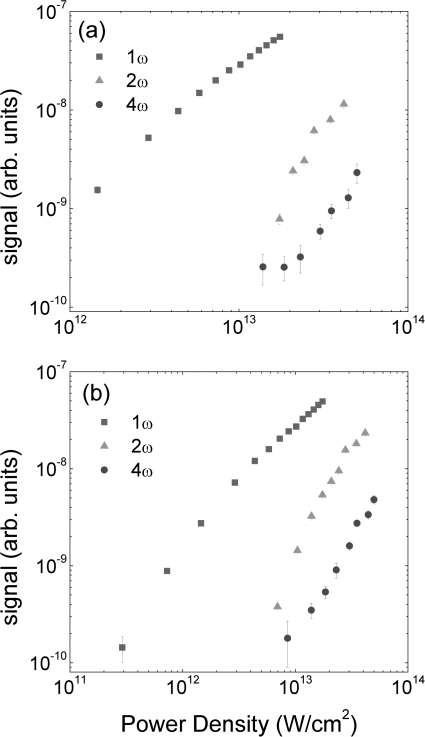
The spectral data shows that BN-LPP emission has strong emission lines and relatively low continuum emission. We used filtered photodiodes, which mainly detect the emission lines within the filter’s bandpass (shown in Fig. 2) and provide a measure of their intensity, as a method to complement spectral intensity data as well as to monitor angular emission features of lines in the WW region. Figure 6 shows the photodiode signal versus power density for 1ω, 2ω, and 4ω laser irradiation. The shape and relative strength of the photodiode signal reflects trends for change in the Ly-α and He-α in Fig. 4. The relative signal strengths in Fig. 6 clearly show that longer excitation wavelength always produces a higher signal at a particular power density. This can also be seen by comparing emission intensities between the plots in Fig. 4.
Figure 6.
(Color online) Photodiode signal over power density for irradiation by 1ω, 2ω, and 4ω gives a measure of the emission line intensity within the filters bandpass. (a) AXUV100Al/Mn2 with bandpass 1.9−3.5 nm, (b) AXUV100Ti/Zr/Al with bandpass 2.8−5 nm.
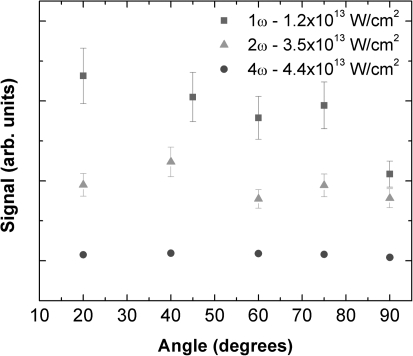
The angular dependence of WW emission from LPP is of importance for a microscopy system because it will determine the positioning of x-ray optics relative to the target in order to maximize the amount of radiation collected. An AXUV100 Ti/Zr/Al was used to measure the emission at various angles relative to the target normal for 1ω, 2ω, and 4ω with near maximum power densities with results given in Fig. 7. The signal for 1ω produced emission shows a decreasing trend as angle is increased. In an EUV study, tin plasma irradiated by Nd:YAG 1ω pulses also showed decreasing emission with increasing angle from the target normal.11 The signal for 2ω and 4ω produced emission is generally uniform for all angles. This suggests that using a shorter excitation wavelength allows more spherical, and uniformly heated plasmas. The more angular uniformity using 266 nm wavelength is also related to smaller spot size used. It has been reported that the plasma expands spherically with decreasing spot size while cylindrical expansion is expected when the spot size is bigger.28
Figure 7.
(Color online) Emission recorded by AXUV100Ti/Zr/Al photodiode spaced from 20° to 90° of the target normal for 1ω, 2ω, and 4ω laser wavelengths with near maximum power densities.
CONCLUSION
We investigated the SXR emission in the water-window region from a BN-LPP. A BN target in vacuum was irradiated by a pulsed Nd:YAG laser operating in the fundamental, second and fourth harmonic at power densities of 1011−1013 W/cm2. Soft x-ray emission was measured by a grazing-incidence spectrograph and two filtered AXUV100 photodiodes. The effect of laser wavelength was determined by changes in the spectral emission lines and photodiode signals. The recorded spectrum shows the N Ly-α and He-α lines are significantly stronger than continuum or other lines in the WW region. The relative intensity of emission between the two lines is dependent on laser wavelength and power density. At lower laser energies Nd:YAG 1ω produces the highest N Ly-α and He-α line emission intensities. As energy is increased 2ω and 4ω provide higher CE than is achieved with fundamental wavelength irradiation.
Complementary data taken by filtered photodiodes are consistent with WW region line emission data taken by grazing-incident spectrograph. The signal trends reflect the trends for the N Ly-α and He-α emission intensity. Angular emission features of WW line showed that shorter laser wavelength provides a more uniform emission distribution, while irradiation by 1ω has decreasing emission as angle from the target normal increases.
ACKNOWLEDGMENTS
This work is supported by the National Institute of Health (Grant No. 5R21RR026220).
References
- Jacobsen C., Trends Cell Biol. 9, 44 (1999). 10.1016/S0962-8924(98)01424-X [DOI] [PubMed] [Google Scholar]
- Adam J. F., Moy J. P., and Susini J., Rev. Sci. Instrum. 76, 091301 (2005). 10.1063/1.2018633 [DOI] [Google Scholar]
- Larabell C. A. and Le Gros M. A., Mol. Biol. Cell 15, 957 (2004). 10.1091/mbc.E03-07-0522 [DOI] [PMC free article] [PubMed] [Google Scholar]
- Larabell C. A., Gu W. W., Etkin L. D., and Le Gros M. A., Differentiation 75, 529 (2007). 10.1111/j.1432-0436.2007.00180.x [DOI] [PubMed] [Google Scholar]
- Schneider G., Guttmann P., Heim S., Rehbein S., Mueller F., Nagashima K., Heymann J. B., Muller W. G., and McNally J. G., Nat. Methods 7, 985 (2010). 10.1038/nmeth.1533 [DOI] [PMC free article] [PubMed] [Google Scholar]
- Horne S. F., Silterra J., and Holber W., J. Phys.: Conf. Ser. 186, 012028 (2009). 10.1088/1742-6596/186/1/012028 [DOI] [PMC free article] [PubMed] [Google Scholar]
- Skoglund P., Lundstrom U., Vogt U., and Hertz H. M., Appl. Phys. Lett. 96, 084103 (2010). 10.1063/1.3310281 [DOI] [Google Scholar]
- Campos D., Harilal S. S., and Hassanein A., Appl. Phys. Lett. 96, 151501 (2010). 10.1063/1.3386524 [DOI] [Google Scholar]
- Harilal S. S., Coons R. W., Hough P., and Hassanein A., Appl. Phys. Lett. 95, 221501 (2009). 10.1063/1.3270526 [DOI] [Google Scholar]
- Harilal S. S., Sizyuk T., Sizyuk V., and Hassanein A., Appl. Phys. Lett. 96, 111503 (2010). 10.1063/1.3364141 [DOI] [Google Scholar]
- Morris O., O’Reilly F., Dunne P., and Hayden P., Appl. Phys. Lett. 92, 231503 (2008). 10.1063/1.2945645 [DOI] [Google Scholar]
- White J., Dunne P., Hayden P., O’Reilly F., and O’Sullivan G., Appl. Phys. Lett. 90, 181502 (2007). 10.1063/1.2735944 [DOI] [Google Scholar]
- Campos D., Harilal S. S., and Hassanein A., J. Appl. Phys. 108, 113305 (2010). 10.1063/1.3493118 [DOI] [Google Scholar]
- Harilal S.S., Sizyuk T., Hassanein A., Campos D., Hough P., and Sizyuk V., J. Appl. Phys. 109, 063306 (2011). 10.1063/1.3562143 [DOI] [Google Scholar]
- Jansson P. A. C., Vogt U., and Hertz H. M., Rev. Sci. Instrum. 76, 043503 (2005). 10.1063/1.1884186 [DOI] [Google Scholar]
- Kim B., Ahn B., Lee D., Kim J., and Kim D., Appl. Phys. Lett. 88, 141501 (2006). 10.1063/1.2192088 [DOI] [Google Scholar]
- Wieland M., Faubel M., Schmidt M., Vogt U., and Wilhein T., Proc. SPIE 4504, 62 (2001). 10.1117/12.448479 [DOI] [Google Scholar]
- Takman P. A. C., Stollberg H., Johansson G. A., Holmberg A., Lindblom M., and Hertz H. M., J. Microsc. Oxford 226, 175 (2007). 10.1111/j.1365-2818.2007.01765.x [DOI] [PubMed] [Google Scholar]
- Berglund M., Rymell L., Hertz H. M., and Wilhein T., Rev. Sci. Instrum. 69, 2361 (1998). 10.1063/1.1148944 [DOI] [Google Scholar]
- Lebert R., Schriever G., Wilhein T., and Niemann B., J. Appl. Phys. 84, 3419 (1998). 10.1063/1.368502 [DOI] [Google Scholar]
- Lim J.-H., Nam K.-Y., Kim K.-W., Kwon Y.-M., Park J.-G., Min J. H., Son H.-H., Min J.-Y., and Yoon K.-H., Proc. SPIE 5918, 59181B (2005). 10.1117/12.626319 [DOI] [Google Scholar]
- Fiedorowicz H., Bartnik A., Jarocki R., Szczurek M., and Wilhein T., Appl. Phys. B 67, 391 (1998). 10.1007/s003400050521 [DOI] [Google Scholar]
- Wachulak P. W., Bartnik A., Fiedorowicz H., Rudawski P., Jarocki R., Kostecki J., and Szczurek M., Nucl. Instrum. Methods Phys. Res. B 268, 1692 (2010). 10.1016/j.nimb.2010.02.002 [DOI] [Google Scholar]
- Fiedorowicz H., Bartnik A., Horvath M., Juha L., Jungwirth K., Kralikova B., Krasa J., Mocek T., Pfeifer M., Pina L., Skala J., Ullschmied J., and Wawer J., Proc. SPIE 4502, 47 (2001). 10.1117/12.449852 [DOI] [Google Scholar]
- Altenbernd D., Teubner U., Gibbon P., Forster E., Audebert P., Geindre J. P., Gauthier J. C., Grillon G., and Antonetti A., J. Phys. B 30, 3969 (1997). 10.1088/0953-4075/30/17/021 [DOI] [Google Scholar]
- Atwee T., Harilal S. S., and Kunze H. J., J. Phys. D 34, 1213 (2001). 10.1088/0022-3727/34/8/312 [DOI] [Google Scholar]
- Miyamoto S., Shimoura A., Amano S., Fukugaki K., Kinugasa H., Inoue T., and Mochizuki T., Appl. Phys. Lett. 86 261502 (2005). 10.1063/1.1968415 [DOI] [Google Scholar]
- Harilal S. S., J. Appl. Phys. 103, 123306 (2007). 10.1063/1.2822450 [DOI] [Google Scholar]


