

Abstract
Hepatitis C virus (HCV) replicates preferentially in the liver, and in most cases, the HCV infection becomes chronic and often results in hepatocellular carcinoma. When the HCV plus-strand RNA genome has been delivered to the cytosol of the infected cell, its translation is directed by the internal ribosome entry site (IRES) in the 5′-untranslated region (5′-UTR) of the viral RNA. Thereby, IRES activity is modulated by several host factors. In particular, the liver-specific microRNA-122 (miR-122) interacts with two target sites in the HCV 5′-UTR and stimulates HCV translation, thereby most likely contributing to HCV liver tropism. Here, we show that HCV IRES-dependent translation efficiency in the hepatoma cell line Huh7 is highest during the G0 and G1 phases of the cell cycle but significantly drops during S phase and even more in the G2/M phase. The superimposed stimulation of HCV translation by ectopic miR-122 works best during G0, G1 and G2/M phases but is lower during S phase. However, the levels of Ago2 protein do not substantially change during cell cycle phases, indicating that other cellular factors involved in HCV translation stimulation by miR-122 may be differentially expressed in different cell cycle phases. Moreover, the levels of endogenously expressed miR-122 in Huh7 cells are lowest in S phase, indicating that the predominant G0/G1 state of non-dividing hepatocytes in the liver facilitates high expression of the HCV genome and stimulation by miR-122, with yet-unknown factors involved in the differential extent of stimulation by miR-122.
Key words: HCV, translation, miR-122, microRNA, miRNA, Ago, Ago2
Introduction
Hepatitis C virus (HCV) is one of the major agents causing human hepatitis, often leading to chronic hepatitis, liver cirrhosis and hepatocellular carcinoma (HCC).1 Due to the diffuse clinical signs of HCC, the patients often present late, and only 10–20% of hepatocellular carcinomas can be completely removed by surgery, leading to a poor prognosis with 60% recrudescence. Consequently, there is an urgent need to better understand the molecular mechanisms underlying HCV replication in the liver.
The 9,600 nucleotide HCV RNA genome is of positive polarity and thus can serve directly as the template for translation of the viral polyprotein (see Fig. 1A).3 The open reading frame is flanked by the 5′- and 3′-untranslated regions (UTRs) that contain the cis-signals for translation and replication of the viral RNA. The stem-loops II–IV of the 5′-UTR constitute the internal ribosome entry site (IRES) that directs cap-independent translation of the viral genome4 in the cytosol, avoiding the need for nuclear RNA processing events for genome translation.
Figure 1.

The HCV genome and reporter RNAs. (A) The HCV RNA genome is shown with the 5′- and 3′-UTRs flanking the open reading frame (ORF) for the polyprotein, which, after processing, yields the virus structural proteins and the non-structural (NS-) replication proteins. In the 5′-UTR, the stem-loops II through IV plus a few coding nucleotides form the IRES. The two microRNA-122 target sequences between stem-loops I and II are shown as boxes. (B) The monocistronic HCV reporter RNA2 contains the HCV 5′-UTR plus partial coding core sequences, followed by the firefly luciferase (Fluc) gene and the HCV 3′-UTR. (C) The capped Renilla luciferase (Rluc) reporter RNA with a poly(A)-tail of about 200 A residues.
The fact that HCV replicates preferentially in the liver implies that the viral life cycle depends on factors primarily expressed in liver cells. Besides cellular surface receptors,5 the microRNA-122 (miR-122) that is expressed almost exclusively in the liver6–8 may also contribute to HCV liver tropism. microRNAs (miRNAs) are small RNAs that act in post-transcriptional gene regulation.9 Mature miRNAs are incorporated in microRNA-protein (miRNP) complexes, including Argonaute (Ago), and usually guide the miRNP complex to target sequences in the 3′-UTRs of cellular mRNAs. Binding of the miRNP complex then usually results in translation repression.9 However, under certain circumstances stimulation of translation by miRNAs is also possible. Vasudevan and coworkers reported that in the serum-starved G0 state, the expression of an mRNA can be stimulated by a microRNA binding to the mRNA's 3′-UTR.10,11 The expression of some ribosomal protein mRNAs can also be stimulated by a microRNA, but in this case the miRNA binds in the mRNA's 5′-UTR instead of in the 3′-UTR.12
The finding by Peter Sarnow's group that the liver-specific miR-122 stimulates HCV RNA genome accumulation13 was the first report that a viral RNA recruits a cellular microRNA to promote its propagation. Surprisingly, this interaction of miR-122 takes place in the HCV 5′-UTR but not in the 3′-UTR. There, miR-122 interacts with two closely adjacent target sites. We have detailed this stimulation by miR-122 to occur at least in part at the stage of translation initiation.14,15 However, miR-122 may also contribute to elevated HCV replication at other steps of the viral life cycle.16–18 Also, HCV appears to use components of the mRNA decay machinery, including LSm1–7, to somehow switch from translation to replication of the genome.19 An approach to explore the therapeutic potential of anti-miR-122 antisense oligonucleotides revealed that HCV propagation in chimpanzee liver can be largely reduced.20 However, a role of miR-122 in facilitating the development of HCC during chronic HCV infection is still unclear.21
In this study, we investigated the efficiency of HCV translation during the different phases of the cell cycle in the human hepatoma cell line Huh7. Moreover, we analyzed the degree of translation stimulation by miR-122 in the cell cycle phases. Our results show that the extent of HCV translation stimulation by miR-122 varies during the cell cycle like the levels of the endogenously expressed miR-122. Ago2 levels do not substantially vary during cell cycle, suggesting that other factors may be involved in the differing extents of HCV translation stimulation by miR-122.
Results
Translation of the HCV genome is regulated by the IRES element that resides in the 5′-UTR and slightly extends to the core coding region to form the AUG containing stem-loop IV at the translation start site (see Fig. 1A). In addition, IRES activity is stimulated by the 3′-UTR.2 In order to analyze the translation efficiency of HCV RNA during the cell cycle, we therefore used an HCV reporter RNA that contains the firefly luciferase (Fluc) reporter gene, flanked by the HCV 5′- and 3′-UTRs (Fig. 1B), with HCV sequences extending from the 5′-UTR into partial core coding sequences to ensure IRES integrity. The HCV reporter RNA was chosen monocistronic to avoid collateral cis-effects of additional IRES elements on translation.22 To assure the authentic integrity of the 3′-end, PCR-generated templates were used for transcription of the HCV reporter RNA.2,14 As a control RNA, we used a capped and polyadenylated Renilla luciferase (Rluc) reporter RNA without miR-122 binding sites (Fig. 1C).
In our hands, the synchronization of Huh7 hepatoma cells was not satisfactory using established protocols.23 Huh7 cells could not be synchronized in the G0 phase by serum starvation10 due to a high rate of cell death. Instead, the cells were grown to confluency and subjected to contact inhibition (Fig. 2A). G0-phase conditions were validated by the presence of p27kip1 (Fig. 2B, lane 2).24 G1-phase cells were obtained from such G0-phase cells by splitting and allowing them to proceed into G1 phase; G1-phase conditions were validated by the absence of p27kip1 (Fig. 2B, lanes 3–5). Huh7 cells in the G2/M phase were harvested by a combination of first blocking mitosis with nocodazole and then collecting rounded mitotic cells using mechanic “shakeoff.” For S phase, the established double thymidine block23 was revealed to be insufficient to accumulate most Huh7 cells in S phase. Therefore, we first arrested the cells during mitosis with nocodazole and collected rounded mitotic cells by shake-off, washed off the nocodazole to allow the cells to proceed through the cell cycle and then slowed down this pre-synchronized cell population in S phase using thymidine (Fig. 2A).
Figure 2.

Analyses of synchronized Huh7 cells. (A) Upper part: unsynchronized control cells, stained with propidium iodide (PI) and analyzed by FACS. Lower part: Huh7 hepatoma cells synchronized in the G0, G1, S and G2/M phase of the cell cycle. (B) p27kip1 western blot of G0 cells and G1 cells harvested at the times after release from contact inhibition as indicated (upper part). GAPDH was analyzed as loading control (lower part).
When these synchronized Huh7 cells were transfected with the HCV Fluc reporter RNA, we found that IRES activity was by far highest during the G0 and the G1 cell cycle phases (Fig. 3A). In contrast, HCV IRES activity dropped significantly during S phase and, to our surprise, even more during the G2/M phase. In comparison, the translation activity of the capped and polyadenylated Rluc control mRNA largely coincides with this drop in translation efficiency in the S and G2/M phases (Fig. 3B).
Figure 3.
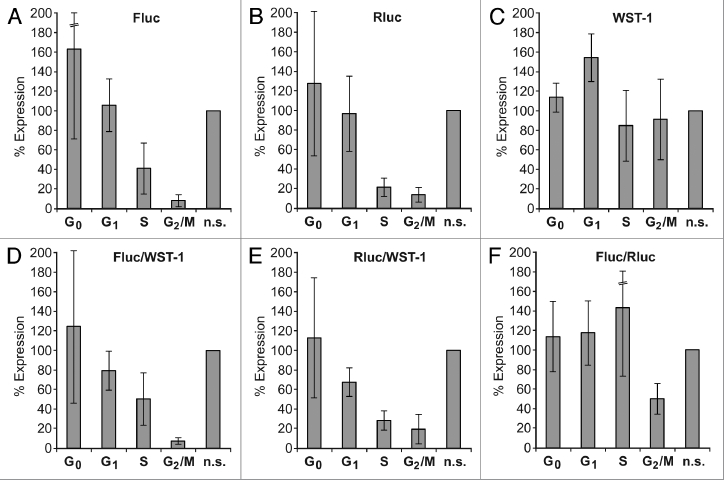
Reporter translation efficiencies in synchronized cells. The HCV-Fluc reporter RNA (see Fig. 1B) was transfected together with the capped and polyadenylated Rluc reporter RNA (see Fig. 1C) into Huh7 cells synchronized to the cell cycle phases as indicated. Non-synchronized cells (n.s.) were used as controls. Fluc (A) and Rluc (B) activities were measured 2 h post transfection. Metabolic activity of the cells was measured with the WST-1 assay (C). Values were normalized to 100% for the corresponding activities in non-synchronized control cells. Here, mean values and standard deviations (error bars) of several assays are shown. The Fluc and Rluc values were also normalized to the metabolic activity measured by the WST-1 assay (D and E). The Fluc/Rluc ratio is shown in (F).
Normalization of the Fluc readings monitoring HCV IRES activity was then a difficult issue. The frequently used Fluc/Rluc ratio (Fig. 3F) visualizing the “relative HCV IRES activity” compared with cap-dependent translation activity appears largely misleading in this case, because the seeming increase in the Fluc/Rluc ratio in S phase is mainly due to the sharp drop in the Rluc readings for cap-dependent translation (compare Fig. 3B). However, measuring the metabolic activity of the synchronized cell populations with the respiratory chain substrate WST-1 revealed that the activity of the cells was largely in the same range in different cell cycle phases (Fig. 3C shows the average of several WST-1 readouts) and also largely coincides with cell number (not shown). Therefore, the measurement of metabolic activity by the WST-1 assay appeared to be the most reliable parameter for normalization of translation activity in different cell cycle phases (Fig. 3D and E). When the Fluc values for HCV IRES activity were normalized to the corresponding WST-1 readouts, the result confirmed that HCV translation efficiency slightly drops in S phase but is significantly low during the G2/M phase (Fig. 3D).
Next, we tested the ability of Huh7 cells synchronized in different cell cycle phases to confer microRNA-122-mediated stimulation of HCV IRES activity. The HCV reporter RNA was transfected in the absence and in the presence of additional ectopic miR-122 duplex precursor,14 and Fluc and WST-1 activities were determined. The values obtained for HCV translation efficiency in the presence of ectopically added miR-122 were normalized to the values obtained in the absence of added miR-122. The results (Fig. 4A and B) show that the extent of stimulation by the added ectopic miR-122 is highest during the G2/M phase, followed by the G0 and G1 cell cycle phases (please note that Huh7 cells contain a certain amount of endogenous miR-1227,14). In contrast, in S phase, the ability of the Huh7 cells to confer HCV translation stimulation by miR-122 is lowest. Similar results were obtained with HeLa cells (Fig. 4C and D), which do not contain endogenous miR-122, suggesting that the differences in the ability of the cells to stimulate HCV translation by miR-122 do not primarily depend on the availability of endogenous miR-122 but on the availability of other cellular factors mediating microRNA function.
Figure 4.

Stimulation of HCV translation by miR-122 during the cell cycle. (A) The HCV-Fluc reporter RNA was transfected together with capped and polyadenylated Rluc reporter RNA into synchronized or non-synchronized Huh7 cells in the absence or presence of miR-122 duplex precursors as indicated. Fluc and WST-1 activities were determined as described in Figure 3. (B) Fluc values from (A) normalized to metabolic activity (Fluc/WST-1). (C) Analysis of HCV translation stimulation by miR-122 as in (A) but in HeLa cells. (D) Fluc/WST-1 values for the experiment shown in (C).
To elucidate whether the differing extents of stimulation of HCV translation by miR-122 in cells in different cell cycle phases coincides with variations in the amounts of microRNA-protein complex key components, we first analyzed the amounts of endogenous miR-122 present in the cells. Total RNAs corresponding to equal cell numbers from each cell cycle phase were separated by gel electrophoresis, and miR-122 was detected in RNA gel blots (Fig. 5A and E). U6 snRNA was used as a control. In Huh7 hepatoma cells (Fig. 5A), miR-122 was present in S-phase cells in the lowest amounts (lane 3) compared with the other cell cycle phases (lanes 2 and 4), indicating that the cellular miR-122 expression and processing was reduced during S phase. In contrast, HeLa cells do not contain endogenous miR-122 (Fig. 5E).
Figure 5.

Detection of miRNP complex components during the cell cycle. Left parts (A–D): Huh7 cells; right parts (E–H): HeLa cells. (A) Northern blot detecting microRNA-122. Lanes 2–5 show the small RNAs from cells synchronized to the cell cycle phases as indicated. Total RNA amounts were normalized to cell numbers before loading. RNAs extracted from each 1.4 × 10⁸ cells was loaded per lane. In lanes 1 and 6, each 2 ng of miR-122 were applied as positive control. U6 snRNA was detected as a control. (B) Total RNA ethidium bromide stain of the samples shown in (A) as gel loading control. (C) Western blot with an anti-Ago 2 antibody. Lanes 1–3 show the proteins from cells synchonized to the cell cycle phases as indicated, lane 4 from non-synchronized cells. Total protein amounts were normalized to cell numbers before loading, with cell extracts from each 2 × 10⁴ cells loaded per lane. (D) Poinceau S stain of the gel shown in (C) as loading control. (E–H) Assays like in (A–D) but with HeLa cells.
Moreover, we analyzed the amounts of Argonaute 2 (Ago2) protein in the cells (Figs. 5C and G). In Huh7 cells, the results revealed were somewhat variable. Despite to careful normalization of the loaded protein amounts per lane to cell numbers (extracts from equal cell numbers were loaded on each lane), in some cases less Ago2 was detected in S phase compared with the other cell cycle phases, while in other experiments no significant differences in the amounts of Ago2 between cell cycle phases could be detected (Fig. 5C). Thus, differences in the levels of Ago2 protein in Huh7 cells obviously are not the prime reason for the differences in the ability of the cells to stimulate HCV translation by added ectopic miR-122. Also in HeLa cells, no significant changes in Ago2 levels through the cell cycle phases could be detected (Fig. 5G). In conclusion, other yet-unknown cellular factors may be responsible for these differences in the ability of the cells to confer miR-122 function on HCV translation.
Taken together, the basal HCV translation efficiency is highest in the G0 and G1 phase in Huh7 cells but lower in S-phase cells, whereas HCV IRES activity is very low in G2/M-phase cells. The stimulation by the liver-specific microRNA-122 is then superimposed as a second layer of HCV expression regulation on this basal translation efficiency. This stimulation of HCV translation by miR-122 is low in S phase but higher in the G0 and G1 phases of the cell cycle. Consequently, HCV IRES overall activity in miR-122 containing hepatocytes appears to be adapted to be highest in the G0 and G1 phases of the cell cycle, i.e., during the normal state of metabolically active G0/G1 arrested hepatocytes in the liver.
Discussion
In this study, we have investigated the efficiency of HCV translation and the extent of stimulation by the liver-specific microRNA-122 during the different cell cycle phases. We find two superimposed patterns of regulation. On the one hand, basal HCV translation efficiency is high during G0 and G1 phases, but it is considerably reduced during S phase and dramatically reduced in G2/M. By that, basal HCV translation efficiency roughly coincides with that of a capped and polyadenylated Rluc mRNA. The latter result is consistent with the finding that, during mitosis, translation in the cell is suppressed by two mechanisms: eIF2α phosphorylation reduces overall protein synthesis,25,26 and cap-dependent translation in particular is reduced by inhibition of eIF4E activity.27,28 However, the low activity of the HCV IRES does not support the widespread assumption that IRES elements may be quite active under the conditions of the M phase, when the efficiency of cap-dependent translation of cellular mRNAs is low.
Consistent with our results, Venkatesan and coworkers also found that HCV translation efficiency is low in the G2/M phase of the cell cycle.29 Moreover, these researchers also reported that the ratio of HCV translation relative to the expression of the control RNA (Fluc/Rluc ratio) was highest in S phase. In our study, we also saw a high Fluc/Rluc ratio in S phase and a drop of this ration in the G2/M phase (Fig. 3F); in this respect, our data largely correlate with those of the Venkatesan study.29 However, from our data in Figure 3A and B, it is evident that this elevated Fluc/Rluc ratio in S phase is mostly due to a strong decrease in cap-dependent Rluc expression rather than due to an increase in HCV expression. In contrast to the results of the Venkatesan study and to our results presented here, Honda and coworkers reported a high level of HCV translation in the G2/M phase.30 However, in that study, no more than 50% of the cells were in the G2/M phase at any time, leaving the possibility that perhaps most of the expression measured at the time of the G2/M cell peak could have been due to G1 cells that translate HCV quite efficiently, while the contribution of G2/M-phase cells to the overall HCV translation efficiency of that mixed cell population may have been less at that time point. Here, we have synchronized the cells in the G2/M phase by optimized protocols, thereby avoiding any contamination of the G2/M cells with G1-phase cells (compare Fig. 2), and the results show that in such G2/M phase cells, the efficiency of HCV expression is quite low (Fig. 3A).
A different pattern of stimulation of HCV translation by miR-122 is superimposed on the pattern of different efficiencies of HCV translation in different cell cycle phases. This stimulation works best during the G0, G1 and G2/M phases but is lower during S phase. We can only speculate about the mechanism of HCV translation stimulation by miR-122 during the cell cycle phases. Testing the obvious assumption that Ago2 protein may be involved in conferring HCV translation stimulation by miR-122, we checked Ago2 levels during the cell cycle stages. The results were somewhat variable. In some assays, a drop of Ago2 levels during S phase was observed in the Huh7 cells, whereas in other assays, Ago2 levels decreased only slightly or not at all during S phase, suggesting that cellular factors other than Ago2 may be limiting in conferring miR-122-mediated stimulation of HCV translation in S phase. Clearly, such cell cycle-dependent variations in the availability of cellular factors may be the reason for switches in miRNA-mediated repression vs. translation activation. Vasudevan and coworkers found that repression of mRNA translation by microRNAs can switch to activation when the cells are arrested in the G0 phase of the cell cycle by serum starvation or by contact inhibition,10,11 and Lin and coworkers have demonstrated that translation of an mRNA with the KLF4 cis-element located in its 3′-UTR can be activated in 24 h post-confluent cells,31 suggesting that the observed activation of mRNA translation by microRNAs in arrested cells is an optional mechanism mediated by microRNAs. A candidate protein that may be differentially involved in translation activation by microRNAs is FXR1, which is enriched in serum-starved cells that allow translation activation.10 In folliculated Xenopus oocyctes, activation of the cAMP/PKA pathway can result in translation activation by a microRNA, whereas this is not the case in defolliculated cells, again indicating that activation of distinct cellular factors can be involved in a switch from translation repression to activation by a microRNA.32
Consistent with our finding that HCV expression is most efficient during the G0 and the G1 phase, which is the state of most hepatocytes in normal liver tissue, HCV proteins appear to be involved in stabilization of these phases. The HCV core protein was reported to contribute to G0 arrest by stabilization of p27kip133 and to support G1 arrest by suppression of cyclin-dependent kinase-activating kinase.34 Moreover, HCV NS2 protein was reported to induce cell cycle arrest in S phase through downregulation of cyclin A expression.35 All these regulatory interventions by HCV proteins may aim at holding the hepatocytes in those cell cycle phases that most efficiently allow HCV translation and replication. Later in persistent HCV infections, the induction of cell proliferation may become more important for reasons yet unknown. By virtue of the interaction of the NS5B replicase with the retinoblastoma (Rb) tumor suppressor protein, HCV induces downregulation of Rb,36 and HCV was found to promote cell proliferation by different mechanisms, including the upregulation of cyclin E expression levels.37
The role of miR-122 in later stages of chronic HCV infection and the development of hepatocellular carcinoma is not clear. miR-122 appears to upregulate hepatocyte lipid and cholesterol metabolism38,39 and acts as a regulator that maintains an adult liver phenotype by driving the hepatocyte's metabolism toward a differentiated state. This idea is corroborated by the finding that the differentiation of liver tissue in developing mouse embryos correlates with increasing miR-122 levels.7 HCV has adapted to the high levels of miR-122 in the normal hepatocyte and recruits miR-122 to support its translation14,15 and replication.13,16–18 In contrast, with ongoing carcinogenesis miR-122 expression appears to be downregulated in the majority of HCC cases that were analyzed for their miR-122 levels.40–42 However, this is not true for all cases of HCC, i.e., the downregulation of miR-122 cannot be taken as a general indication of HCC. The development of HCC is a complex process that can be triggered by many different events,21 and the possibility cannot be excluded that the mere sequestration of miR-122 upon HCV infection at least makes its contribution to hepatocyte dedifferentiation. Such a reduction of miR-122 levels could result in elevated cyclin G1 levels,39,41,43 and cell cycle promotion by cyclin G1, in turn, could, in the long-term, contribute to promote a dedifferentiated state of the hepatocytes.
Our results indicate that in the early phase of infection efficient HCV translation appears to be optimized to the conditions of the regular G0/G1 state of non-dividing hepatocytes in the liver.
Materials and Methods
Plasmids and oligonucleotides.
The HCV reporter plasmid pHCV-Fluc-3′-UTR contains a T7 promoter fused exactly to the HCV 5′-UTR [nucleotides (nts) 1–341] plus 262 nts of the core-coding sequence, a ubiquitin sequence, the firefly luciferase (Fluc) gene and the entire HCV 3′-UTR.14 phRL-null (Promega) contains the Renilla luciferase (Rluc) gene downstream of a T7 promoter and was used to yield the co-transfected control RNA.14 The corresponding RNAs are illustrated in Figure 1. DNA oligonucleotides for template PCR were supplied by Biomers. The sequences were HCV-for, 5′-CTT TCC AAA ATG TCG TAA CAA CTC CGC CC-3′ (upstream of T7 promoter); HCV-3X-rev, 5′-ACA TGA TCT GCA GAG AGG CCA GTA TCA G-3′ (reverse at HCV 3′-end). RNA oligonucleotides were supplied by Biomers. The sequences were: miR-122 mat, 5′-(PHOS)UGG AGU GUG ACA AUG GUG UUU G-3′; miR122*, 5′-(PHOS)AAC GCC AUU AUC ACA CUA AAU A-3′. MiRNA-duplexes were formed between the guide (mat) and its complementary passenger strand (*).
RNA synthesis.
Templates for HCV reporter RNAs were amplified by PCR from HCV reporter plasmids to ensure the generation of accurate authentic 3′-ends of the RNA. PCR fragments were purified by proteinase K digestion, phenol/chloroform extraction and ethanol precipitation, dissolved in water and used for transcription using T7 RNA polymerase. In vitro transcription was performed in the presence of 500 µM NTPs. Capped Rluc control RNA was synthesized with each 500 µM ATP, CTP and UTP, 50 µM GTP and 500 µM m7GpppG. Capped RNA were polyadenylated using Poly(A)-Polymerase (USB) to a poly(A)-tail length of about 200 nucleotides. After transcription, reactions were treated with RNase-free DNase I, and RNA was purified with RNeasy kits (Qiagen). The integrity of RNAs was checked by agarose gel electrophoresis. Concentrations of RNAs were determined by gel images and photometric analyses.
Cells and transfections.
Cells were maintained at 37°C at 5% CO2 in Dulbecco's modified Eagle medium (DMEM) with L-glutamine, 4,500 mg/L D-glucose (Invitrogen), 10% fetal bovine serum (FBS), 100 U/ml penicillin and 100 µg/ml streptomycin (DMEM work medium). Liposome mediated transfection of 400 ng HCV reporter RNA and 400 ng miR duplexes per well (plus 20 ng of capped and polyadenylated co-transfected Rluc reporter RNA, if appropriate) was performed at the time indicated using Lipofectamine 2000 (Invitrogen) according to the manufacturer's protocol. If appropriate, metabolic activity of the cells was measured 30 min before lysis using the WST-1 assay (Roche) according to the manufacturer's protocol, with the exception that the WST-1 reagent was diluted 1:50 and incubated for 30 min on the cells.44 The WST-1 measures respiratory chain activity and thus compares total (mitochondria containing) cytoplasma masses between wells. For extract preparation, the WST-1 reagent was washed off with PBS, and the cells were lysed in 150 µl passive lysis buffer (PLB, Promega). Nuclei were removed by centrifugation for 5 min at 5,000x g, and each 20 µl of the supernatant was used for measuring Fluc and Rluc activity.44,45
Cell synchronization.
To obtain homogeneous populations of Huh7 cells synchronized in different phases of the cell cycle, different methods23 needed to be employed with modifications. For the G0 phase of the cell cycle, cells were grown to confluency in DMEM work medium. After reaching 100% confluency, the cells were further incubated for another 24 h. Then the cells were washed twice with PBS, and the confluent cells were transfected in the original plate. 1.5 h post transfection (pt) WST-1 reagent was added. At 2 h after transfection, the WST-1 reagent was collected and the OD measured. The cells were washed with PBS, lysed with PLB, nuclei were removed, and luciferase activities were measured. For checking the cell cycle phase by fluorescence activated cell sorting (FACS) in parallel, the cells were grown in a 15-cm dish. After the 24 h post confluency incubation, the cells were detached from the plates by trypsinization, stained with propidium iodide (PI) and subjected to FACS analysis. The G0 phase was validated by a strongly positive p27kip1 western blot.24,46
For cells that are synchronized in the G1 phase, G0 phase cells prepared as above were detached after the 24 h post confluency incubation by trypsinization, split into new dishes and grown in DMEM work medium. Two hours after splitting, the adhering cells were transfected. 1.5 h pt the WST-1 reagent was added. At 2 h after transfection, the WST-1 reagent was collected and the OD measured. The cells were washed with PBS, lysed with PLB, nuclei were removed, and luciferase activities were measured. For control purposes, cells were stained with PI and subjected to FACS analyses. The G1 phase was validated by a negative p27kip1 western blot.
For cells synchronized in the G2/M phase of the cell cycle, cells were grown to 40–50% confluency in two 15-cm dishes. Medium was changed to DMEM work medium including 400 ng/ml nocodazole to inhibit microtubule polymerization and incubated for another 17 h at 37°C (5% CO2). Then, cells were washed once with PBS, and most of the PBS was carefully removed. In the remaining PBS, rounded mitotic cells were then mechanically detached from the plate by rigid horizontal tapping (“shake-off”). The detached mitotic cells were transferred to new dishes and incubated with DMEM work medium. When these cells were attached to the plate 2 h after transfer, they were transfected. 1.5 h later, WST-1 was added. 2 h after transfection, the WST-1 reagent was collected and OD measured; the cells were washed with PBS, lysed and luciferase activities measured as above. As controls, cells were harvested and stained with PI for FACS analyses.
For cells synchronized in the S phase of the cell cycle, cells were grown in two 15-cm dishes treated with nocodazole, and rounded mitotic cells harvested by shake-off as above. The synchronized mitotic cells were then plated and incubated with DMEM work medium for 8 h. Then, thymidine was added to 2 mM and the cells incubated for another 18 h. During this time, all cells proceed through the cell cycle and are slowed down at the beginning of S phase. The thymidine medium was then washed off with PBS, DMEM work medium added, and the cells incubated for another 5 h to further proceed into S phase. At 5 h after washing off the thymidine, the S-phase cells were transfected. As control, untransfected cells were harvested at this time and stained with PI for FACS analysis. WST-1 and luciferase activities were determined 2 h after transfection as above. All the above synchronization protocols had been extensively optimized according to FACS analyses of PI stained cells at various time points.
RNA analyses.
First, cells were counted for normalization in northern and western blots. RNAs were then isolated using PeqGold TriFast (Peqlab) according to the manufacturer's protocol and resuspended in double distilled water. The volumes were adjusted according to the cell numbers determined before to load RNA amounts corresponding to equal numbers of cells from each cell cycle phase to the RNA gel blot gel. RNA gel blots were performed essentially as described previously in reference 14. A minimum of 20 µg of total RNA was used from the S phase cells to allow detection of miR-122, and the RNA amounts from cells in the other cell cycle phases were adjusted according to the same number of cells. The RNAs were separated on a 15% polyacrylamide gel and transferred to a nylon membrane. Hybridization was performed overnight at 50°C, with 50 pmol of a DIG labeled probe matching either miR-122 or human U6 snRNA. The sequences of the probes are anti-mi-122: 5′-ACA AAC ACC ATT GTC ACA CTC CA-3′; anti U6 (hra-U6): 5′-GCA GGG GCC ATG CTA ATC TTC TCT GTA TCG-3′. After hybridization the DIG labeled probes were detected with alkaline phosphataseconjugated antibodies using standard protocols.
Western blots.
Lysate volumes were adjusted equivalent to the same number of cells per volume in each sample. The proteins were separated on an 8% polyacrylamide gel and blotted on PDVF membranes. Staining of the membranes with primary and secondary antibodies was performed according to Rüdel et al.47 The anti-Ago2 rat monoclonal antibody 11A9 (kindly provided by G. Meister, Regensburg) was diluted 1:100. A light chain specific goat-anti-rat peroxidase (POD) (1:20,000) was used as secondary antibody. Gels were stained with Poinceau S for loading control. The p27Kip1 and glyceraldehyde-3-phosphate-dehydrogenase (GAPDH) western blots were performed with a standard protocol using a 1:500 dilution of a p27Kip1 antibody (BioLegend) and a 1:10,000 dilution of a GAPDH antibody (HyTest) in 5% skim milk.
Acknowledgments
We thank Gunter Meister (Regensburg) for anti-Ago antibodies, Shobha Vasudevan (Boston) for advice on the cell synchronization protocols and Lienhard Schmitz (Giessen) for advice with the FACS analyses. This work was supported by grants of the Deutsche Forschungsgemeinschaft, DFG (SFB 535, IRTG 1384, Ni 604/1-1, Ni 604/2-1), and the Universitätsklinikum Giessen und Marburg GmbH (§2 Abs. 3 KOOPV).
Abbreviation
- HCV
hepatitis C virus
- IRES
internal ribosome entry site
- miRNA
microRNA
- miR-122
microRNA-122
- miRNP complex
microRNA-protein complex
- eIF
eukaryotic initiation factor
- UTR
untranslated region
Disclosure of Potential Conflicts of Interest
No potential conflicts of interest were disclosed.
References
- 1.Spangenberg HC, Thimme R, Blum HE. Evolving therapies in the treatment of hepatocellular carcinoma. Biologics. 2008;2:453–462. doi: 10.2147/btt.s3254. [DOI] [PMC free article] [PubMed] [Google Scholar]
- 2.Song Y, Friebe P, Tzima E, Jünemann C, Bartenschlager R, Niepmann M. The hepatitis C virus RNA 3′-untranslated region strongly enhances translation directed by the internal ribosome entry site. J Virol. 2006;80:11579–11588. doi: 10.1128/JVI.00675-06. [DOI] [PMC free article] [PubMed] [Google Scholar]
- 3.Poenisch M, Bartenschlager R. New insights into structure and replication of the hepatitis C virus and clinical implications. Semin Liver Dis. 2010;30:333–347. doi: 10.1055/s-0030-1267535. [DOI] [PubMed] [Google Scholar]
- 4.Niepmann M. Internal translation initiation of picornaviruses and hepatitis C virus. Biochim Biophys Acta. 2009;1789:529–541. doi: 10.1016/j.bbagrm.2009.05.002. [DOI] [PubMed] [Google Scholar]
- 5.Perrault M, Pecheur EI. The hepatitis C virus and its hepatic environment: a toxic but finely tuned partnership. Biochem J. 2009;423:303–314. doi: 10.1042/BJ20091000. [DOI] [PubMed] [Google Scholar]
- 6.Sempere LF, Freemantle S, Pitha-Rowe I, Moss E, Dmitrovsky E, Ambros V. Expression profiling of mammalian microRNAs uncovers a subset of brain-expressed microRNAs with possible roles in murine and human neuronal differentiation. Genome Biol. 2004;5:13. doi: 10.1186/gb-2004-5-3-r13. [DOI] [PMC free article] [PubMed] [Google Scholar]
- 7.Chang J, Nicolas E, Marks D, Sander C, Lerro A, Buenda MA, et al. miR-122, a mammalian liver-specific microRNA, is processed from hcr mRNA and may downregulate the high affinity cationic amino acid transporter CAT-1. RNA Biol. 2005;1:106–113. doi: 10.4161/rna.1.2.1066. [DOI] [PubMed] [Google Scholar]
- 8.Landgraf P, Rusu M, Sheridan R, Sewer A, Iovino N, Aravin A, et al. A mammalian microRNA expression atlas based on small RNA library sequencing. Cell. 2007;129:1401–1414. doi: 10.1016/j.cell.2007.04.040. [DOI] [PMC free article] [PubMed] [Google Scholar]
- 9.Fabian MR, Sonenberg N, Filipowicz W. Regulation of mRNA translation and stability by microRNAs. Annu Rev Biochem. 2010;79:351–379. doi: 10.1146/annurev-biochem-060308-103103. [DOI] [PubMed] [Google Scholar]
- 10.Vasudevan S, Tong Y, Steitz JA. Switching from repression to activation: microRNAs can upregulate translation. Science. 2007;318:1931–1934. doi: 10.1126/science.1149460. [DOI] [PubMed] [Google Scholar]
- 11.Vasudevan S, Tong Y, Steitz JA. Cell-cycle control of microRNA-mediated translation regulation. Cell Cycle. 2008;7:1545–1549. doi: 10.4161/cc.7.11.6018. [DOI] [PMC free article] [PubMed] [Google Scholar]
- 12.Ørom UA, Nielsen FC, Lund AH. MicroRNA-10a binds the 5′UTR of ribosomal protein mRNAs and enhances their translation. Mol Cell. 2008;30:460–471. doi: 10.1016/j.molcel.2008.05.001. [DOI] [PubMed] [Google Scholar]
- 13.Jopling CL, Yi M, Lancaster AM, Lemon SM, Sarnow P. Modulation of hepatitis C virus RNA abundance by a liver-specific microRNA. Science. 2005;309:1577–1581. doi: 10.1126/science.1113329. [DOI] [PubMed] [Google Scholar]
- 14.Henke JI, Goergen D, Zheng J, Song Y, Schüttler CG, Fehr C, et al. microRNA-122 stimulates translation of hepatitis C virus RNA. EMBO J. 2008;27:3300–3310. doi: 10.1038/emboj.2008.244. [DOI] [PMC free article] [PubMed] [Google Scholar]
- 15.Niepmann M. Activation of hepatitis C virus translation by a liver-specific microRNA. Cell Cycle. 2009;8:1473–1477. doi: 10.4161/cc.8.10.8349. [DOI] [PubMed] [Google Scholar]
- 16.Jangra RK, Yi M, Lemon SM. Regulation of hepatitis C virus translation and infectious virus production by the microRNA miR-122. J Virol. 2010;84:6615–6625. doi: 10.1128/JVI.00417-10. [DOI] [PMC free article] [PubMed] [Google Scholar]
- 17.Machlin ES, Sarnow P, Sagan SM. Masking the 5′ terminal nucleotides of the hepatitis C virus genome by an unconventional microRNA-target RNA complex. Proc Natl Acad Sci USA. 2011;108:3193–3198. doi: 10.1073/pnas.1012464108. [DOI] [PMC free article] [PubMed] [Google Scholar]
- 18.Villanueva RA, Jangra RK, Yi M, Pyles R, Bourne N, Lemon SM. miR-122 does not modulate the elongation phase of hepatitis C virus RNA synthesis in isolated replicase complexes. Antiviral Res. 2010;88:119–123. doi: 10.1016/j.antiviral.2010.07.004. [DOI] [PMC free article] [PubMed] [Google Scholar]
- 19.Scheller N, Diez J. RNA viruses hijack the mRNA decay machinery to multiply. Cell Cycle. 2009;8:4013–4014. doi: 10.4161/cc.8.24.10223. [DOI] [PubMed] [Google Scholar]
- 20.Lanford RE, Hildebrandt-Eriksen ES, Petri A, Persson R, Lindow M, Munk ME, et al. Therapeutic silencing of microRNA-122 in primates with chronic hepatitis C virus infection. Science. 2010;327:198–201. doi: 10.1126/science.1178178. [DOI] [PMC free article] [PubMed] [Google Scholar]
- 21.McGivern DR, Lemon SM. Virus-specific mechanisms of carcinogenesis in hepatitis C virus associated liver cancer. Oncogene. 2011;30:1969–1983. doi: 10.1038/onc.2010.594. [DOI] [PMC free article] [PubMed] [Google Scholar]
- 22.Jünemann C, Song Y, Bassili G, Goergen D, Henke J, Niepmann M. Picornavirus internal ribosome entry site elements can stimulate translation of upstream genes. J Biol Chem. 2007;282:132–141. doi: 10.1074/jbc.M608750200. [DOI] [PubMed] [Google Scholar]
- 23.Schorl C, Sedivy JM. Analysis of cell cycle phases and progression in cultured mammalian cells. Methods. 2007;41:143–150. doi: 10.1016/j.ymeth.2006.07.022. [DOI] [PMC free article] [PubMed] [Google Scholar]
- 24.Polyak K, Kato JY, Solomon MJ, Sherr CJ, Massague J, Roberts JM, et al. p27Kip1, a cyclin-Cdk inhibitor, links transforming growth factor-beta and contact inhibition to cell cycle arrest. Genes Dev. 1994;8:9–22. doi: 10.1101/gad.8.1.9. [DOI] [PubMed] [Google Scholar]
- 25.Datta B, Datta R, Mukherjee S, Zhang Z. Increased phosphorylation of eukaryotic initiation factor 2alpha at the G2/M boundary in human osteosarcoma cells correlates with deglycosylation of p67 and a decreased rate of protein synthesis. Exp Cell Res. 1999;250:223–230. doi: 10.1006/excr.1999.4508. [DOI] [PubMed] [Google Scholar]
- 26.Tinton SA, Schepens B, Bruynooghe Y, Beyaert R, Cornelis S. Regulation of the cell-cycle-dependent internal ribosome entry site of the PITSLRE protein kinase: roles of Unr (upstream of N-ras) protein and phosphorylated translation initiation factor eIF-2alpha. Biochem J. 2005;385:155–163. doi: 10.1042/BJ20040963. [DOI] [PMC free article] [PubMed] [Google Scholar]
- 27.Raught B, Gingras AC, Sonenberg N. Regulation of ribosomal recruitment in eukaryotes. In: Sonenberg N, Hershey JWB, Mathews MB, editors. Translational control of gene expression. Cold Spring Harbor, NY: Cold Spring Harbor Laboratory Press; 2000. pp. 245–293. [Google Scholar]
- 28.Pyronnet S, Dostie J, Sonenberg N. Suppression of cap-dependent translation in mitosis. Genes Dev. 2001;15:2083–2093. doi: 10.1101/gad.889201. [DOI] [PMC free article] [PubMed] [Google Scholar]
- 29.Venkatesan A, Sharma R, Dasgupta A. Cell cycle regulation of hepatitis C and encephalomyocarditis virus internal ribosome entry site-mediated translation in human embryonic kidney 293 cells. Virus Res. 2003;94:85–95. doi: 10.1016/S0168-1702(03)00136-9. [DOI] [PubMed] [Google Scholar]
- 30.Honda M, Kaneko S, Matsushita E, Kobayashi K, Abell GA, Lemon SM. Cell cycle regulation of hepatitis C virus internal ribosomal entry site-directed translation. Gastroenterology. 2000;118:152–162. doi: 10.1016/S0016-5085(00)70424-0. [DOI] [PubMed] [Google Scholar]
- 31.Lin CC, Liu LZ, Addison JB, Wonderlin WF, Ivanov AV, Ruppert JMA. KLF4-miRNA-206 autoregulatory feedback loop can promote or inhibit protein translation depending upon cell context. Mol Cell Biol. 2011;31:2513–2527. doi: 10.1128/MCB.01189-10. [DOI] [PMC free article] [PubMed] [Google Scholar]
- 32.Mortensen RD, Serra M, Steitz JA, Vasudevan S. Posttranscriptional activation of gene expression in Xenopus laevis oocytes by microRNA-protein complexes (microRNPs) Proc Natl Acad Sci USA. 2011;108:8281–8286. doi: 10.1073/pnas.1105401108. [DOI] [PMC free article] [PubMed] [Google Scholar]
- 33.Yao ZQ, Eisen-Vandervelde A, Ray S, Hahn YS. HCV core/gC1qR interaction arrests T cell cycle progression through stabilization of the cell cycle inhibitor p27Kip1. Virology. 2003;314:271–282. doi: 10.1016/S0042-6822(03)00419-7. [DOI] [PubMed] [Google Scholar]
- 34.Ohkawa K, Ishida H, Nakanishi F, Hosui A, Ueda K, Takehara T, et al. Hepatitis C virus core functions as a suppressor of cyclin-dependent kinase-activating kinase and impairs cell cycle progression. J Biol Chem. 2004;279:11719–11726. doi: 10.1074/jbc.M308560200. [DOI] [PubMed] [Google Scholar]
- 35.Yang XJ, Liu J, Ye L, Liao QJ, Wu JG, Gao JR, et al. HCV NS2 protein inhibits cell proliferation and induces cell cycle arrest in the S-phase in mammalian cells through downregulation of cyclin A expression. Virus Res. 2006;121:134–143. doi: 10.1016/j.virusres.2006.02.004. [DOI] [PubMed] [Google Scholar]
- 36.Munakata T, Nakamura M, Liang Y, Li K, Lemon SM. Downregulation of the retinoblastoma tumor suppressor by the hepatitis C virus NS5B RNA-dependent RNA polymerase. Proc Natl Acad Sci USA. 2005;102:18159–18164. doi: 10.1073/pnas.0505605102. [DOI] [PMC free article] [PubMed] [Google Scholar]
- 37.Cho JW, Baek WK, Suh SI, Yang SH, Chang J, Sung YC, et al. Hepatitis C virus core protein promotes cell proliferation through the upregulation of cyclin E expression levels. Liver. 2001;21:137–142. doi: 10.1034/j.1600-0676.2001.021002137.x. [DOI] [PubMed] [Google Scholar]
- 38.Krützfeldt J, Rajewsky N, Braich R, Rajeev KG, Tuschl T, Manoharan M, et al. Silencing of microRNAs in vivo with 'antagomirs'. Nature. 2005;438:685–689. doi: 10.1038/nature04303. [DOI] [PubMed] [Google Scholar]
- 39.Esau C, Davis S, Murray SF, Yu XX, Pandey SK, Pear M, et al. miR-122 regulation of lipid metabolism revealed by in vivo antisense targeting. Cell Metab. 2006;3:87–98. doi: 10.1016/j.cmet.2006.01.005. [DOI] [PubMed] [Google Scholar]
- 40.Kutay H, Bai S, Datta J, Motiwala T, Pogribny I, Frankel W, et al. Downregulation of miR-122 in the rodent and human hepatocellular carcinomas. J Cell Biochem. 2006;99:671–678. doi: 10.1002/jcb.20982. [DOI] [PMC free article] [PubMed] [Google Scholar]
- 41.Gramantieri L, Ferracin M, Fornari F, Veronese A, Sabbioni S, Liu CG, et al. Cyclin G1 is a target of miR-122a, a microRNA frequently downregulated in human hepatocellular carcinoma. Cancer Res. 2007;67:6092–6099. doi: 10.1158/0008-5472.CAN-06-4607. [DOI] [PubMed] [Google Scholar]
- 42.Varnholt H, Drebber U, Schulze F, Wedemeyer I, Schirmacher P, Dienes HP, et al. MicroRNA gene expression profile of hepatitis C virus-associated hepatocellular carcinoma. Hepatology. 2008;47:1223–1232. doi: 10.1002/hep.22158. [DOI] [PubMed] [Google Scholar]
- 43.Girard M, Jacquemin E, Munnich A, Lyonnet S, Henrion-Caude A. miR-122, a paradigm for the role of microRNAs in the liver. J Hepatol. 2008;48:648–656. doi: 10.1016/j.jhep.2008.01.019. [DOI] [PubMed] [Google Scholar]
- 44.Bung C, Bochkaeva Z, Terenin I, Zinovkin R, Shatsky IN, Niepmann M. Influence of the hepatitis C virus 3′-untranslated region on IRES-dependent and cap-dependent translation initiation. FEBS Lett. 2010;584:837–842. doi: 10.1016/j.febslet.2010.01.015. [DOI] [PubMed] [Google Scholar]
- 45.Niepmann M, Petersen A, Meyer K, Beck E. Functional involvement of polypyrimidine tract-binding protein in translation initiation complexes with the internal ribosome entry site of foot-and-mouth disease virus. J Virol. 1997;71:8330–8339. doi: 10.1128/jvi.71.11.8330-8339.1997. [DOI] [PMC free article] [PubMed] [Google Scholar]
- 46.Vidal A, Koff A. Cell-cycle inhibitors: three families united by a common cause. Gene. 2000;247:1–15. doi: 10.1016/S0378-1119(00)00092-5. [DOI] [PubMed] [Google Scholar]
- 47.Rüdel S, Flatley A, Weinmann L, Kremmer E, Meister G. A multifunctional human Argonaute2-specific monoclonal antibody. RNA. 2008;14:1244–1253. doi: 10.1261/rna.973808. [DOI] [PMC free article] [PubMed] [Google Scholar]