Abstract
Light scattering at nanoparticles and molecules can be dramatically enhanced in the 'hot spots' of optical antennas, where the incident light is highly concentrated. Although this effect is widely applied in surface-enhanced optical sensing, spectroscopy and microscopy, the underlying electromagnetic mechanism of the signal enhancement is challenging to trace experimentally. Here we study elastically scattered light from an individual object located in the well-defined hot spot of single antennas, as a new approach to resolve the role of the antenna in the scattering process. We provide experimental evidence that the intensity elastically scattered off the object scales with the fourth power of the local field enhancement provided by the antenna, and that the underlying electromagnetic mechanism is identical to the one commonly accepted in surface-enhanced Raman scattering. We also measure the phase shift of the scattered light, which provides a novel and unambiguous fingerprint of surface-enhanced light scattering.
 Light scattering from nanoscale objects can be dramatically enhanced in the proximity of optical antennas. Here, by studying the amplitude and phase of the light scattered from a tip located at the hot spot of an antenna, the underlying electromagnetic mechanism of this enhancement is resolved.
Metal nanostructures can convert incident light into nanoscale confined and strongly enhanced optical fields ('hot spots'), thus acting as the optical analogue of an antenna. When molecules or nanoparticles (objects) are placed at a hot spot, the Raman scattering1,2,3,4,5,6,7,8,9,10, fluorescence11,12 or infrared absorption13,14, can be dramatically enhanced. A variety of surface-enhanced Raman scattering (SERS) experiments15,16,17,18,19 indicate that enormous signal enhancement factors of more than 1010 are possible, because the Raman intensity I scales with the fourth power of the local field enhancement f at the metal surface3,16,20,21,22, allowing even for single-molecule spectroscopy4,5,7,23,24. The direct and quantitative verification of this power law and its underlying electromagnetic scattering mechanism, however, is more than a challenge to tackle. The difficulties arise from the complex processes typically involved in surface-enhanced spectroscopies, where chemical bonding and charge transfer between object and metal nanostructures can occur12,25,26,27,28. In addition, many experiments rely on measurements of samples exhibiting heterogeneously distributed hot spots of random field enhancement, which forces a statistical evaluation of the enhancement23.
Here we study the light elastically scattered from an individual object located in the well-defined hot spot of single antennas as a new approach to resolve the role of the antenna in the scattering process. We provide experimental evidence that the scattering off the object is enhanced by the presence of the antenna, and that the underlying electromagnetic mechanism is analogous to that in SERS. Furthermore, the analysis of elastic scattering offers the possibility to access the phase shift induced by the antenna, providing a novel fingerprint of this scattering mechanism.
Results
Electromagnetic mechanism of surface-enhanced scattering
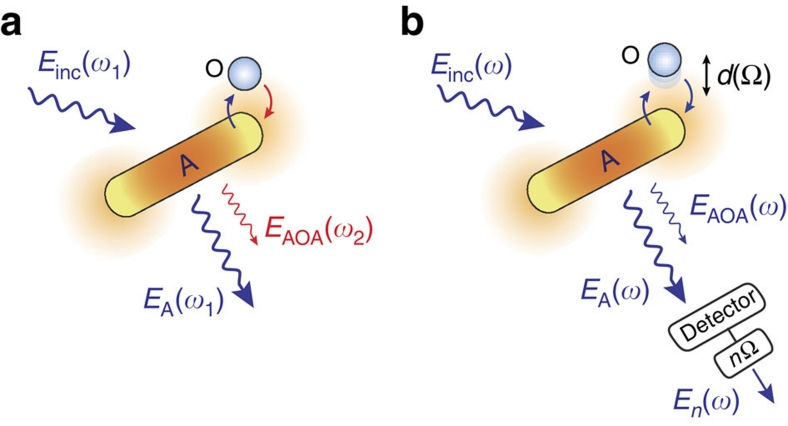
In Figure 1a we illustrate the commonly accepted electromagnetic scattering mechanism in SERS3,21,28. An object (O) is located in close proximity to a metal nanostructure. Acting as an antenna (A), the metal nanostructure enhances the incoming field Einc of frequency ω1 by a factor f1, generating a local field Eloc (hot spot) in its proximity:
Figure 1. Schematics of a surface-enhanced light scattering process.
(a) Inelastic scattering process (ω1≠ω2) from an object (O) in the presence of a metal nanostructure that acts as an optical antenna (A). (b) Elastic scattering process (ω1=ω2=ω). Einc(ω) denotes the incident field, EA(ω) is the field directly radiated by the antenna, and EAOA(ω) is the field radiated by the object via the antenna. To select EAOA, the antenna–object distance d is modulated at frequency Ω, and the detector signal is demodulated at the higher harmonic frequency nΩ.
| 1 |
The metal nanostructure also enhances the scattering off the object at the Raman-shifted frequency ω2 by an enhancement factor f2. The field EAOA scattered off the object via the antenna is thus given by
| 2 |
The index AOA indicates the scattering path: the incoming light first polarizes the antenna A, the local field of the antenna polarizes the object O, and finally the local field of the object acts back on the antenna A, which radiates as a result of this interaction. We can approximate f1≈f2≈f when the difference between ω1 and ω2 is small and when illumination and detection direction are the same, the latter being a consequence of the reciprocity theorem. In this case, the antenna-enhanced field scattered off the object, EAOA, scales with the square of the local field enhancement29,
| 3 |
We note that equation (3) is valid particularly in the case of surface-enhanced elastic scattering, where ω1 is exactly equal to ω2. A detailed description of the elastically scattered field EAOA is provided in the Methods section.
It is important to note that for a full analysis of the scattering process we have to consider the complex nature of the field enhancement f:
| 4 |
Here |f| is the magnitude of the field enhancement and Δϕf the phase shift induced by the antenna relative to the incident field. From equations (3) and (4) it is immediately seen that the scattered intensity IAOA∝|EAOA|2 (typically measured in an experiment) scales with the fourth power of the magnitude of the local field enhancement,
| 5 |
We also find that there is a phase shift ΔϕAOA between the scattered field  and the incident field Einc, which is given by
| 6 |
The factor of 2 in equation (6) provides a distinct signature of a surface-enhanced or an antenna-enhanced scattering process. It more clearly reveals the role of the antenna, which is mediating both the illumination of the object as well as the scattering off the object. It is important to note that in SERS we also have to consider chemical enhancement effects and an additional phase shift caused by the Raman process. These effects are not included in equations (1, 2, 3, 4, 5, 6) to highlight the electromagnetic mechanism of the enhancement.
Measurement principle and experimental set-up
To access both the magnitude and the phase shift of f, we propose an experimental scheme as illustrated in Figure 1b. We measure the field EAOA, which is elastically backscattered (that is, illumination and detection directions are the same) from an individual object located in the well-defined hot spot of single antennas. Analysing the elastically scattered light ensures that the field enhancements f1 and f2 are exactly equal (f1=f2=f), and allows for interferometric measurement of the phase. Furthermore, the object should not be chemically bound to the antenna to exclude chemical effects. In a general detection procedure at frequency ω, however, it is not possible to distinguish between the contributions EA(ω) and EAOA(ω) to the total field ET=EA+EAOA, where EA is the field directly scattered by the antenna. To extract EAOA(ω) from the total field ET, we modulate sinusoidally the distance d between the antenna and the object at a frequency Ω, according to d=d0+Δdcos(Ωt). Here Δd is the modulation amplitude and d0 the average antenna–object separation. Such a modulation will not affect the direct scattering contribution EA(ω), as it does not depend on the separation distance. However, it will modulate the contribution EAOA(ω), owing to the nonlinear behaviour of the field enhancement with d, f=f(d). Thus, by demodulating the field ET at the frequency nΩ with n>1, we obtain the signal En, which is proportional to the field EAOA scattered off the object (for details see the Methods section):
| 7 |
To demonstrate that En (and therefore the scattered field EAOA) is proportional to f2, it is necessary to measure En as a function of f. To this end, we measure in the following the signal En at the hot spot of different well-defined antennas and relate it to the calculated local field enhancement f.
We note that equation (3) (and subsequently equation (7)) is valid for strong field enhancements f≫1 and does not account for the vectorial nature of the fields30. However, a more rigorous and general tensorial formulation (see derivation of EAOA in the Methods section) proves that equation (3) indeed applies for scattering configurations where the object of interest is located at individual hot spots of optical antennas, as is the case in the following experiments.
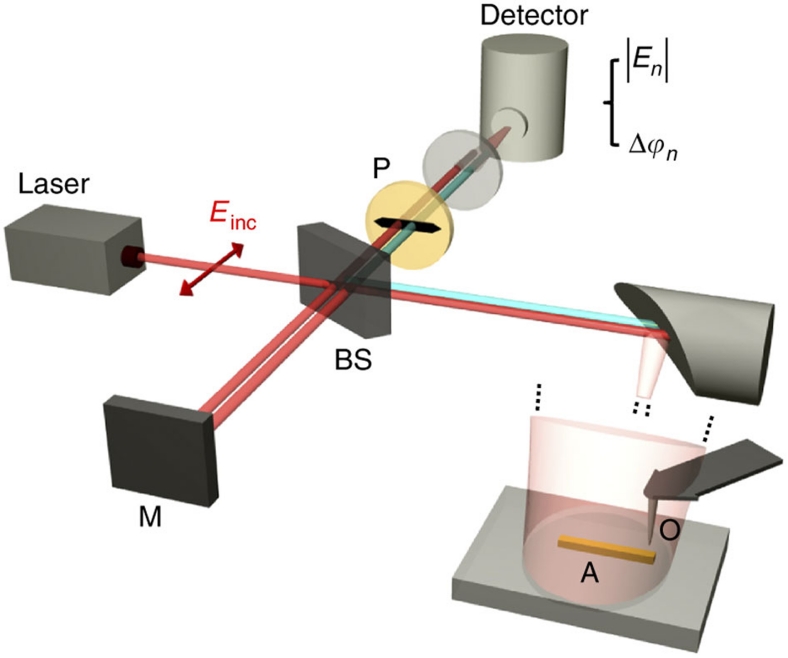
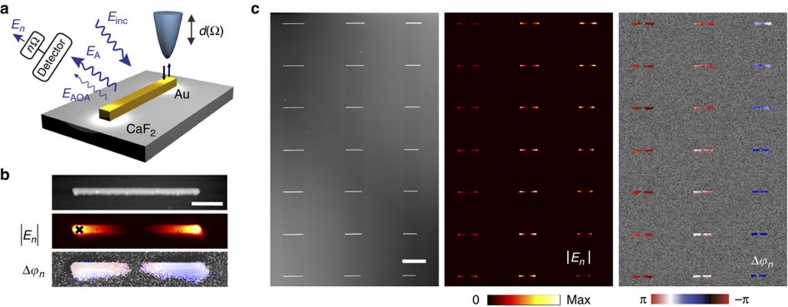
We experimentally realize the scheme proposed in Figure 1b with the use of a scattering-type scanning near-field optical microscope (s-SNOM, Fig. 2)31,32. As schematically illustrated in Figure 3a, the apex of the vertically oscillating Si tip mimics the object (O), while the metal rod acts as an antenna (A) that converts the incident infrared radiation of a wavelength λ=11.1 μm (with polarization parallel to the rod) into strongly concentrated fields at the rod extremities (hot spots)31. The horizontally polarized light backscattered from the tip-antenna configuration is detected with a pseudo-heterodyne Michelson interferometer33 (Fig. 2). Demodulation of the detector signal at nΩ yields the amplitude |En| and phase shift Δϕn. To identify the hot spots, we scan the tip across the antenna and record the sample height, as well as amplitude |En| and phase Δϕn as a function of the tip position (Fig. 3b). In the amplitude map we observe the strongest signals |En| at the rod extremities, which experimentally proves the existence of two hot spots on the metal rod. The phase map shows that the signal Δϕn is nearly constant across the antenna.
Figure 2. Set-up for verifying surface-enhanced elastic light scattering.
The set-up comprises a scattering-type scanning near-field optical microscope (s-SNOM, from Neaspec GmbH), which is based on an atomic force microscope (AFM). The apex of a conventional Si tip acts as the scattering object (O). The antenna and tip are illuminated at an angle of about 50° relative to the surface normal with the focused beam of a CO2 laser operating at 11.1 μm. The polarization of the illuminating beam Einc is parallel to the long axis of the metal rod (s-polarized light). The field backscattered by the antenna (A) and the tip (O) is collected and detected with a pseudo-heterodyne interferometer (M denotes the reference mirror and BS the beamsplitter). The polarizer P ensures that s-polarized light is detected. To obtain a modulation of the distance between tip and antenna, the tip is oscillating vertically at a frequency Ω=300 KHz and with an amplitude of 70 nm. Demodulation of the detector signal at a higher harmonic nΩ yields the amplitude and phase signals |En| and Δϕn.
Figure 3. Spatial mapping of surface-enhanced light scattering.
(a) A Si tip (vertically oscillating at frequency Ω) is scanned across a Au rod antenna (A). Both antenna and tip (the latter mimicking the scattering object O) are illuminated with s-polarized light. The s-polarized light backscattered from the tip-antenna configuration is detected interferometrically (not shown). Demodulation of the detector signal at a higher harmonic nΩ yields the amplitude |En| and the phase Δϕn at each position of the tip. (b) Topography, amplitude |En| and phase shift Δϕn maps of a Au rod antenna. The scale bar denotes 1 μm. (c) From left to right, topography, amplitude |En| and phase shift Δϕn maps of Au rods. The length of the rods decreases from the top to the bottom and from the left to the right). The illumination wavelength was 11.1 μm. Demodulation was done with n=4. The scale bar denotes 5 μm.
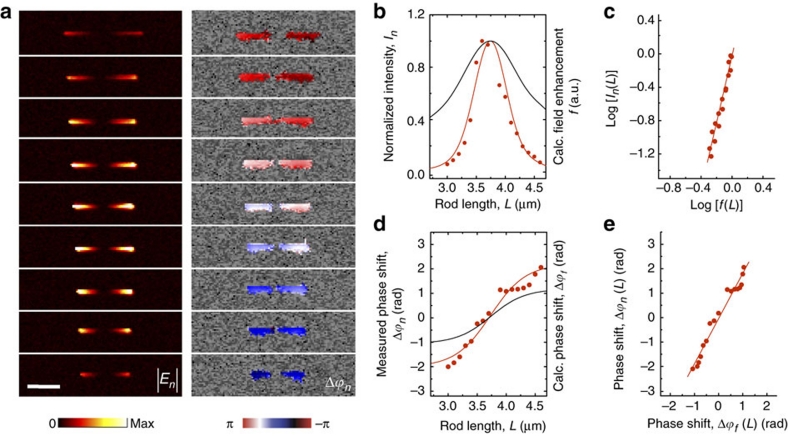
Analogous to classical radio wave antennas, the resonance and thus highest field enhancement for Au rods is expected at a length Lres=λeff/2, where λeff is the effective wavelength34,35. By changing the antenna length L at a fixed wavelength, we can thus precisely control the field enhancement f at the rod extremities, which is the key to establish a quantitative dependence between the local field enhancement f and the scattered field En. We thus study in the following an antenna array where the antenna length decreases from the top to the bottom and from the left to the right (for antenna fabrication details see Methods section). In Figure 3c we show topography, amplitude |En| and phase Δϕn maps of this antenna array, while in Figure 4a we show zoom-in images of selected antennas. We observe that with increasing antenna lengths L, the amplitude signal increases until it reaches a maximum value at a rod length of about L=3.7 μm, consistent with the theoretical antenna resonance. With further increasing length, the amplitude decreases. This observation clearly reveals the resonance behaviour of the antennas36. The simultaneously acquired phase maps reveal a continuously increasing phase with increasing rod length, providing further evidence that we trace a resonance37.
Figure 4. Verification of antenna-mediated elastic light scattering.
(a) Amplitude |En| and phase shift Δϕn maps of Au rods of different lengths. All the maps were recorded at an illumination wavelength of 11.1 μm. Demodulation was done with n=4. The scale bar denotes 2 μm. (b) Measured intensity In∝|En|2 (red symbols) and calculated field enhancement f (black solid line) at the hot spot (marked by a cross in Fig. 3b) as a function of the antenna length L. Both quantities are normalized to their maximum value. The red solid line shows the function f 4.08 (L). (c) Parametric representation of log[In(L)] and log[f(L)] (red symbols). A linear least-square fitting of the data points (red solid line) yields a slope of 4.08. (d) Measured phase shift Δϕn (red symbols) and calculated phase shift Δϕf (black solid line) at the hot spot (marked by a cross in Fig. 3b) as a function of antenna length L. The red solid line shows the function 1.85 Δϕf (L). (e) Parametric representation of Δϕn(L) and Δϕf(L) (red symbols). Linear least-square fitting of the data yields the relation Δϕn=1.85Δϕf.
To relate the scattered field En with the local field enhancement f, we measure amplitude |En| and phase Δϕn at the hot spot (marked by a cross in Fig. 3b) as a function of the antenna length L and compare them to the numerically calculated magnitude |f| and phase Δϕf of the local field enhancement. The calculations of the magnitude and phase at the hot spots were performed with the use of a finite-difference time-domain (FDTD) method (Lumerical FDTD Solutions). The same wavelength and geometrical antenna parameters as in the experiment were used. The dielectric values for Au and the refractive index of the CaF2 substrate, nCaF2≅1.26+0.005i, were taken from Palik38.
Relating scattered intensity and local field enhancement
Figure 4b displays the measured intensity In∝|En|2 (red symbols) and the calculated field enhancement f (black solid line) at the hot spots indicated by the cross in Figure 3b, both normalized to their maximum value. We clearly see the resonance behaviour, with the resonance appearing at L=3.7 μm for both In and f. In Figure 4c we show a parametric representation of log[In(L)] and log[f(L)] (red symbols). We find a linear behaviour, revealing that the scattered intensity In and the field enhancement f are related by a power law. Linear least-square fitting of the data points yields a slope of 4.08. By plotting f 4.08(L) in Figure 4b (red solid line), we find a good agreement with the measured intensity In(L). Our results clearly verify that the intensity scattered from a nanoscale object located in a hot spot scales with the fourth power of the local field enhancement, I∝f 4. The slight quantitative discrepancy between the experimental and theoretical exponent can be attributed to uncertainties in the antenna fabrication process and dielectric values, which have a particularly strong impact in establishing a large-exponent power law.
Figure 4d displays the measured phase shift Δϕn (red symbols) and the calculated phase shift Δϕf (black solid line) as a function of the antenna length L. As expected, both of them increase continuously with the antenna length L (ref. 37). In Figure 4e we show a parametric representation of Δϕn(L) and Δϕf(L) (red symbols). Linear least-square fitting of the data yields a slope of 1.85. By plotting Δϕf(L) multiplied by the factor 1.85 in Figure 4d (red solid line), we find an excellent agreement with the measured phase shift Δϕn(L). This factor (yielding the difference between the measured phase shift and the phase shift induced by the antenna) is close to the expected value of 2 (as predicted in equation (6)), thus clearly proving the double role of the antenna, which is both illuminating the object as well as scattering off the object.
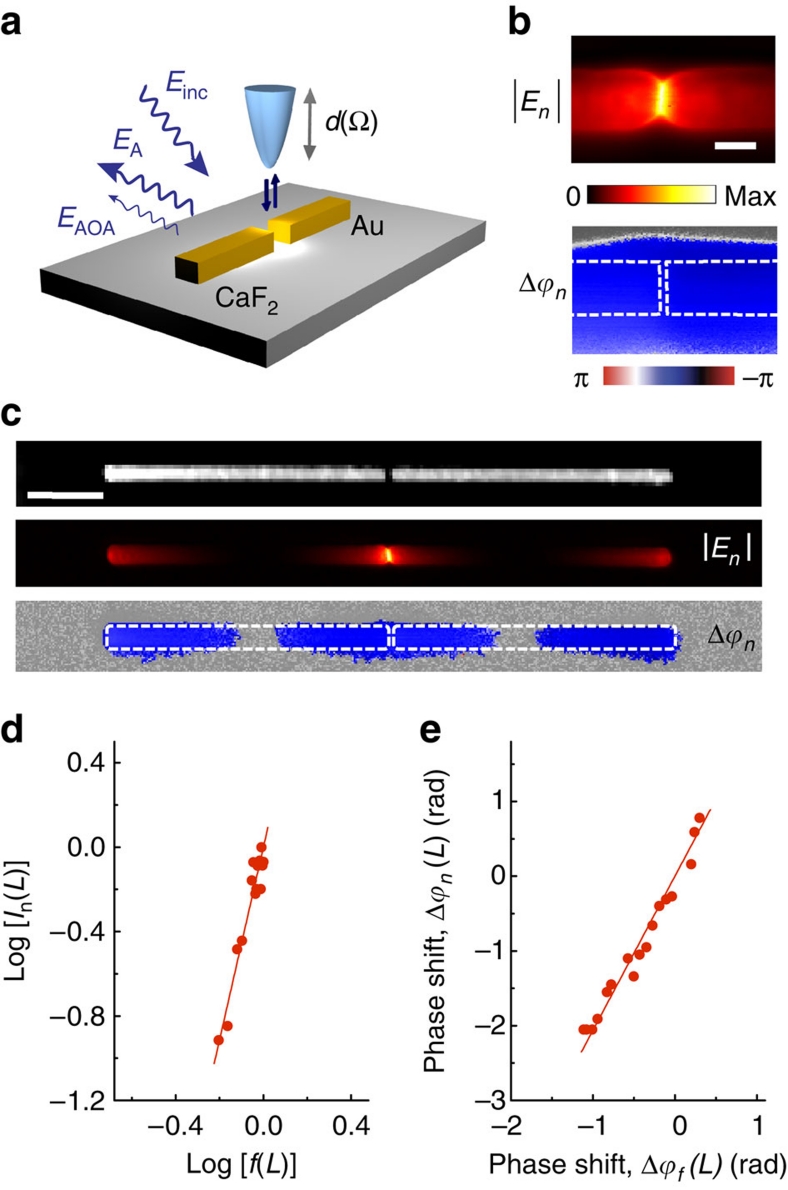
Antenna-enhanced light scattering is particularly efficient when the objects of interest are located in nanoscale antenna gaps, where the local field enhancement reaches maximum values8. To study the scattering mechanism in this case, we recorded the field scattered from the Si tip in the proximity of infrared gap antennas (Fig. 5a). The amplitude and phase maps of the resonant antenna are shown in Figure 5b and c, clearly visualizing the hot spot in the antenna gap. Owing to the capacitive coupling across the gap31, this hot spot exhibits a much stronger field enhancement and field confinement compared with that observed in single rods (Fig. 3b). From a zoom-in image (Fig. 5b), we measure for the hot spot a full width at half maximum of about 50 nm. Following an identical procedure as the one applied in Figure 4, we establish the relation between the field scattered from the tip and the local field enhancement exactly at the gap centre. To this end, we mapped gap antennas with a fixed gap and varying arm length L, and measured the field |En| and the phase shift Δϕn at the gap centre as a function of L. We also calculated the magnitude |f| and phase Δϕf of the field enhancement at the gap centre. From a parametric representation of log[In(L)] and log[f(L)] (Fig. 5d), we again find that the intensity scattered by the tip scales with nearly the fourth power of the field enhancement. The difference between the exponent of 4.56 determined from our study and the expected value of 4 can be assigned to uncertainties in the antenna fabrication process, yielding variations in the antenna dimensions (for example, length, width and gap size) with respect to the design values used for the near-field calculations. Particularly difficult to reproduce by electron-beam lithography on the insulating CaF2 substrate is the gap, which is precisely where the local field enhancement in Figure 5d is evaluated. In Figure 5e we show a parametric plot of Δϕn(L) and Δϕf(L), yielding clear evidence that the phase shift of the scattered field EAOA is twice the phase shift of the local field at the hot spot (Δϕn(L)=1.99Δϕf(L)). These observations confirm the results obtained with single rods (Fig. 4) and thus corroborate the electromagnetic mechanism in antenna-enhanced light scattering.
Figure 5. Elastic light scattering in the hot spot of infrared gap antennas.
(a) A Si tip (vertically oscillating at frequency Ω) is scanned across a Au rod antenna (A). Both antenna and tip (the latter mimicking the scattering object O) are illuminated with s-polarized light. The s-polarized light backscattered from the tip-antenna configuration is detected interferometrically (not shown). Demodulation of the detector signal at nΩ yields the amplitude |En| and phase shift Δϕn at each position of the tip. (b) Zoom-in amplitude |En| and phase shift Δϕn images of the gap region in a resonant gap antenna. A full width at half maximum of the hot spot of about 50 nm is measured. The scale bar denotes 100 nm. (c) Topography, amplitude |En| and phase shift Δϕn maps of a resonant gap antenna. The maps were recorded at an excitation wavelength of 11.1 μm and demodulation was done with n=4. The scale bar denotes 2 μm. (d) Parametric representation of log[In(L)] and log[f(L)] (red symbols). A linear least-square fitting of the data points (red solid line) yields a slope of 4.56. (e) Parametric representation of Δϕn(L) and Δϕf(L) (red symbols). Linear least-square fitting of the data yields the relation Δϕn=1.99Δϕf.
Discussion
Our findings might have particular implications in surface-enhanced infrared absorption (SEIRA) spectroscopy, where objects adsorbed on rough metal films or antennas exhibit an enhanced infrared fingerprint spectrum. SEIRA—actually yielding extinction spectra—is typically assigned to an enhanced infrared absorption of the objects. The enhanced infrared scattering from the objects is barely considered. However, the scattering from the object might be a significant contribution to the extinction, as it scales with f 4, while the infrared absorption scales only with f 2. Future interpretation of SEIRA thus might need to consider also the scattering process. On the other hand, the strongly enhanced scattering cross-section might be applied for the development of surface-enhanced infrared scattering spectroscopy.
In conclusion, our results provide a rigorous verification of the widely accepted electromagnetic enhancement mechanism in surface- and antenna-enhanced spectroscopy, more than 30 years after it was proposed to explain the electromagnetic contribution in SERS. We also establish that the enhancement mechanism for elastic and inelastic (Raman) scattering is the same, and thus generalize the electromagnetic mechanism of SERS. Furthermore, the verification of the phase shift involved in the elastic scattering process introduces a new paradigm to characterize and manipulate surface-enhanced coherent scattering processes, which might be of fundamental and technological importance in optical information and sensing applications.
Methods
Derivation of EAOA
In the following we show that the elastic light scattering from an object at the hot spot of an optical antenna, EAOA, scales with the fourth power of the local field enhancement. We consider a general elastic light scattering process similar to the one shown in Figure 1b, where incoming and scattered radiations occur at frequency ω. Both antenna (A) and object (O) are characterized by means of their corresponding polarizabilities αA and αO, with αA≫αO. When an incident field Einc(ω) impinges on the antenna and object, a multiple scattering process occurs. The resulting total scattered field ET(ω) can be expressed as a coherent sum of the contribution of the different scattering orders as:
| 8 |
From now on, an implicit ω dependence will be assumed in all of the expressions. In equation (8) the term
| 9 |
is the field radiated directly by the antenna with GA=GA(r→∞) being the corresponding Green's function evaluated in the far field, for example, at a distant detector. The term
| 10 |
is the field radiated directly by the object, where GO=GO(r→∞) is the Green's function describing the scattering from the object. The term
| 11 |
is the field radiated directly by the object after being illuminated by the local field Eloc=fEinc produced by the antenna. The term
| 12 |
is the field scattered from the object via the antenna. The term
| 13 |
describes the field scattered from the object via the antenna, after being illuminated by the local field produced by the antenna. The direct scattering off the object EO in equation (8) can be neglected because the polarizability of the object αO is, by definition, smaller than the polarizability of the antenna αA. Thus, EO is negligible when compared with EA. We also note that the exact total radiation in equation (8) should include all the successive interaction events in the scattering process. Nevertheless, the small value of αO allows for a truncation of ET at the first order of αO, that is, after the term EAOA, as shown in equation (8). Moreover, if the field enhancement is large (f≫1), as it is the case in a hot spot of an antenna, the contributions EOA and EAO (which scale linearly with f) to ET are much smaller than EAOA (which scales with the square of f). The total radiated field ET (equation (8)) can be thus reduced to:
| 14 |
The field EAOA in equation (13), which is the one studied in this communication, can be evaluated considering the tensorial nature of the polarizability αO (diagonal tensor of components αO,ii with i=x, y, z) and the field enhancement f (tensor of components fij with i, j=x, y, z). With an incident field Einc,x polarized in the x-direction (defined here to be parallel to the long axis of the antenna, as in our experimental situation) we obtain:
 |
15 |
where fij is the field enhancement factor of the i-component induced by the j-component of the incident field Einc,j.
In the case of an isotropic polarizability of the object, αO,xx=αO,yy=αO,zz, equation (15) yields the well-known scalar power law EAOA,x∝[(fxx)2+(fyx)2+(fzx)2]=f 2 as described by equation (13). In case of an anisotropic object (as the tip in our experiment), the general solution of EAOA,x (equation (15)) prevails. However, at the extremity of single dipolar antennas and at the gap between two coupled antennas (the two situations considered in this communication), one component of the enhancement dominates over the others. fxx≫fyx, fzx in the gap of a coupled antenna and fzx≫fxx, fyx on top of the single antenna extremities. In these cases, we can consider f≈fxx or f≈fzx, respectively, and EAOA,x can be expressed as
| 16 |
at the antenna gap, or
| 17 |
on the extremity of an isolated antenna. Equations (16) and are identical to the scalar description (equation (13)) of surface-enhanced light scattering.
Mathematical relationship between En and EAOA
In the following we analyse the dependence of the n-th order demodulated detector signal En(ω) on the field-enhancement factor. En(ω) is obtained as the n-th order coefficient of the Fourier transform:
 |
18 |
Substituting EAOA(ω) according to equation (13), we obtain:
 |
19 |
Normalizing the integral in equation (19) by f=f0=f(d0), we find:
| 20 |
By defining the normalized n-th Fourier coefficient ξn(d0) as
| 21 |
we can express En(ω) in terms of f0 and ξn(d0) as
| 22 |
In the Supplementary Figure S1 we show that for linear dipole antennas ξn(d0) is independent of the antenna length. Thus, in equation (22), ξn(d0) can be taken as a constant for every single antenna at a particular distance d0, yielding
| 23 |
Antenna fabrication
We fabricated Au rods with a nominal length L between 2 and 5 μm and a fixed width of 100 nm on a double-side–polished CaF2 (100) substrate by high-resolution electron-beam lithography. A bilayer polymethyl methacrylate (with 495,000 molecular weight at the bottom and 950,000 molecular weight at the top) was used as electron-sensitive polymer. The Au film with a thickness of 40 nm was thermally evaporated in high vacuum on top of a 3-nm thick Ti layer, electron-beam evaporated for adhesion purposes. A lift-off process yields the Au nanorods.
Author contributions
P.A.-G. and R.H. designed the experiments. F.H. and P.A.-G. set up the near-field microscope. F.C., F.G., L.A. and L.E.H. contributed to sample preparation. P.A.-G. performed the experiments with the help of J.C. P.A.-G., P.A., J.A., and R.H. analysed and discussed the data. P.A., and J.A. performed the calculations and together with R.H. and A.G.-E. established the theoretical framework. M.S. contributed to the discussion and interpretation of the results. R.H. wrote the manuscript together with J.A., P.A.-G. and P.A.
Additional information
How to cite this article: Alonso-González, P. et al. Resolving the electromagnetic mechanism of surface-enhanced light scattering at single hot spots. Nat. Commun. 3:684 doi: 10.1038/ncomms1674 (2012).
Supplementary Material
Supplementary Figure S1
Acknowledgments
This study was supported by the European FP7 project 'Nanoantenna' (FP7-HEALTH-F5-2009-241818-NANOANTENNA), the ERC Starting grant no. 258461 (TERATOMO), the National Projects MAT2009-08398 and FIS2010-19609-C02-C01 from the Spanish Ministerio de Ciencia e Innovacion and the Etortek-2011 project 'nanoiker' of the Department of Industry of the Basque Government. M.S. and L.A. acknowledges financial support from 'Programa de Formación de Personal Investigador' promoted by the Department of Education, Universities and Research of the Basque Government. A.G.-E. was supported by 'Programa de perfeccionamiento de doctores y doctoras en el extranjero del Departamento de Educación, Universidades e Investigación del Gobierno Vasco'.
Footnotes
P.A.-G, P.A., M.S, J.C., F.H., A.G.-E., F.C., F.G., L.A., L.E.H. and J.A. declare no competing financial interests. R.H. is co-founder of Neaspec GmbH, a company producing scattering-type scanning near-field optical microscope systems, such as the one used in this study.
References
- Fleischmann M., Hendra P. J. & McQuillan A. J. Raman spectra of pyridine adsorbed at a silver electrode. Chem. Phys. Lett. 26, 163–166 (1974). [Google Scholar]
- Jeanmaire D. L. & Van Duyne R. P. Surface raman spectroelectrochemistry: Part I. Heterocyclic, aromatic, and aliphatic amines adsorbed on the anodized silver electrode. J. Electroanal. Chem. Interfacial Electrochem. 84, 1–20 (1977). [Google Scholar]
- Moskovits M. Surface-enhanced spectroscopy. Rev. Mod. Phys. 57, 783 (1985). [Google Scholar]
- Kneipp K. et al. Single molecule detection using surface-enhanced raman scattering (SERS). Phys. Rev. Lett. 78, 1667 (1997). [Google Scholar]
- Nie S. & Emory S. R. Probing single molecules and single nanoparticles by surface-enhanced raman scattering. Science 275, 1102–1106 (1997). [DOI] [PubMed] [Google Scholar]
- Campion A. & Kambhampati P. Surface-enhanced Raman scattering. Chem. Soc. Rev. 27, 241–250 (1998). [Google Scholar]
- Xu H., Bjerneld E. J., Käll M. & Börjesson L. Spectroscopy of single hemoglobin molecules by surface enhanced Raman scattering. Phys. Rev. Lett. 83, 4357–4360 (1999). [Google Scholar]
- Xu H., Aizpurua J., Kall M. & Apell P. Electromagnetic contributions to single-molecule sensitivity in surface-enhanced Raman scattering. Phys. Rev. E 62, 4318 (2000). [DOI] [PubMed] [Google Scholar]
- Moskovits M. Surface-enhanced Raman spectroscopy: a brief retrospective. J. Raman Spectrosc. 36, 485–496 (2005). [Google Scholar]
- Li Z., Shegai T., Haran G. & Xu H. Multiple-particle nanoantennas for enormous enhancement and polarization control of light emission. ACS Nano 3, 637–642 (2009). [DOI] [PubMed] [Google Scholar]
- Kühn S., Hakanson U., Rogobete L. & Sandoghdar V. Enhancement of single-molecule fluorescence using a gold nanoparticle as an optical nanoantenna. Phys. Rev. Lett. 97, 017402 (2006). [DOI] [PubMed] [Google Scholar]
- Anger P., Bharadwaj P. & Novotny L. Enhancement and quenching of single-molecule fluorescence. Phys. Rev. Lett. 96, 113002 (2006). [DOI] [PubMed] [Google Scholar]
- Neubrech F. et al. Resonant plasmonic and vibrational coupling in a tailored nanoantenna for infrared detection. Phys. Rev. Lett. 101, 157403 (2008). [DOI] [PubMed] [Google Scholar]
- Osawa M. Dynamic processes in electrochemical reactions studied by surface-enhanced infrared absorption spectroscopy (SEIRAS). Bull. Chem. Soc. Jpn 70, 2861–2880 (1997). [Google Scholar]
- Lee S. J. , Guan Z., Xu H. & Moskovits M. Surface-enhanced Raman spectroscopy and nanogeometry: the plasmonic origin of SERS. J. Phys. Chem. C 111, 17985–17988 (2007). [Google Scholar]
- Le Ru E. C. et al. Experimental verification of the SERS electromagnetic model beyond the |E|4 approximation: polarization effects. J. Phys. Chem. C 112, 8117–8121 (2008). [Google Scholar]
- McFarland A. D., Young M. A., Dieringer J. A. & Van Duyne R. P. Wavelength-scanned surface-enhanced Raman excitation spectroscopy. J. Phys. Chem. B 109, 11279–11285 (2005). [DOI] [PubMed] [Google Scholar]
- Lal S., Grady N. K., Goodrich G. P. & Halas N. J. Profiling the near field of a plasmonic nanoparticle with Raman-based molecular rulers. Nano Lett. 6, 2338–2343 (2006). [DOI] [PubMed] [Google Scholar]
- Doherty M. D., Murphy A., McPhillips J., Pollard R. J. & Dawson P. Wavelength dependence of Raman enhancement from gold nanorod arrays: quantitative experiment and modeling of a hot spot dominated system. J. Phys. Chem. C 114, 19913–19919 (2010). [Google Scholar]
- Chalmers J. M. & Griffiths P. R. Handbook of Vibrational Spectroscopy (John Wiley, 2002). [Google Scholar]
- Le Ru E. C. & Etchegoin P. G. Rigorous justification of the E4 enhancement factor in surface enhanced Raman spectroscopy. Chem. Phys. Lett. 423, 63–66 (2006). [Google Scholar]
- Fazio B. et al. Re-radiation enhancement in polarized surface-enhanced resonant Raman scattering of randomly oriented molecules on self-organized gold nanowires. ACS Nano 5, 5945–5956 (2011). [DOI] [PubMed] [Google Scholar]
- Le Ru E. C., Etchegoin P. G. & Meyer M. Enhancement factor distribution around a single surface-enhanced Raman scattering hot spot and its relation to single molecule detection. J. Chem. Phys. 125, 204701–204713 (2006). [DOI] [PubMed] [Google Scholar]
- Camden J. P. et al. Probing the structure of single-molecule surface-enhanced Raman scattering hot spots. J. Am. Chem. Soc. 130, 12616–12617 (2008). [DOI] [PubMed] [Google Scholar]
- Fromm D. P. et al. Exploring the chemical enhancement for surface-enhanced Raman scattering with Au bowtie nanoantennas. J. Chem. Phys. 124, 061101–061104 (2006). [DOI] [PMC free article] [PubMed] [Google Scholar]
- Saikin S. K., Chu Y., Rappoport D., Crozier K. B. & Aspuru-Guzik A. Separation of electromagnetic and chemical contributions to surface-enhanced Raman spectra on nanoengineered plasmonic substrates. J. Phys. Chem. Lett. 1, 2740–2746 (2010). [Google Scholar]
- Yoshida K.-i. et al. Quantitative evaluation of electromagnetic enhancement in surface-enhanced resonance Raman scattering from plasmonic properties and morphologies of individual Ag nanostructures. Phys. Rev. B 81, 115406 (2010). [Google Scholar]
- Xu H. et al. Unified treatment of fluorescence and Raman scattering processes near metal surfaces. Phys. Rev. Lett. 93, 243002 (2004). [DOI] [PubMed] [Google Scholar]
- Novotny L. & Hecht B. Principles of Nano-Optics (Cambridge University Press, 2006). [Google Scholar]
- Deutsch B., Hillenbrand R. & Novotny L. Visualizing the optical interaction tensor of a gold nanoparticle pair. Nano Lett. 10, 652–656 (2010). [DOI] [PubMed] [Google Scholar]
- Schnell M. et al. Controlling the near-field oscillations of loaded plasmonic nanoantennas. Nat. Photon. 3, 287–291 (2009). [Google Scholar]
- Schnell M., Garcia-Etxarri A., Alkorta J., Aizpurua J. & Hillenbrand R. Phase-resolved mapping of the near-field vector and polarization state in nanoscale antenna gaps. Nano Lett. 10, 3524–3528 (2010). [DOI] [PubMed] [Google Scholar]
- Ocelic N., Huber A. & Hillenbrand R. Pseudoheterodyne detection for background-free near-field spectroscopy. Appl. Phys. Lett. 89, 101124–101123 (2006). [Google Scholar]
- Novotny L. Effective wavelength scaling for optical antennas. Phys. Rev. Lett. 98, 266802 (2007). [DOI] [PubMed] [Google Scholar]
- Bryant G. W., Garcia de Abajo F. J. & Aizpurua J. Mapping the plasmon resonances of metallic nanoantennas. Nano Lett. 8, 631–636 (2008). [DOI] [PubMed] [Google Scholar]
- Dorfmüller J. et al. Fabry-Pérot resonances in one-dimensional plasmonic nanostructures. Nano Lett. 9, 2372–2377 (2009). [DOI] [PubMed] [Google Scholar]
- Biagioni P. et al. Near-field polarization shaping by a near-resonant plasmonic cross antenna. Phys. Rev. B 80, 153409 (2009). [Google Scholar]
- Palik E. D. Handbook of Optical Constants of Solids (Academic Press, 1985). [Google Scholar]
Associated Data
This section collects any data citations, data availability statements, or supplementary materials included in this article.
Supplementary Materials
Supplementary Figure S1


