Abstract
Transferrin in cerebrospinal fluid (CSF) exists as a mixture of silao and asialo glycoforms believed to originate from liver and brain respectively. We have previously shown that alteration in the asialo glycoform pattern could be an indication of certain anomalies in the central nervous system. Additionally, CSF asialo-transferrin has been shown to be a reliable marker to assess cerebrospinal leakage in head trauma. Therefore, the CSF transferrin glycoform pattern could be a useful diagnostic and prognostic tool. In this study we sought to characterize, in-depth, the transferrin glycovariants in cerebrospinal fluid using a combination of two-dimensional gel electrophoresis and high precision mass spectrometry analysis. Cerebrospinal fluid transferrin was detected as multiple spots (seven major spots) with different isoelectric points and slight shift in apparent molecular mass. High resolution (>60,000) and high accuracy (< 3 ppm error) mass spectrometry analysis revealed that each spot had a unique glycopeptide signature. MSn analysis enabled characterization of the glycan structure directly from the in-gel digested spots. The multiple spots detected for cerebrospinal fluid transferrin were mainly due to heterogeneity of di-antennary and tri-antennary glycans harboring a varying number of terminal N-acetylneuraminic acids and the existence of a high mannose and high N-acetylhexosamine glycosylated species.
Keywords: transferrin, cerebrospinal fluid, glycoforms, glycopeptides, glycans, LTQ-Orbitrap XL, high resolution, accurate mass
1. Introduction
Transferrin (Tf) is a secreted glycoprotein that plays a crucial role in homeostasis and transport of iron [1]. Circulating serum Tf is fairly abundant and is produced mainly by the liver. Its primary sequence was first characterized by Edman sequencing [2, 3] and later confirmed by mass spectrometry analysis [4]. The mature secreted Tf, without the signal peptide, is composed of 679 amino acid residues and has two glycosylation sites at Asn432 and Asn630 (Asn413 and Asn611 in the mature form) that are often occupied by N-linked di-antennary and tri-antennary glycans harboring a varying number of terminal N-acetylneuramanic acid (NeuAc) residues, resulting in a heterogeneous population of Tf glycoforms [5, 6]. The three dimensional structure for both rabbit and chicken native Tf were resolved by x-ray crystallography and revealed that the protein is organized into two globular domains, an N-terminal and C-terminal domain, each containing a single iron biding site [7, 8]. Both glycosylation sites occur in the C-terminal domain and none in the N-terminal domain. The biological significance of the two glycans in respect to Tf function is not fully understood. However, it has been suggested that they might play a role in Tf solubility and binding to its receptor [9, 10].
Unlike circulating serum Tf, which exists exclusively as sialylated glycoforms, the circulating cerebrospinal fluid (CSF) Tf exists as a mixture of sialo and asialo glycoforms. It is believed that the CSF sialo-Tf originates from circulating serum Tf that crosses the brain blood barrier while the CSF asialo-Tf is locally synthesized by the brain and enters CSF circulation [11]. Actually, detection of asialo-Tf in the blood may be an indication of carbohydrate deficient glycoprotein syndrome often associated with alcohol abuse [12] or other congenital disorders of glycosylation known as CDG disorders [5, 13]. Inversely, absence of asialo-Tf in the CSF is abnormal and could indicate a serious neurological disorder, as we have previously demonstrated in patients with Vanishing White Matter (VWM) disease, a type of leukodystrophy characterized by deterioration of the white matter in the brain [14, 15]. The exact role of asialo-transferrin in the central nervous system is not well understood at present but it represents up to 30% of total circulating Tf in the CSF. Asialo-Tf is so specific to CSF that it is used as a diagnostic tool to identify CSF leakage in post-traumatic rhinorrhea and traumatic head injuries [16].
Serum circulating transferrin glycovariants have been well characterized, owing to its high abundance in the blood and easy access to serum samples. In contrast, only a few studies have characterized the Tf glycovariants in CSF. This is mainly due the overall low amount of protein in CSF samples (e.g. 0.3 to 0.7 μg of total protein per μL of CSF) and the challenges of accessing CSF samples.
We have previously characterized four Tf glycoforms and confirmed the structure of two using FTMS analysis of pooled samples [15]. In the present study, we sought to characterize, in-depth, each individual Tf glycovariant using the high resolving power of two-dimensional gel electrophoresis (2-DE) and high precision mass spectrometry analysis.
2. Experimental
2.1. Sample collection
All CSF samples were collected in accordance with an Institutional Review Board approved protocol at Children’s National Medical Center. Only excess CSF drawn for other clinical purposes was used for this study. Immediately after collection, each CSF sample was checked for blood contamination in a clinical laboratory by microscopy (assessing a standard cell count of erythrocytes and leukocytes per visualized field). The CSF samples were then centrifuged at 300 g for 10 min to remove any residual debris. The supernatants were transferred to clean polypropylene tubes and stored at −80 °C until analysis.
2.2. Sample preparation
Protein concentration was determined in each collected CSF sample using Bio-Rad protein assay dye reagent (Bio-Rad, Hercules, CA). A typical collected CSF sample had a protein concentration ranging from 0.16 to 0.4 μg/μL and total volume of 500 μL. Aliquots containing 100 μg of total protein were taken from each sample and processed for 2-DE analysis as described previously [15]. The gel was then stained using Bio-Safe Coomassie stain (Bio-Rad) and imaged as a TIFF file using GS800 densitometer scanner (Bio-Rad). Resolved Tf spots were excised separately using a clean polypropylene pipette and transferred to a polypropylene microcentrifuge tube containing 100 μL of deionized water. In gel digestion was performed as described previously using sequencing grade trypsin (Promega, Madison, WI) [17]. The peptides were extracted from each gel piece separately[17], dried by vacuum centrifugation, resuspended in 10 μL of 0.1% TFA and desalted by C18 ZipTip (Millipore, Billerica, MA) following manufacturer’s instructions. The samples were then analyzed by mass spectrometry as described below.
2.3. Mass spectrometry analysis
To verify Tf sequence coverage, peptide mass mapping was performed for each spot using a 4700 MALDI TOF-TOF mass spectrometer (Applied Biosystems, Carlsbad, CA) equipped with a Nd:YAG 200 Hz laser. The instrument was operated with delayed extraction in reflectron positive ion mode in the mass range from 700 to 4000 m/z. The instrument was externally calibrated using CalMix peptide standards (Applied Biosystems) with resolution better than 10,000 and accuracy better than 50 ppm.
Additional MS measurements were obtained using static nanospray in conjunction with high resolution (> 60,000) and high accuracy (< 3 ppm error) on a hybrid LTQ-Orbitrap XL (ThermoFisher, Waltham, MA). Desalted samples were dried by vacuum centrifugation and resuspended in 10 μL of nanospray buffer (45% water, 50% methanol and 5% acetic acid), loaded into a coated static nanospray glass PicoTip emitter (New Objective, Woburn, MA) with a 2 μm tip and sprayed into the LTQ-Orbitrap XL at 1.8 kV. The transfer line was set to 200°C. The instrument was externally calibrated using the manufacturer’s suggested tune solution. Mass spectra of peptides and glycopeptides were acquired in the LTQ-Orbitrap XL with 1 microscan, 100 ms maximum inject time and with the 100,000 resolution setting using the Tune software with real-time data recording (ThermoFisher). Spectra were acquired over several seconds and then averaged and deconvoluted in the Qual Browser and Xtract sofwares, respectively (ThermoFisher).
Glycopeptides were tentatively characterized with a GlycoMod software tool (http://us.expasy.org/tools/glycomod) by entering the observed masses using a mass accuracy of ± 5 ppm and the entire FASTA sequence of human Tf with full predicted tryptic peptides and the following potential modifications: oxidized Met residues, acetamide modified Cys residues and all possible sugar moieties for N-linked glycans.
The structure of the targeted glycopeptides, including glycan moiety, was further characterized by low energy CID MSn analysis with detection in the Orbitrap. All fragmentations were performed in the LTQ trap using the following conditions: isolation width of 2 Da, 1 microscan, 100 ms maximum injection time and varying collision energy from 20 to 40 until ideal fragmentation was obtained. To simplify data interpretation, MS and MS/MS spectra were averaged and deconvoluted to neutral or singly charged ion species and interpreted manually to check for accuracy.
3. Results
3.1. CSF transferrin exists as mixture of sialo and asiaolo glycoforms
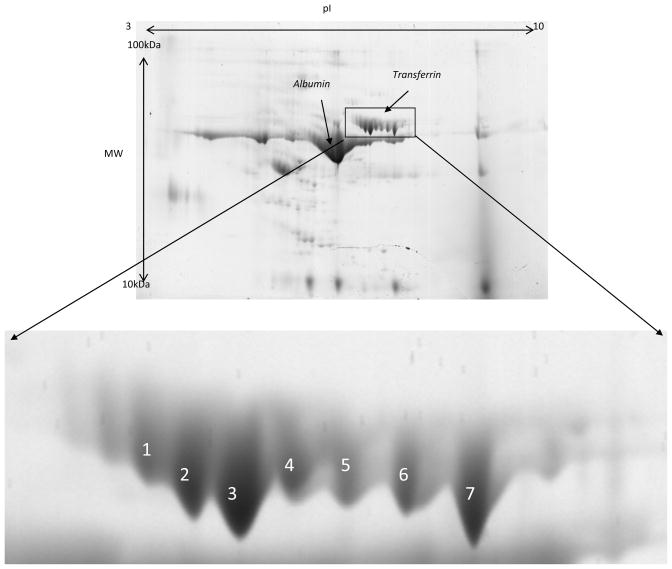
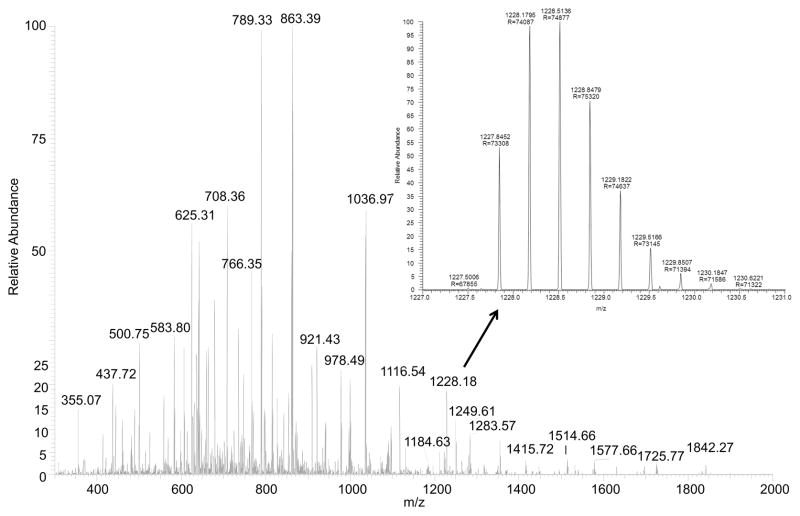
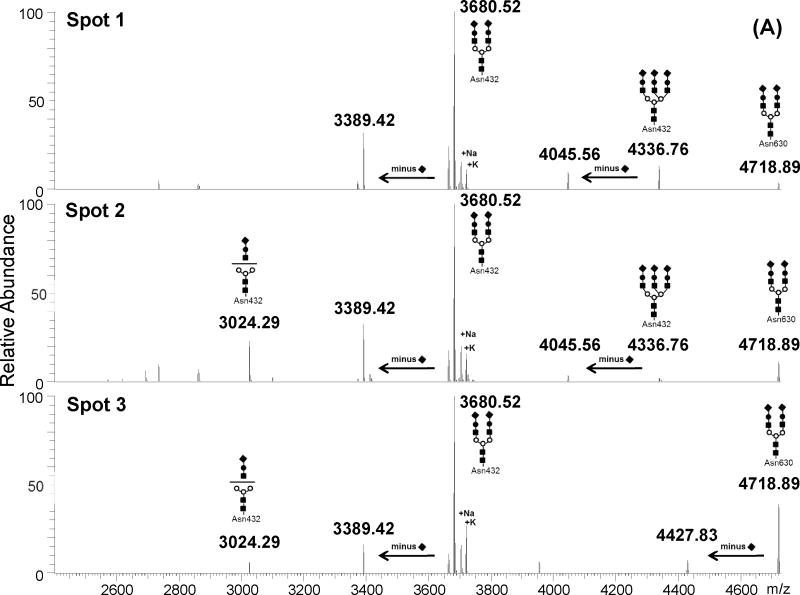
CSF Tf was detected as multiple spots (e.g. seven major spots) in the 2-DE analysis (Figure 1). A peptide mass fingerprint was obtained from each spot using in-gel digestion and high resolution mass spectrometry analysis. The sequence coverage for human Tf was better than 80% in each spot and all Cys residues were detected as alkylated (see supplemental Figure 1). Close examination of the detected peptides versus the predicted theoretical peptides revealed that the maps in all the spots were missing regions [CGLVPVLAENYNK] and [QQQHLFGSNVTDCSGNFCLFR] that encompass the known glycosylation sites Asn432 and Asn630 respectively. This suggests that these sites are possibly occupied by glycan moieties shifting their masses to higher m/z and therefore did not match any peptide sequence due the modifications. High resolution (> 60,000) and high accuracy (< 3 ppm error) mass measurements were obtained for peptides in each spot using a LTQ-Orbitrap XL mass spectrometer (Figure 2). This high resolution allowed better calibration of the instrument and generation of highly accurate masses. Obtained spectra were deconvoluted using Xtract software to facilitate data interpretation. While all the spots generated similar peptide mass fingerprints in the low mass range from 300 to 3000 m/z there was a distinct mass finger print in the 3000 to 5000 m/z region for each spot suggesting potential glycopeptides with variant glycan structures (Figure 3).
Figure 1. Representative 2-DE of 100 μg of CSF total proteins.
Zoom portion showing resolved spots corresponding to different transferrin glycolvariants.
Figure 2. High resolution mass spectrum (>70,000) of trypsin digested transferrin with zoom of a triply charged glycopeptide.
The zoom shows an example mass spectrum for a predicted glycopeptide detetected at m/z 1227.84 (z = 3). The glycopeptide was found to have the following sequence [cGLVPVAENYNK] modified at Asn432 by a bi-antennary glycan chain harboring two terminal NeuAc residues.
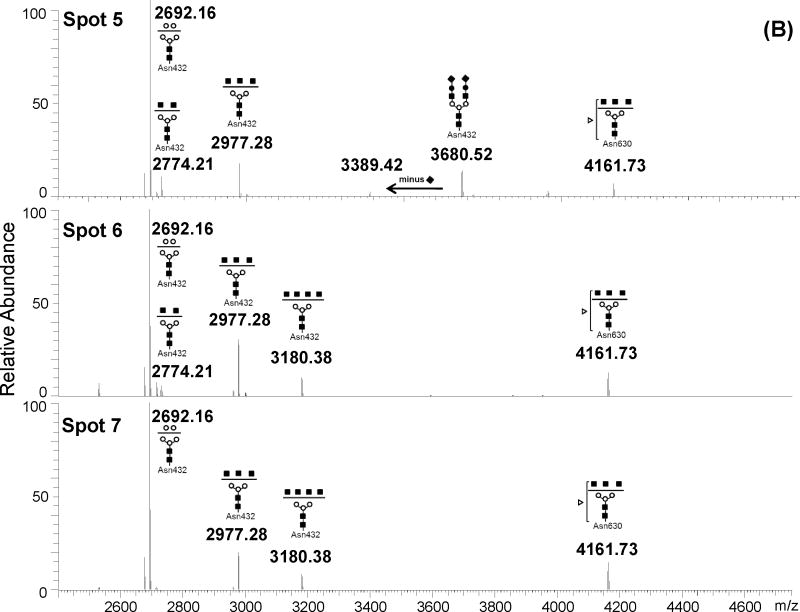
Figure 3. Deconvoluted mass spectrum of high m/z mass range of in-gel tryptic digests of CSF transferrin spots.
(A) monoisotopic masses obtained for spots 1 to 3. (B) monoisotopic masses obtained for spots 5 to 7. The glycopeptide structures indicated at the top of each peak were deduced from the monoitopic masses using GlycoMod tool, MS/MS analyses and literature NMR studies [5, 19]. Numbers at the top of each peak indicate the experimental singly charged m/z value.
As a first step, the monoisotopic values of these high m/z ions were uploaded into the GlycoMod tool (http://us.expasy.org/tools/glycomod/) to predict the putative structures of the corresponding glycopeptides. These predicted glycopeptides are listed in Table 1 with the observed m/z value, charge state and the potential glycan structure. The mass difference between observed and theoretical masses was less than ± 3 ppm for all detected ions, indicating high confidence in the predicted glycopeptide structures. Furthermore, these preliminary data show that all predicted glycopeptides encompass the expected glycosylation site in Tf (e.g. Asn432 and Asn630). The majority of predicted structures were bi or tri-antennary glycans with or without terminal sialic acid residues. Moreover, sialylated glycopeptides were exclusively detected in the acidic Spots 1 to 3 and completely absent in the basic Spots 5 to 7. Spot 4 contained a mixture of sialylated and unsialylated glycopeptides. Additionally, fucosylated species were detected only on the glycan structure attached to Asn630 but not the glycan structure attached to Asn432. Overall, the acidic Spots 1 to 3 contained Tf glycovariants bearing 2 to 5 sialic acid residues while basic Spots 5 to 7 contained asialo-Tf glycovariants with one fucose residue on the glycan chain attached to Asn630 (Figure 3). Furthermore, Tf glycovariants in Spots 6 and 7 contained high levels of N-acetylhexosamine (HexNAc) residues (up to 7 residues) compared to Tf glycovariants in Spots 1 to 5. This is in agreement with a previous study showing that the number of terminal sialic acid residues contributes to the negative shift in the pI of a glycoprotein in 2-DE analysis [18]. Table 2 summarizes the glycoforms detected in each spot, the approximate protein abundance in each spot and the relative mass spectral intensity ratios when a glycopeptide mixture was detected in a spot.
Table 1.
Detected m/z values for each transferrin spot with their predicted accurate masses and glycan compositions.
| Observed m/z | z | Observed Mass, Da | Peptide Sequence | Theoretical Mass, Da | Δ Mass, ppm | Predicted Glycan Structure |
|---|---|---|---|---|---|---|
| Spot 1 | (monoisotopic) | (monoisotopic) | ||||
| 1227.8466 | 3 | 3680.516 | cGLVPVAENYNK | 3680.516 | 0.084 | (Hex)2 (HexNAc)2 (NeuAc)2 + (Man)3(GlcNAc)2 |
| 1446.5866 | 3 | 4336.736 | cGLVPVAENYNK | 4336.744 | −1.772 | (Hex)3 (HexNAc)3 (NeuAc)3 + (Man)3(GlcNAc)2 |
| 1573.9712 | 3 | 4718.890 | QQQHLFGSNVTDCSGNFcLFR | 4718.889 | 0.235 | (Hex)2 (HexNAc)2 (NeuAc)2 + (Man)3(GlcNAc)2 |
| 1841.2657 | 2 | 3680.516 | cGLVPVAENYNK | 3680.516 | −0.070 | (Hex)2 (HexNAc)2 (NeuAc)2 + (Man)3(GlcNAc)2 |
| Spot 2 | ||||||
| 1227.8460 | 3 | 3680.515 | cGLVPVAENYNK | 3680.516 | 0.405 | (Hex)2 (HexNAc)2 (NeuAc)2 + (Man)3(GlcNAc)2 |
| 1446.5882 | 3 | 4336.741 | cGLVPVAENYNK | 4336.744 | 0.666 | (Hex)3 (HexNAc)3 (NeuAc)3 + (Man)3(GlcNAc)2 |
| 1573.9698 | 3 | 4718.886 | QQQHLFGSNVTDCSGNFcLFR | 4718.889 | 0.655 | (Hex)2 (HexNAc)2 (NeuAc)2 + (Man)3(GlcNAc)2 |
| 1841.2654 | 2 | 3680.515 | cGLVPVAENYNK | 3680.516 | 0.234 | (Hex)2 (HexNAc)2 (NeuAc)2 + (Man)3(GlcNAc)2 |
| 1513.1514 | 2 | 3024.287 | cGLVPVAENYNK | 3024.288 | 0.284 | (Hex)1 (HexNAc)1 (NeuAc)1 + (Man)3(GlcNAc)2 |
| Spot 3 | ||||||
| 1227.8452 | 3 | 3680.512 | cGLVPVAENYNK | 3680.516 | 1.057 | (Hex)2 (HexNAc)2 (NeuAc)2 + (Man)3(GlcNAc)2 |
| 1573.9694 | 3 | 4718.885 | QQQHLFGSNVTDCSGNFcLFR | 4718.889 | 0.909 | (Hex)2 (HexNAc)2 (NeuAc)2 + (Man)3(GlcNAc)2 |
| 1622.6556 | 3 | 4864.943 | QQQHLFGSNVTDCSGNFcLFR | 4864.947 | 0.758 | (Hex)2 (HexNAc)2 (Deoxyhexose)1(NeuAc)2 + (Man)3(GlcNAc)2 |
| 1841.2640 | 2 | 3680.512 | cGLVPVAENYNK | 3680.516 | 0.994 | (Hex)2 (HexNAc)2 (NeuAc)2 + (Man)3(GlcNAc)2 |
| 1513.1494 | 2 | 3024.283 | cGLVPVAENYNK | 3024.288 | 1.607 | (Hex)1 (HexNAc)1 (NeuAc)1 + (Man)3(GlcNAc)2 |
| Spot 4 | ||||||
| 1227.8434 | 3 | 3680.507 | cGLVPVAENYNK | 3680.516 | 2.524 | (Hex)2 (HexNAc)2 (NeuAc)2 + (Man)3(GlcNAc)2 |
| 1347.088 | 2 | 2692.160 | cGLVPVAENYNK | 2692.167 | 2.474 | (Hex)2 + (Man)3(GlcNAc)2 |
| 1573.9669 | 3 | 4718.877 | QQQHLFGSNVTDCSGNFcLFR | 4718.889 | 2.498 | (Hex)2 (HexNAc)2 (NeuAc)2 + (Man)3(GlcNAc)2 |
| 1622.6499 | 3 | 4864.926 | QQQHLFGSNVTDCSGNFcLFR | 4864.947 | 4.273 | (Hex)2 (HexNAc)2 (Deoxyhexose)1(NeuAc)2 + (Man)3(GlcNAc)2 |
| 1841.2621 | 2 | 3680.509 | cGLVPVAENYNK | 3680.516 | 2.027 | (Hex)2 (HexNAc)2 (NeuAc)2 + (Man)3(GlcNAc)2 |
| Spot 5 | ||||||
| 1347.0876 | 2 | 2692.160 | cGLVPVAENYNK | 2692.167 | 2.771 | (Hex)2 + (Man)3(GlcNAc)2 |
| 1388.2474 | 3 | 4161.719 | QQQHLFGSNVTDCSGNFcLFR | 4161.730 | 2.713 | (HexNAc)3 (Deoxyhexose)1 + (Man)3(GlcNAc)2 |
| 1489.6536 | 2 | 2977.292 | cGLVPVAENYNK | 2977.299 | 2.506 | (HexNAc)3 + (Man)3(GlcNAc)2 |
| 1388.1147 | 2 | 2774.214 | cGLVPVAENYNK | 2774.220 | 2.256 | (HexNAc)2 + (Man)3(GlcNAc)2 |
| 1841.2621 | 2 | 3680.509 | cGLVPVAENYNK | 3680.516 | 2.027 | (Hex)2 (HexNAc)2 (NeuAc)2 + (Man)3(GlcNAc)2 |
| Spot 6 | ||||||
| 1347.0891 | 2 | 2692.163 | cGLVPVAENYNK | 2692.167 | 1.657 | (Hex)2 + (Man)3(GlcNAc)2 |
| 1388.2488 | 3 | 4161.723 | QQQHLFGSNVTDCSGNFcLFR | 4161.730 | 1.704 | (HexNAc)3 (Deoxyhexose)1 + (Man)3(GlcNAc)2 |
| 1489.6552 | 2 | 2977.295 | cGLVPVAENYNK | 2977.299 | 1.431 | (HexNAc)3 + (Man)3(GlcNAc)2 |
| 1388.1147 | 2 | 2774.214 | cGLVPVAENYNK | 2774.220 | 2.256 | (HexNAc)2 + (Man)3(GlcNAc)2 |
| 1591.1980 | 2 | 3180.380 | cGLVPVAENYNK | 3180.379 | −0.421 | (HexNAc)4 + (Man)3(GlcNAc)2 |
| Spot 7 | ||||||
| 1347.0929 | 2 | 2692.170 | cGLVPVAENYNK | 2692.167 | −1.166 | (Hex)2 + (Man)3(GlcNAc)2 |
| 1388.2526 | 3 | 4161.734 | QQQHLFGSNVTDCSGNFcLFR | 4161.730 | −1.036 | (HexNAc)3 (Deoxyhexose)1 + (Man)3(GlcNAc)2 |
| 1489.6585 | 2 | 2977.301 | cGLVPVAENYNK | 2977.299 | −0.786 | (HexNAc)3 + (Man)3(GlcNAc)2 |
| 1591.1929 | 2 | 3180.37014 | cGLVPVAENYNK | 3180.379 | 2.786 | (HexNAc)4 + (Man)3(GlcNAc)2 |
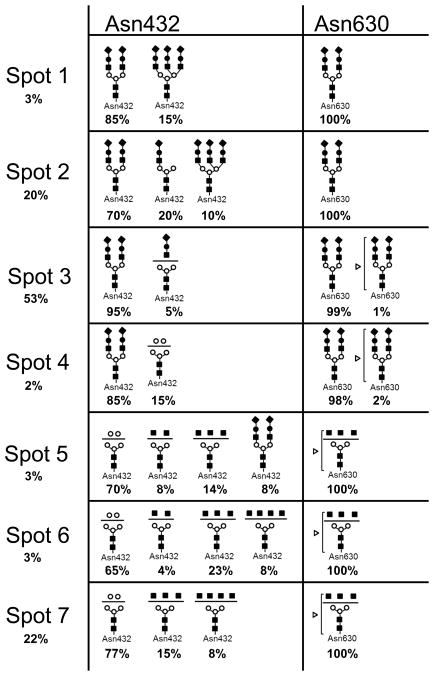
Table 2. Potential transferrin glycovariants detected in each transferrin 2-DE spot.
The relative amount of Tf glycovariants in each spot was deduced from the relative intensity of its corresponding spot to the total and is indicated as (%) in column 1. When a glycopeptide mixture was detected in a given spot, relative abundance for each species was deduced from the relative peak intensities in the deconvoluted mass spectra and these are indicated in (%) under each glycopeptide structure. For example, Spot 3 contained 95% of Tf glycovariant harboring a bi-antennary sialilated glycan at both Asn432 and Asn630 and minor Tf glycovariant (1 to 5%) harboring a truncated glycan at Asn432 and a trace amount of a fucosylated glycan at Asn630 [5, 19].
|
3.2. Confirmation of the of the glycopeptide structure using MSn analysis
To further confirm the structure of the predicted glycopepetides, each corresponding ion was subjected to MSn analysis using CID in the LTQ ion trap with readout in the Orbitrap. Figure 4 shows example mass spectra for two glycopeptides with masses of 3680.52 Da and 2692.16 Da detected in Spots 1 to 4 and Spots 4 to 7 respectively. These ions were predicted by the GlycoMod tool to correspond to the same peptide [cGLVPVAENYNK] with two different glycan structures. MS/MS analysis of intact glycopeptides using low energy CID often produces fragments in the glycosidic bonds leaving the peptide backbone intact thus allowing confirmation of the glycan composition without the confounding background from peptide fragmentation. However, it is important to point out that CID alone cannot fully characterize the exact topology of the glycans and branching. Thus, whenever possible we used previously NMR characterized serum and amniotic fluid human transferrin glycan structures to back up our proposed structure for the human CSF transferrin [5, 19, 20].
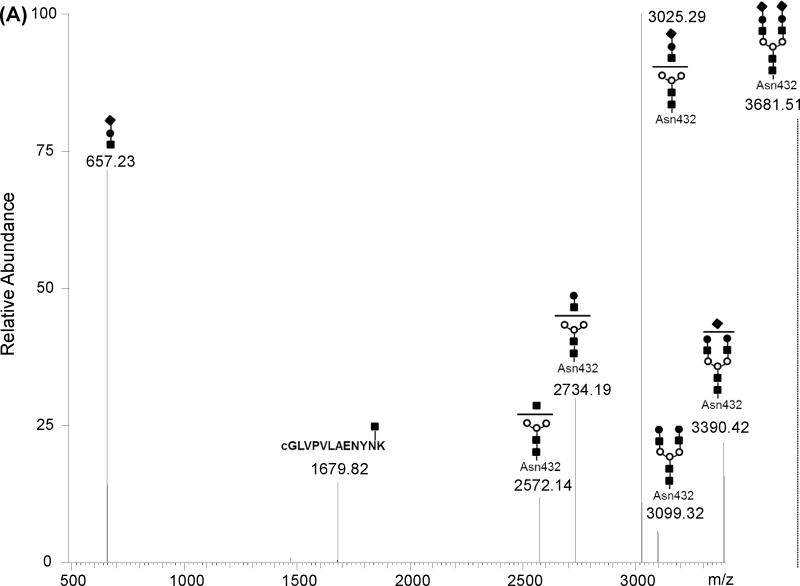
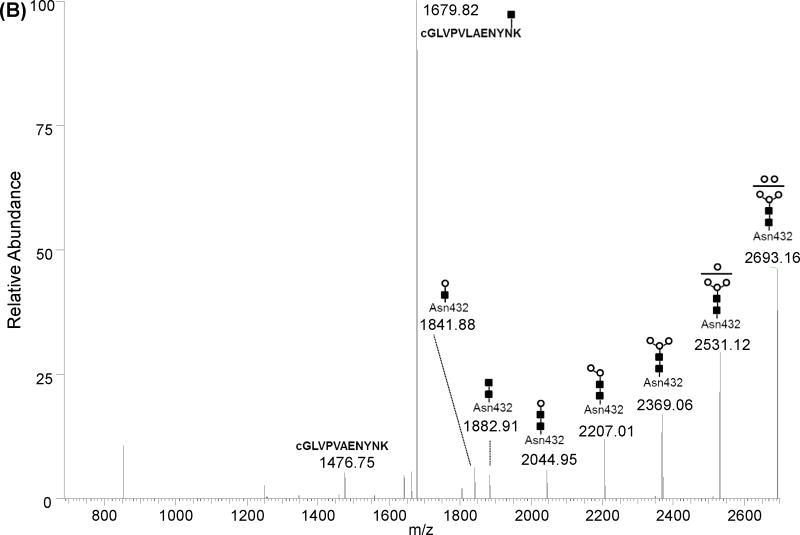
Figure 4. Deconvoluted static nanospray tandem mass spectra of two glycovariant peptides.
(A) MS/MS of a glycopeptide at m/z 1227.85 (z = 3) detected in Spot 3 was deconvoluted to singly charged fragment ions. (B) glycopeptide at m/z 1347.09 (z = 2) detected in Spot 6 was deconvoluted to singly charged fragment ions. Both glycopeptides were attributed to the following peptide sequence [cGLVPVAENYNK] modified by different glycan structures. m/z values correspond to the observed singly charged species.
Figure 4A shows the deconvoluted MS/MS spectrum of the triply charged ion at m/z 1227.84 corresponding to the potential glycopepetide with mass 3680.52 Da that was detected in Spots 1 to 4. The structure of this glycopeptide was predicted by GlycoMod tool and was attributed to the [cGLVPVAENYNK] peptide modified at Asn432 by a bi-antennary glycan chain harboring two terminal NeuAc residues. As shown in Figure 4A, MS/MS analysis of this glycopeptide yielded recognizable fragment ions at m/z 3390.42 and 3099.32 corresponding to the loss of one and two NeuAc residues from the parent ion at m/z 3681.51 respectively. A prominent fragment ion was detected at m/z 3025.29 and corresponded to the loss of an entire antenna [NeuAc-Hex-HexNAc] from the parent glycopeptide. Other recognizable fragments include ions at m/z 2734.19 and 2572.14 that are attributed to the loss of an entire antenna [NeuAc-Hex-HexNAc] plus one NeuAc or an entire antenna [NeuAc-Hex-HexNAc] plus a half antenna [NeuAc-Hex] from the glycopeptide respectively. Finally, the ion at m/z 1679.82 is attributed to the peptide backbone with one HexNAc residue (e.g. N-acetylgalactosamine) and the low mass fragment ion at m/z 657.23 is attributed to the [NeuAc-Hex-HexNac] fragment that retained a positive charge during fragmentation.
Figure 4B shows the deconvoluted MS/MS spectrum of the doubly charged ion at m/z 1347.09 corresponding to the prominent glycopeptide with mass of 2692.16 Da that was detected in Spots 4 to 7 and not in the acidic Spots 1 to 3 of 2-DE resolved Tf glycovariants (see Figure 3). This ion was predicted to correspond to the [cGLVPVAENYNK] peptide modified by a bi-antennary high mannose containing a glycan chain without terminal galactose (Gal) and sialic acid (NeuAc). Deconvolution of the raw data to singly charged species facilitated fragment assignment (Figure 4B). MS/MS of this glycopeptide was much easier for readout than MS/MS of the corresponding sialylated glycopeptide (4A). Indeed both parent ion and fragment ions are detected in the spectrum. The first five fragment ions at m/z 2531.12, 2369.06, 2207.01, 2044.95 and 1882.91 are all spaced by 162.05 Da and correspond to the loss of 1, 2, 3, 4 and 5 Man residues from the singly charged parent ion at m/z 2693.16. The prominent ion at m/z 1679.82 corresponds to the same as the one detected in Figure 4A, and is attributed to the peptide backbone with one HexNAc residue (e.g. N-acetylgalactosamine) while the ion at m/z 1476.75 corresponds exactly to the mass of the naked peptide with one proton. This fragment was detected as singly charged species in the MS/MS spectrum of the parent glycopeptide (see supplemental Figure 2). The ion at m/z 1841.88 is of particular interest and was assigned as a rearrangement fragment ion corresponding to the peptide backbone with HexNAc and an additional Man residue. This transfer of a Man residue to the innermost N-acetylglucosamine was previously reported and is believed to occur in MS/MS analysis of high mannose containing glycopeptides [21].
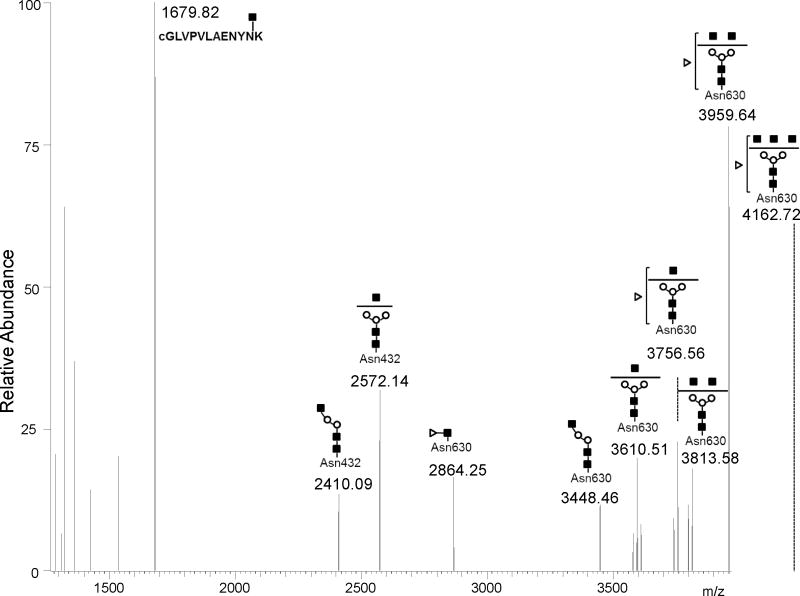
Another interesting glycosylation structure that distinguished the acidic Tf glycovariants from the basic Tf glycovatriants is the potential glycopeptide with mass 4161.73 Da detected in Spots 5 to 7. The structure of this glycopeptide was predicted by GlycoMod tool to correspond to the [QQQHLFGSNVTDcSGNFCLFR] sequence modified at Asn630 by a possible bi-antennary glycan structure with a fucose (see Figure 3). Low energy MS/MS fragmentation of the triply charged ion at m/z 1388.25 generated a quite complex spectrum compared to the other glycopeptides above owing to the nature of this glycopeptide and to partial co-isolation of the double charged species at 1388.12 Da of the bi-antennary glycan chain harboring two terminal NeuAc residues at the Asn432 location (see Figure 4A). Again, the raw data was deconvoluted to singly charged ions facilitating fragment assignment. As shown in Figure 5, several glycopeptide fragments corresponding to sequential loss of HexNAc residues and Hex residues were found, including the fucose residue from the parent glycopeptides. However, the exact position of the fucose residue is questionable. Previous studies assumed that the fucose is preferentially attached to the innermost HexNAc residue via an α1–6 bond [11]. While the fragment ion at m/z 2864.25 confirms this possibility, detection of numerous fragment ions with terminal HexNAc and missing the fucose residue simultaneously suggests a potential mixture of core and antenna fucosylated species (see previous study by Satomi et al. [22]) or rearrangement in the mass spectrometer, as previously reported by Wuhrer, et al. [23]. Therefore the current CID analysis leaves the fucose placement as ambiguous. Further studies such as MS/MS of cationized glycopeptides might be needed to fully characterize the fucose position [24].
Figure 5. Deconvoluted static nanospray tandem mass spectra of the glycopeptide at m/z 1388.25 (z = 2) detected in Spot 6.
Partial contamination by fragments from a glycopeptide at m/z 1388.11 (z = 3) were also detected in the spectrum. m/z values correspond to the observed singly charged species
Additional MS/MS of potential glycopetides in the other 2-DE spots further confirmed the glycan structures predicted by GlycoMod tool from the accurate mass measurements as shown in Table 1. These include the tri-antennary sialylated glycan attached to the [cGLVPVAENYNK] peptide. This glycopeptide was detected mainly in Spot 1 and in small amount in Spot 2 but absent in the other spots (Figure 3 and Table 2). This glycopeptide has a mass of 4336.73 Da and was found to contain up to three NeuAc residues by MS/MS analysis thus explaining the low pI and slight shift in mass of Spot 1 and 2 relative to the other spots that contained mainly bi-antennary glycans with low number to no NeuAc residues. This is in agreement with the NMR resolved structure of tri-antennary sialylated glycans isolated from human serum Tf [19]. Inversely, Spots 6 and 7 contained glycopeptides with a mass of 3180.38 Da that was assigned to [cGLVPVAENYNK] peptide modified by asialo and agalacto glycan containing 4 terminal GlcNAc residues, hence the high pI of Tf glycovariants in Spot 6 and 7. Another potential glycoprotein detected in very low amounts in Spots 3 and 4 was modified by a bi-antennary sialylated glycan with a fucose (Table 2).
Table 2 summarizes the major Tf glycovariants found in “normal” CSF samples with their glycan structures and relative mass spectrometry abundances when a mixture was detected. It is clear from these data that CSF Tf is mainly modified by sialylated bi-antennary glycan chains at both Asn432 and Asn630. Spot 1 however, contained non negligible amounts of Tf modified by tri-and bi-antennary sialylated glycan structures at Asn432 and Asn630, respectively. The tri-antennary sialylated glycolsylation seems to be favored at Asn432 over Asn630. In fact, we did not detect any tri-antennary glycosylation at Asn630. Whether a tri-antennary sialylated glycan modification at Asn630 exists, remains to be carefully examined. This tri-antennary carbohydrate chain occupying Asn432 was also detected in Spot 2 but in very low abundance compared to Spot 1 (Figure 3A). Instead, Tf in Spot 2 was mainly modified by disialo bi-antennary glycan structures at Asn432 (e.g. 3680.52 Da glycopeptide) and Asn630 (e.g. 4718.89 Da glycopeptide). Additionally, Spot 2 also contained a minor glycovariant missing an entire antenna from the disialo bi-antennary glycan attached to Asn432 (e.g. 3024.29 Da glycopeptide). This truncated species was absent in Spot 1. Spot 3 also contained Tf glycovariant mainly modified by disialo bi-antennary glycans at both Asn432 and Asn630 but did not contain any tri-antennary sialylated glycans as in Spot 1 and 2. Overall, glycovariants in Spots 1, 2 and 3 contained a mixture of tri and bi-antennary glycans with varying number of terminal NeuAc. These glycovariants most likely originated from liver since they were similar to those reported for serum purified human serotransferrin [5, 22].
Spots 5 to 7 contained completely different types of Tf glycovariants mainly harboring bi-antennary glycans without any terminal NeuAc or Gal residues except for Spot 5 which contained a small trace of mono and di-sialylated terminal Gal residues. The most abundant glycosylation in these basic spots consisted of high mannose type bi-antennary glycan exclusively attached to Asn432 (e.g. 2692.16 Da glycopeptide) and a fucose modified bi-antennary glycan exclusively attached to Asn630 (e.g. 4161.73 Da glycopeptide). The main difference distinguishing Tf glycovariants in these basic spots is the occurrence of a tetra-antennary asialo and agalacto-glycan exclusively attached to Asn432 (e.g. 3180.38 Da glycopeptide). This glycopeptide was detected only in Spots 6 and 7 but not in Spot 5, thus explaining the basic nature of Tf glycovariants in Spot 6 and 7 over Spot 5. Spot 4, however, contained a mixture of glycans found in both the acidic and basic Tf glycovariants and agrees with its pI position.
4. Discussion
Cerebrospinal fluid circulating Tf exhibited more heterogeneous glycovariants than serum circulating Tf. The use of high resolving 2-DE and high precision analysis on the LTQ-Orbitrap XL enabled in-depth characterization of the Tf glycovariants in the CSF. Glycopeptides were readily detected from in-gel digested spots using nanospray ionization and further characterized by MS/MS analyses. All the glycopeptides, including the sialylated forms, were detected as protonated species. Minor satellite peaks corresponding to sodium and potassium adducts as well as loss of ammonia (−17 Da) were seen for the most intense ions (see Figure 3). Prediction of glycopeptide structures was facilitated by accurate mass measurement (< 3 ppm error, Table 1). Furthermore, MS/MS analyses confirmed the structure of all detected glycopeptides. Fragmentations occurred exclusively at the glycosidic bonds thus facilitating the characterization of the glycan composition attached to the peptide. It is important to emphasize that CID of protonated glycopetides does not allow full topology characterization of the glycan attached to the peptide but still can be used to confirm or identify the type and number of sugar moieties in the glycan. Thus, whenever possible we have supported our proposed glycan structures with previous NMR studies of human transferrin extracted from different biological fluids including serum [5, 19] and amniotic fluid [20]. The main differences found between circulating CSF Tf and circulating blood Tf is the existence of asialo-agalato forms representing approximately 30% of total Tf in the CSF (Figure 1). Asialo-Tf glycovariants do not normally occur in the blood except in cases of CDG or alcohol abuse but occurrence in CSF is normal. The glycan structures of CSF sialo-Tf resemble those reported for serum circulating Tf [22, 25, 26] while the glycans of the asialo-Tf in the CSF have completely different types of terminal sugar residues. For instance, transferrin bearing asialo fucosylated glycan structure with three terminal GlcNAc occurred in significant amounts in the CSF Tf (Figure 3B, m/z 4161.73) while their presence in serum Tf is very low to absent, except in patients with secondary CDG due to galactosemia [26]. In general, asialo glycoproteins are rapidly cleared by a hepatic asialoglycoprotein receptor, also known as the Ashwell-Morell receptor [27–30]. However, in the CSF, this type of asialo-Tf seems to be favored. Whether this is due to the lack of asialoglycorptein receptor or to specific glycosylation enzymes in the brain remains to be carefully investigated. But, the second hypothesis seems more plausible since we have previously shown that patients with vanishing white mater disease loose expression of brain type asialo-transferrin [14, 15]. Additionally, the glycan structures in the asialo-Tf in CSF are completely different from those detected in the serum asialo-transferrin of individuals with alcoholic liver disease [31] and/or with carbohydrate deficient syndrome type II [5]. It has been suggested that asialo-Tf in CSF probably results from the low levels of glycosyltransferase and sialyltransferase and concomitant high levels of fucosyl transferase activities in the brain [11]. Furthermore, the asialo-Tf contained up to 4 terminal GlcNAc residues, probably as tetra-antennary structures, that could be attributed to the activity of specific glycosyltransferases that exist exclusively in the brain but not in other organs [32].
Another characteristic of circulating CSF Tf is the occurrence of a high mannose containing glycan at Asn432 (e.g. 2692.16 Da). This glycopeptide was detected in the basic Tf glycovariants (Spots 4 to 7) and completely absent in the acidic glycovariants (Spots 1 to 3). We previously predicted this glycopeptide to harbor a Man5GlcNAc2- glycan using accurate mass measurement and GlycoMod prediction tool [15]. In the present study, we further confirmed the structure of this high mannose containing glycopeptide using both accurate MS and MS/MS analyses. This glycan type seems to be unique to CSF circulating Tf and undetectable to absent in serum Tf [20]. However, and to the best of our knowledge, this type of high mannose glycan structure has never been detected or reported in the native human serum transferrin except when human Tf is produced in insect cells as a recombinant protein [33, 34]. Protein modification by high mannose containing glycan is usually considered to be the first step in glycoprotein biosynthesis where a glycan structure with up to 9 mannose residues is transferred to the site of glycosylation, then the mannose residues are cleaved by specific α-mannosidase enzymes to generate Man5GlcNAc2-Asn structure to be replaced by N-acetylglucosamine and galactose residues (for more details see Chapter 7 in Essentials of Glycobiology [35]). During this process, Man5GlcNAc2- transferrin could escape further glycosylation and be secreted into the CSF prematurely, however the existence of a brain specific glycosylation enzyme responsible for the synthesis of high mannose Tf is also a possibility. Indeed this type of glycosylation was fairly abundant in the CSF Tf and could be specific to the brain and was different from the high mannose glycan detected in serum glycoproteins in the case of cancer progression [36].
5. Conclusion
The glycopeptide fingerprint can be easily obtained from individual 2-DE resolved Tf spots and could serve as quick reference to screen for CNS related pathogenesis. From these data it is clear that human circulating CSF Tf is composed of several glycovariants modified by heterogenous glycan structures. It probably consists of a mixture of serum type and brain type Tf glycovariants. The role of brain specific Tf glycovariants is not well known at present, but the modified glycan structure could affect receptor binding and function. This glycosylation pattern of Tf in CSF is unique and could also be used as a test tool for screening neurodegenerative diseases or to check for CSF leakage in traumatic brain injuries.
Supplementary Material
Sequence coverage of identified transferrin peptides shown in red. Peptides not detected shown in black. Peptides not detected and suspected to be glycopeptides shown in blue.
Tandem mass spectrum of m/z 1347.09 (z = 2) in Spot 3. m/z values correspond to singly charged species.
Highlights.
Cerebrospinal fluid transferrin exists as a mixture of sialo and asialo glycoforms.
Cerebrospinal fluid asialo-transferrin is a specific brain-type and does not normally occur in blood.
Altered glycosylation patterns in cerebrospinal fluid transferrin is indicative of neurodegenerative diseases.
Acknowledgments
This work was partially supported by NIH core grants: NCMRR/NINDS 2R24HD050846-06 (National Center for Medical Rehabilitation Research) and IDDRC 5P30HD040677-10 (Intellectual and Developmental Disabilities Research Center) and by NIH NCRR UL1RR031988 (GWU-CNMC CTSI) for Drs. Brown, Hoffman and Hathout and by K12HD001399-04, NIH, NICHD K12 CHRCD Award for Dr. Vanderver.
Abbreviations
- CSF
cerebrospinal fluid
- Tf
transferrin
- TFA
trifluoroacetic acid
- ppm
parts per million
- MS
mass spectrometry
- MS/MS,MSn
tandem mass spectrometry
- VWM
vanishing white matter
- 2-DE
two-dimensional gel electrophoresis
- min
minute(s)
- Da
Dalton
- ms
millisecond
- μm
micrometer
- m/z
mass-to-charge
- Met
methionine
- Cys
cysteine
- c
acetamide modified cysteine
- Gal
galactose
- Hex
hexose
- Man
mannose
- Fuc
fucose
- NeuAc
N-acetylneuraminic acid or sialic acid
- HexNAc
N-acetylhexosamine
- GlcNAc
N-acetylglucosamine
- CNS
central nervous system
Footnotes
Publisher's Disclaimer: This is a PDF file of an unedited manuscript that has been accepted for publication. As a service to our customers we are providing this early version of the manuscript. The manuscript will undergo copyediting, typesetting, and review of the resulting proof before it is published in its final citable form. Please note that during the production process errors may be discovered which could affect the content, and all legal disclaimers that apply to the journal pertain.
References
- 1.Crichton RR, Charloteaux-Wauters M. Iron transport and storage. Eur J Biochem. 1987;164:485–506. doi: 10.1111/j.1432-1033.1987.tb11155.x. [DOI] [PubMed] [Google Scholar]
- 2.MacGillivray RT, Mendez E, Shewale JG, Sinha SK, Lineback-Zins J, Brew K. The primary structure of human serum transferrin. The structures of seven cyanogen bromide fragments and the assembly of the complete structure. J Biol Chem. 1983;258:3543–3553. [PubMed] [Google Scholar]
- 3.MacGillivray RT, Mendez E, Sinha SK, Sutton MR, Lineback-Zins J, Brew K. The complete amino acid sequence of human serum transferrin. Proc Natl Acad Sci U S A. 1982;79:2504–2508. doi: 10.1073/pnas.79.8.2504. [DOI] [PMC free article] [PubMed] [Google Scholar]
- 4.Mason AB, Miller MK, Funk WD, Banfield DK, Savage KJ, Oliver RW, Green BN, MacGillivray RT, Woodworth RC. Expression of glycosylated and nonglycosylated human transferrin in mammalian cells. Characterization of the recombinant proteins with comparison to three commercially available transferrins. Biochemistry. 1993;32:5472–5479. doi: 10.1021/bi00071a025. [DOI] [PubMed] [Google Scholar]
- 5.Coddeville B, Carchon H, Jaeken J, Briand G, Spik G. Determination of glycan structures and molecular masses of the glycovariants of serum transferrin from a patient with carbohydrate deficient syndrome type II. Glycoconj J. 1998;15:265–273. doi: 10.1023/a:1006997012617. [DOI] [PubMed] [Google Scholar]
- 6.de Jong G, van Noort WL, van Eijk HG. Carbohydrate analysis of transferrin subfractions isolated by preparative isoelectric focusing in immobilized pH gradients. Electrophoresis. 1992;13:225–228. doi: 10.1002/elps.1150130146. [DOI] [PubMed] [Google Scholar]
- 7.Bailey S, Evans RW, Garratt RC, Gorinsky B, Hasnain S, Horsburgh C, Jhoti H, Lindley PF, Mydin A, Sarra R, Watson JL. Molecular structure of serum transferrin at 3.3-A resolution. Biochemistry. 1988;27:5804–5812. doi: 10.1021/bi00415a061. [DOI] [PubMed] [Google Scholar]
- 8.Kurokawa H, Mikami B, Hirose M. Crystal structure of diferric hen ovotransferrin at 2.4 A resolution. J Mol Biol. 1995;254:196–207. doi: 10.1006/jmbi.1995.0611. [DOI] [PubMed] [Google Scholar]
- 9.Hemmaplardh D, Morgan EH. Transferrin uptake and release by reticulocytes treated with proteolytic enzymes and neuraminidase. Biochim Biophys Acta. 1976;426:385–398. doi: 10.1016/0005-2736(76)90384-9. [DOI] [PubMed] [Google Scholar]
- 10.Putnam FW. The Plasma Proteins. In: Putnam FW, editor. The Plasma Proteins. Vol. 1. Academic Press; New York: 1975. pp. 265–315. [Google Scholar]
- 11.Hoffmann A, Nimtz M, Getzlaff R, Conradt HS. ‘Brain-type’ N-glycosylation of asialo-transferrin from human cerebrospinal fluid. FEBS Lett. 1995;359:164–168. doi: 10.1016/0014-5793(95)00034-7. [DOI] [PubMed] [Google Scholar]
- 12.Bergstrom JP, Helander A. Influence of alcohol use, ethnicity, age, gender, BMI and smoking on the serum transferrin glycoform pattern: implications for use of carbohydrate-deficient transferrin (CDT) as alcohol biomarker. Clin Chim Acta. 2008;388:59–67. doi: 10.1016/j.cca.2007.10.011. [DOI] [PubMed] [Google Scholar]
- 13.Stadheim LM, O’Brien JF, Lindor KD, Gores GJ, McGill DB. Value of determining carbohydrate-deficient transferrin isoforms in the diagnosis of alcoholic liver disease. Mayo Clin Proc. 2003;78:703–707. doi: 10.4065/78.6.703. [DOI] [PubMed] [Google Scholar]
- 14.Vanderver A, Hathout Y, Maletkovic J, Gordon ES, Mintz M, Timmons M, Hoffman EP, Horzinski L, Niel F, Fogli A, Boespflug-Tanguy O, Schiffmann R. Sensitivity and specificity of decreased CSF asialotransferrin for eIF2B-related disorder. Neurology. 2008;70:2226–2232. doi: 10.1212/01.wnl.0000313857.54398.0e. [DOI] [PMC free article] [PubMed] [Google Scholar]
- 15.Vanderver A, Schiffmann R, Timmons M, Kellersberger KA, Fabris D, Hoffman EP, Maletkovic J, Hathout Y. Decreased asialotransferrin in cerebrospinal fluid of patients with childhood-onset ataxia and central nervous system hypomyelination/vanishing white matter disease. Clin Chem. 2005;51:2031–2042. doi: 10.1373/clinchem.2005.055053. [DOI] [PubMed] [Google Scholar]
- 16.Warnecke A, Averbeck T, Wurster U, Harmening M, Lenarz T, Stover T. Diagnostic relevance of beta2-transferrin for the detection of cerebrospinal fluid fistulas. Arch Otolaryngol Head Neck Surg. 2004;130:1178–1184. doi: 10.1001/archotol.130.10.1178. [DOI] [PubMed] [Google Scholar]
- 17.Jensen ON, Wilm M, Shevchenko A, Mann M. Sample preparation methods for mass spectrometric peptide mapping directly from 2-DE gels. Methods Mol Biol. 1999;112:513–530. doi: 10.1385/1-59259-584-7:513. [DOI] [PubMed] [Google Scholar]
- 18.Barrabes S, Sarrats A, Fort E, De Llorens R, Rudd PM, Peracaula R. Effect of sialic acid content on glycoprotein pI analyzed by two-dimensional electrophoresis. Electrophoresis. 2010;31:2903–2912. doi: 10.1002/elps.200900764. [DOI] [PubMed] [Google Scholar]
- 19.Spik G, Debruyne V, Montreuil J, van Halbeek H, Vliegenthart JF. Primary structure of two sialylated triantennary glycans from human serotransferrin. FEBS Lett. 1985;183:65–69. doi: 10.1016/0014-5793(85)80955-8. [DOI] [PubMed] [Google Scholar]
- 20.van Rooijen JJ, Jeschke U, Kamerling JP, Vliegenthart JF. Expression of N-linked sialyl Le(x) determinants and O-glycans in the carbohydrate moiety of human amniotic fluid transferrin during pregnancy. Glycobiology. 1998;8:1053–1064. doi: 10.1093/glycob/8.11.1053. [DOI] [PubMed] [Google Scholar]
- 21.Wuhrer M, Koeleman CA, Deelder AM. Hexose rearrangements upon fragmentation of N-glycopeptides and reductively aminated N-glycans. Anal Chem. 2009;81:4422–4432. doi: 10.1021/ac900278q. [DOI] [PubMed] [Google Scholar]
- 22.Satomi Y, Shimonishi Y, Hase T, Takao T. Site-specific carbohydrate profiling of human transferrin by nano-flow liquid chromatography/electrospray ionization mass spectrometry. Rapid Commun Mass Spectrom. 2004;18:2983–2988. doi: 10.1002/rcm.1718. [DOI] [PubMed] [Google Scholar]
- 23.Wuhrer M, Koeleman CA, Hokke CH, Deelder AM. Mass spectrometry of proton adducts of fucosylated N-glycans: fucose transfer between antennae gives rise to misleading fragments. Rapid Commun Mass Spectrom. 2006;20:1747–1754. doi: 10.1002/rcm.2509. [DOI] [PubMed] [Google Scholar]
- 24.Zaia J. Mass spectrometry of oligosaccharides. Mass Spectrom Rev. 2004;23:161–227. doi: 10.1002/mas.10073. [DOI] [PubMed] [Google Scholar]
- 25.del Castillo Busto ME, Montes-Bayon M, Blanco-Gonzalez E, Meija J, Sanz-Medel A. Strategies to study human serum transferrin isoforms using integrated liquid chromatography ICPMS, MALDI-TOF, and ESI-Q-TOF detection: application to chronic alcohol abuse. Anal Chem. 2005;77:5615–5621. doi: 10.1021/ac050574s. [DOI] [PubMed] [Google Scholar]
- 26.Sturiale L, Barone R, Fiumara A, Perez M, Zaffanello M, Sorge G, Pavone L, Tortorelli S, O’Brien JF, Jaeken J, Garozzo D. Hypoglycosylation with increased fucosylation and branching of serum transferrin N-glycans in untreated galactosemia. Glycobiology. 2005;15:1268–1276. doi: 10.1093/glycob/cwj021. [DOI] [PubMed] [Google Scholar]
- 27.Ashwell G, Harford J. Carbohydrate-specific receptors of the liver. Annu Rev Biochem. 1982;51:531–554. doi: 10.1146/annurev.bi.51.070182.002531. [DOI] [PubMed] [Google Scholar]
- 28.Grewal PK. The Ashwell-Morell receptor. Methods Enzymol. 2010;479:223–241. doi: 10.1016/S0076-6879(10)79013-3. [DOI] [PubMed] [Google Scholar]
- 29.Park EI, Mi Y, Unverzagt C, Gabius HJ, Baenziger JU. The asialoglycoprotein receptor clears glycoconjugates terminating with sialic acid alpha 2,6GalNAc. Proc Natl Acad Sci U S A. 2005;102:17125–17129. doi: 10.1073/pnas.0508537102. [DOI] [PMC free article] [PubMed] [Google Scholar]
- 30.van’t Veer C, van der Poll T. Keeping blood clots at bay in sepsis. Nat Med. 2008;14:606–608. doi: 10.1038/nm0608-606. [DOI] [PubMed] [Google Scholar]
- 31.Arndt T. Carbohydrate-deficient transferrin as a marker of chronic alcohol abuse: a critical review of preanalysis, analysis, and interpretation. Clin Chem. 2001;47:13–27. [PubMed] [Google Scholar]
- 32.Inamori K, Endo T, Ide Y, Fujii S, Gu J, Honke K, Taniguchi N. Molecular cloning and characterization of human GnT-IX, a novel beta1,6-N-acetylglucosaminyltransferase that is specifically expressed in the brain. J Biol Chem. 2003;278:43102–43109. doi: 10.1074/jbc.M308255200. [DOI] [PubMed] [Google Scholar]
- 33.Ailor E, Takahashi N, Tsukamoto Y, Masuda K, Rahman BA, Jarvis DL, Lee YC, Betenbaugh MJ. N-glycan patterns of human transferrin produced in Trichoplusia ni insect cells: effects of mammalian galactosyltransferase. Glycobiology. 2000;10:837–847. doi: 10.1093/glycob/10.8.837. [DOI] [PubMed] [Google Scholar]
- 34.Choi O, Tomiya N, Kim JH, Slavicek JM, Betenbaugh MJ, Lee YC. N-glycan structures of human transferrin produced by Lymantria dispar (gypsy moth) cells using the LdMNPV expression system. Glycobiology. 2003;13:539–548. doi: 10.1093/glycob/cwg071. [DOI] [PubMed] [Google Scholar]
- 35.Varki A, Cummings RD, Esko JD, Freeze HH, Stanley P, Bertozzi CR, editors. Essentials of Glycobiology. Cold Spring Harbor Press; Cold Spring Harbor: 2009. [PubMed] [Google Scholar]
- 36.de Leoz ML, Young LJ, An HJ, Kronewitter SR, Kim J, Miyamoto S, Borowsky AD, Chew HK, Lebrilla CB. High-mannose glycans are elevated during breast cancer progression. Mol Cell Proteomics. 2011;10:M110 002717. doi: 10.1074/mcp.M110.002717. [DOI] [PMC free article] [PubMed] [Google Scholar]
Associated Data
This section collects any data citations, data availability statements, or supplementary materials included in this article.
Supplementary Materials
Sequence coverage of identified transferrin peptides shown in red. Peptides not detected shown in black. Peptides not detected and suspected to be glycopeptides shown in blue.
Tandem mass spectrum of m/z 1347.09 (z = 2) in Spot 3. m/z values correspond to singly charged species.


