Abstract
We report our studies on the optical signals measured non-invasively on electrically stimulated peripheral nerves. The stimulation consists of the delivery of 0.1 ms current pulses, below the threshold for triggering any visible motion, to a peripheral nerve in human subjects (we have studied the sural nerve and the median nerve). In response to electrical stimulation, we observe an optical signal that peaks at about 100 ms post-stimulus, on a much longer time scale than the few milliseconds duration of the electrical response, or sensory nerve action potential (SNAP). While the 100 ms optical signal we measured is not a direct optical signature of neural activation, it is nevertheless indicative of a mediated response to neural activation. We argue that this may provide information useful for understanding the origin of the fast optical signal (also on a 100 ms time scale) that has been measured non-invasively in the brain in response to cerebral activation. Furthermore, the optical response to peripheral nerve activation may be developed into a diagnostic tool for peripheral neuropathies, as suggested by the delayed optical signals (average peak time: 230 ms) measured in patients with diabetic neuropathy with respect to normal subjects (average peak time: 160 ms).
Keywords: near-infrared spectroscopy, fast optical signal, peripheral nerve, nerve conduction
INTRODUCTION
The original motivation for this study was the possibility of studying the optical response to neural activation in the more optically accessible peripheral nervous system, as opposed to the cerebral cortex that is deeper and protected by several tissue layers of scalp, skull, dura mater, subarachnoid space, etc. Since the 1940’s, it has been known that neuronal stimulation results in a decreased opacity.1 More recently, it has been shown that light scattering by neurons in vitro determines optical signals that are proportional to transmembrane potentials2 and that the action potential in neurons is associated with cell swelling,3 one of the possible origins of neuronal optical signals. Invasive in vivo studies on animal models, for example, a study on the rat brain stem surface in response to nerve stimulation,4 have confirmed the existence of optical signals temporally correlated with electrical evoked responses on a time scale of 10–100 ms. After the pioneering work of Gabriele Gratton and Monica Fabiani who first reported fast optical signals (peak time ~100 ms) measured non-invasively on the human visual cortex in response to visual stimulation,5 several groups have reported similar fast optical brain signals measured non-invasively.6–8 While it is well established that there are indeed optical signatures directly associated with neuronal activation, it has been questioned whether the small amplitude of the fast optical signals measured non-invasively (a few parts per ten thousand) can ever make them of practical utility.9,10 Nevertheless, reports of non-invasive fast optical signals continue to appear in recent literature,11,12 keeping the question open on their potential value for research.
Because the question is not about the existence of fast optical signals associated with neuronal activation, but rather about the feasibility of reliably detecting them non-invasively, we have considered studying the peripheral nervous system, which is more optically accessible (many peripheral nerves being relatively large and located at shallow depths in tissues) than the brain. Peripheral nerve activation has been commonly used for detection of associated signals in the central nervous system, either on the brain6,13 or on the spinal cord.14,15 There has been one previous attempt to measure an optical signal on peripheral nerves on the same time scale (milliseconds) of the electrical signal associated with fast nerve stimulation, but no optical response was observed beyond noise level.16 In this work, we have investigated the optical response to peripheral nerve activation on a longer time scale (~10–100 ms) than the time scale of electrical activation (~ms). Because the time scales of the optical signal reported here and that of the electrical activation differ by more than one order of magnitude, we can exclude that this optical signal is a direct optical signature of neural activation. Instead, it is indicative of a mediated response to neural activation, and it likely involves hemodynamics or vascular components. Its temporal similarity with the non-invasive fast optical signal reported in the brain, which is also on a 10–100 ms time scale, suggests that there may be some functional/physiological aspects in common at the origin of the optical response to nerve stimulation and the fast optical signal in the brain. In fact, it has been suggested that the fast optical signal in the brain may also have vascular components at its origin.17 Besides its potential role in elucidating the origin of the fast optical response to brain activation, the peripheral optical response to nerve activation may also provide a valuable diagnostic tool for peripheral neuropathies. We report here a pilot study on patients with diabetic neuropathy, who show delayed optical responses to sural nerve activation. The physiologically different origin of the optical signal with respect to the electrical signal (sensory nerve action potential, or SNAP) that is currently used in the clinical practice may result in a complementary, or even more effective and sensitive, diagnosis of peripheral neuropathies.
EXPERIMENTAL METHODS
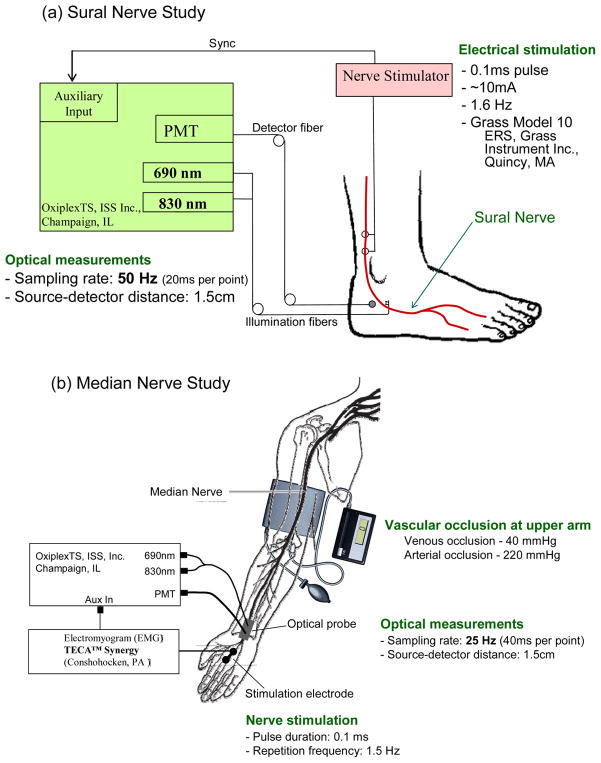
Electrical stimulation to the nerve consisted of a 0.1 ms current pulse (amplitude in the range 10–40 mA) provided in the sural nerve study by a Grass Model 10 ERS Evoked Response System (Grass Instrument Inc. Quincy, MA), and in the median nerve study by a TECA Synergy Electromyogram system (Conshohocken, PA). The electrical stimulation was repeated at a frequency of 1.6 Hz (median nerve study) or 1.5 Hz (median nerve study). The electrical stimulation electrodes were coupled to the skin with conducting gel over the proximal sural nerve, approximately 10 cm above the ankle, or over the median nerve on the palm of the hand. The optical spectrometer (OxiplexTS, ISS, Inc., Champaign, IL) used for optical measurements featured a photomultiplier tube (PMT) detector and two fiber-coupled laser diodes, one emitting at 690 nm and one at 830 nm. The distance on the skin between the collection optical fiber and the set of two illumination optical fibers (for 690 and 830 nm illumination) was set to 1.5 cm. The acquisition rate was set at 50 Hz (one data point every 20 ms) in the sural nerve study, and 25 Hz (one data point every 40 ms) in the median nerve study. In the median nerve study, we also performed measurements under upper arm vascular occlusion by placing an inflatable cuff around the subject’s arm. Venous or arterial occlusion was achieved by inflating the cuff to a pressure of 40 or 220 mmHg, respectively. The experimental setups for sural nerve and median nerve studies are illustrated in Fig. 1. All measurements were performed with nerve stimulation levels below the threshold for visible motion. Healthy subjects were examined in all studies, and we also performed pilot measurements on the sural nerve of four patients with diabetic neuropathy.
Fig. 1.
Experimental setup for the electrical stimulation and optical recording on (a) the sural nerve and (b) the median nerve. The light sources are laser diodes emitting at 690 and 830 nm, and the optical detector is a photomultiplier tube (PMT), all housed in a commercial tissue spectrometer (OxiplexTS, ISS, Inc., Champaign, IL).
RESULTS
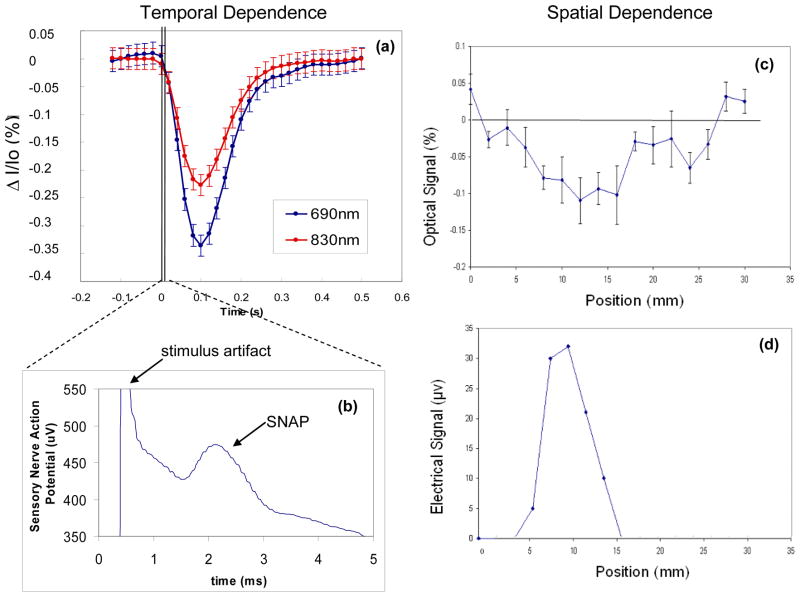
Figure 2(a) shows a typical optical response to nerve activation, specifically sural nerve activation in this case. Relative intensity changes at 690 and 830 nm are indicated as ΔI/I0, where ΔI = I − I0 with I intensity at time t and I0 average intensity during the 120 ms preceding the stimulation pulse. The optical response is a block average of responses from multiple pulses. The amplitude of this optical response, which peaks at ~100 ms post-stimulation, is a few tenths of a percent, or ten times larger than the fast optical signal measured on the brain non-invasively. The sensory nerve action potential (SNAP), i.e. the electrical response to nerve stimulation, is shown in Fig. 2(b) and occurs on a time scale of a few milliseconds, featuring a peak at ~2 ms post-stimulus. Figures 2(c) and 2(d) show the spatial dependence of the optical and electrical responses, respectively, to nerve stimulation. They have been measured by scanning the optical probe or the stimulation electrodes (for this experiment, we kept the recording electrodes at a fixed position on the nerve), with 2-mm steps, along a direction perpendicular to the direction of the sural nerve. Both optical and electrical responses are detected over a distance of ~1 cm across the nerve, and feature a peak that shows localization of the response to within approximately one centimeter.
Fig. 2.
Time dependence of (a) the optical response and (b) the electrical response (SNAP, or sensory nerve action potential) measured following the activation of the sural nerve with a 0.1 ms electrical current pulse. Note the different time scales of the optical response (~100 ms) and the electrical response (~ms). Spatial dependence of the amplitude of (c) the optical response and (d) the electrical response to nerve stimulation, as measured at different positions along a direction perpendicular to the nerve.
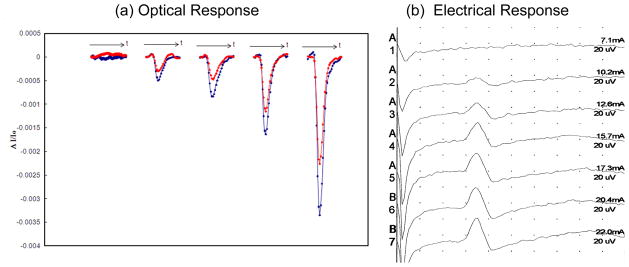
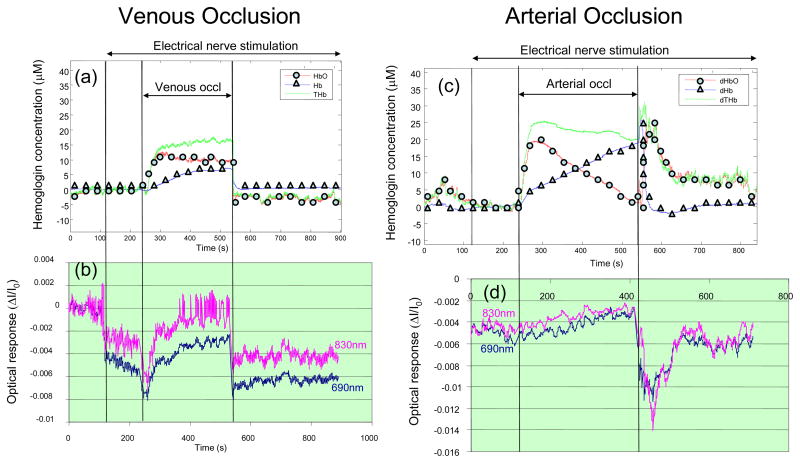
Figures 3(a) and 3(b) show the measured optical and electrical responses, respectively, resulting from increasing levels of stimulation current (always kept below the threshold for visible motion). One can see that both optical and electrical responses increase with the level of stimulation, characteristic of a dose-response relationship. The results of the venous and arterial occlusion experiments are shown in Fig. 4. The top panels, i.e. Figs. 4(c) and 4(d), report the oxy-hemoglobin, deoxy-hemoglobin, and total hemoglobin concentration changes obtained by applying Beer-Lambert law to the detected intensity I, and therefore represent average concentration changes in the tissue. They indicate the typical hemodynamic changes associated with venous occlusion (increase in total hemoglobin concentration) and arterial occlusion (deoxygenation by conversion of oxy-hemoglobin into deoxy-hemoglobin). The bottom panels report the time traces for the amplitude of the optical signals (at 690 and 830 nm) induced by nerve activation, where each data point represent the amplitude of the average optical responses to twenty successive optical stimuli. While the amplitude of the optical responses to nerve stimulation is affected by vascular occlusions, their spectral features (the relative amplitudes at the two wavelengths) are not significantly affected by the vascular occlusion and associated changes in background absorption.
Fig. 3.
(a) Optical and (b) electrical responses to increasing current levels of sural nerve stimulation. The two curves in panel (a) refer to the two wavelengths measured (690 and 830 nm), with the stronger, or more negative, response observed at 690 nm.
Fig. 4.
Effect of venous occlusion on (a) the average tissue concentrations of oxy-hemoglobin (HbO), deoxy-hemoglobin (Hb), and total hemoglobin (THb), and (b) the amplitude of the optical response to nerve stimulation at the two wavelengths of 690 and 830 nm. Effect of arterial occlusion on (c) the average tissue concentrations of oxy-hemoglobin (HbO), deoxy-hemoglobin (Hb), and total hemoglobin (THb), and (d) the amplitude of the optical response to nerve stimulation at the two wavelengths of 690 and 830 nm. The vascular occlusion is caused by a pressure applied by a pneumatic cuff to the upper arm (50 mmHg for venous occlusion, 220 mmHg for arterial occlusion) during the time indicated in the figure.
We have performed a pilot study on the sural nerve of a group of nineteen healthy human subjects and four patients with diabetic neuropathy. We have performed a total of 468 trials on healthy subjects and 108 trials on patients with diabetic neuropathy, where each trial refer to either a different location of the optical probe around the sural nerve, or an independent repetition of the measurement. This pilot study has resulted in a peak time of the optical response of 0.16 ± 0.08 s in healthy subjects, as opposed to 0.23 ± 0.09 s in patients with diabetic neuropathy (results are expressed as average ± standard deviation).
DISCUSSION
The representative signal reported in Fig. 2(a) has been reproducibly measured in response to electrical stimulation of peripheral nerves. Its amplitude of a few tenths of a percent is much greater than the typical amplitude of non-invasively measured fast signals in the brain. The optical response to nerve stimulation is wavelength dependent (Figs. 2(a), 3(a), 4(b), 4(d)), spatially localized (Fig. 2(c)), and features an amplitude that correlates with the level of stimulation (Fig. 3(a)). Its wavelength dependence does not appear to be significantly affected by venous occlusion (which significantly increases the background concentration of hemoglobin), or arterial occlusion (which significantly decreases the background hemoglobin saturation), as shown in Fig. 4. This latter result can be explained by a vascular origin of the optical response to nerve stimulation, where blood vessels undergo either dilation/contraction or displacement, as possibly induced by tendon motion or nerve-activation-induced compression waves.4 In fact, the much larger (more than one order of magnitude) near-infrared absorption coefficient of blood with respect to background tissue, accounts for spectral features of vascular-induced ΔI/I0 that are dominated by the spectral properties of the blood vessel rather than those of the background. In this perspective, the decreased amplitude of the optical response to stimulation observed in Figs. 4(b) and 4(d) during venous or arterial occlusion, may be explained by geometrical effects (spatial rearrangement of vasculature, change in tissue volume, etc.) associated with pressure changes induced by vascular occlusion.
While the biological/physiological origin of the optical response to nerve stimulation reported here still remains to be elucidated, our preliminary results on patients with diabetic neuropathy show that these signals may have a diagnostic role complementary to that of nerve conduction studies. The different time scales of optical responses (~100 ms) and electrical responses (~ms) to nerve stimulation indicate that they reflect different mechanisms associated with nerve activation. As a result, electro-optical evaluation of peripheral nerves may provide information on nerve viability that is complementary to that provided by nerve conduction studies.
CONCLUSIONS
We have reported optical signals on a time scale of 100 ms measured on human peripheral nerves (sural nerve and median nerve) in response to fast (0.1 ms) electrical nerve stimulation.18 We argue that these optical signals may have some biological mechanisms at their origin that are in common with those responsible for the previously reported fast optical signals measured non-invasively in the brain, which are also on a 100 ms time scale.6–8 In addition, we have reported a pilot study on patients with diabetic neuropathy, which suggests that the temporal features of the optical response to nerve activation may be affected by peripheral neuropathy. As a result, electro-optical sensing of peripheral nerves may be further considered as a tool for diagnosis of peripheral neuropathies and assessment of nerve viability.
Acknowledgments
This work is supported by NIH Grant R01-NS059933 and by CIMIT/U.S. Army Medical Acquisition Activity (USAMRAA) funding under cooperative agreement no. W81XWH-07-2-0011.
References
- 1.Hill DK, Keynes RD. Opacity changes in stimulated nerve. J Physiol. 1949;108:278–281. [PubMed] [Google Scholar]
- 2.Stepnoski RA, LaPorta A, Raccuia-Behling F, Blonder GE, Slusher RE, Kleinfeld D. Noninvasive detection of changes in membrane potential in cultured neurons by light scattering. Proc Natl Acad Sci U S A. 1991;88:9382–9386. doi: 10.1073/pnas.88.21.9382. [DOI] [PMC free article] [PubMed] [Google Scholar]
- 3.Taskai I. Evidence for phase transition in nerve fibers, cells and synapses. Ferroelectrics. 1999;220:305–316. [Google Scholar]
- 4.Rector DM, Rogers RF, Schwaber JS, Harper RM, George JS. Scattered-light imaging in vivo tracks fast and slow processes of neurophysiological activation. Neuroimage. 2001;14:977–994. doi: 10.1006/nimg.2001.0897. [DOI] [PubMed] [Google Scholar]
- 5.Gratton G, Corballis PM, Cho E, Fabiani M, Hood DC. Shades of gray matter: noninvasive optical images of human brain responses during visual stimulation. Psychophysiology. 1995;32:505–509. doi: 10.1111/j.1469-8986.1995.tb02102.x. [DOI] [PubMed] [Google Scholar]
- 6.Steinbrink J, Kohl M, Obrig H, Curio G, Syre F, Thomas F, Wabnitz H, Rinneberg H, Villringer A. Somatosensory evoked fast optical intensity changes detected non-invasively in the adult human head. Neurosci Lett. 2000;291:105–108. doi: 10.1016/s0304-3940(00)01395-1. [DOI] [PubMed] [Google Scholar]
- 7.Franceschini MA, Boas DA. Noninvasive measurement of neuronal activity with near-infrared optical imaging. Neuroimage. 2004;21:372–386. doi: 10.1016/j.neuroimage.2003.09.040. [DOI] [PMC free article] [PubMed] [Google Scholar]
- 8.Wolf M, Wolf U, Choi JH, Toronov V, Paunescu LA, Michalos A, Gratton E. Fast cerebral functional signal in the 100-ms range detected in the visual cortex by frequency-domain near-infrared spectrophotometry. Psychophysiology. 2003;40:521–528. doi: 10.1111/1469-8986.00054. [DOI] [PubMed] [Google Scholar]
- 9.Steinbrink J, Kempf FC, Villringer A, Obrig H. The fast optical signal--robust or elusive when non-invasively measured in the human adult? Neuroimage. 2005;26:996–1008. doi: 10.1016/j.neuroimage.2005.03.006. [DOI] [PubMed] [Google Scholar]
- 10.Radhakrishnan H, Vanduffel W, Deng HP, Ekstrom L, Boas DA, Franceschini MA. Fast optical signal not detected in awake behaving monkeys. Neuroimage. 2008 doi: 10.1016/j.neuroimage.2008.12.014. [DOI] [PMC free article] [PubMed] [Google Scholar]
- 11.Kubota M, Inouchi M, Dan I, Tsuzuki D, Ishikawa A, Scovel T. Fast (100–175 ms) components elicited bilaterally by language production as measured by three-wavelength optical imaging. Brain Res. 2008;1226:124–133. doi: 10.1016/j.brainres.2008.05.079. [DOI] [PubMed] [Google Scholar]
- 12.Medvedev AV, Kainerstorfer J, Borisov SV, Barbour RL, VanMeter J. Event-related fast optical signal in a rapid object recognition task: improving detection by the independent component analysis. Brain Res. 2008;1236:145–158. doi: 10.1016/j.brainres.2008.07.122. [DOI] [PMC free article] [PubMed] [Google Scholar]
- 13.Maclin EL, Low KA, Sable JJ, Fabiani M, Gratton G. The event-related optical signal to electrical stimulation of the median nerve. Neuroimage. 2004;21:1798–1804. doi: 10.1016/j.neuroimage.2003.11.019. [DOI] [PubMed] [Google Scholar]
- 14.Sasaki S, Sato K, Shinomiya K, Momose-Sato Y. Postnatal changes in intrinsic optical responses to peripheral nerve stimulation in the in vivo rat spinal cord. Neuroimage. 2003;20:2126–2134. doi: 10.1016/j.neuroimage.2003.08.005. [DOI] [PubMed] [Google Scholar]
- 15.Liu H, Radhakrishnan H, Senapati AK, Hagains CE, Peswani D, Mathker A, Peng YB. Near infrared and visible spectroscopic measurements to detect changes in light scattering and hemoglobin oxygen saturation from rat spinal cord during peripheral stimulation. Neuroimage. 2008;40:217–227. doi: 10.1016/j.neuroimage.2007.10.057. [DOI] [PubMed] [Google Scholar]
- 16.Lebid S, Ward T, O’Neill R, Markham C, Coyle S. Towards dual modality nerve assessment using electrical and optical techniques. Proc SPIE. 2005;5855:399–402. [Google Scholar]
- 17.Sandman CA, O’Halloran JP, Isenhart R. Is there an evoked vascular response? Science. 1984;224:1355–1357. doi: 10.1126/science.6729458. [DOI] [PubMed] [Google Scholar]
- 18.Tong Y, Martin JM, Sassaroli A, Clervil PR, Bergethon PR, Fantini S. Fast optical signals in the peripheral nervous system. J Biomed Opt. 2006;11:044014. doi: 10.1117/1.2234319. [DOI] [PubMed] [Google Scholar]


