Non-invasive studies of physiological and pathogenic processes in deep tissues require both new imaging techniques and advanced probes. One of the emerging approaches is photoacoustic (PA) tomography, which is a hybrid technique built on the PA effect[1]. PA imaging relies on the thermoelastic expansion of light absorbing objects, which subsequently produces ultrasonic waves that are then detected and quantified. PA techniques are highly scalable and can provide high-resolution images in both the transverse and depth directions[2],[3]. This combination of the spatial resolution and depth are not achievable by purely optical methods, mostly because of the high degree of light scattering in the tissue[4]. PA imaging has already proved useful for studying vasculature development, blood oxygenation levels and other processes. Most exploited absorbers are of endogenous origin, such as hemoglobin and melanin, while other contrast agents that are commonly used, such as organic dyes and nanoparticles, need to be delivered into the body from the outside[5].
Genetically-encoded fluorescent proteins (FPs) have revolutionized optical imaging through their exceptional convenience, since they can be produced by living cells and tissues, eliminating the need for exogenous delivery of contrast reagents[6]. Since FPs are typically strong light absorbers, they should also bring the same convenience and possibilities to the PA approaches. Indeed, the use of conventional FPs of the GFP-like family, such as EGFP, DsRed, and mCherry, has been already demonstrated in a MSOT (Multispectral Optoacoustic Tomography)by photoacoustic imaging of small transparent organisms, such as fruit fly pupa and adult zebrafish[7]. However, the application of conventional GFP-like FPs for PA imaging of mammals is hindered by high hemoglobin absorption below 650 nm in blood and tissues.
A recently developed bacteriophytochrome-based FP, named iRFP[8], can serve as a probe for the PA imaging for several reasons. First, it has a very high intrinsic extinction coefficient of 105,000 M-1cm-1. Second, iRFP's fluorescence quantum yield (QY) is ~6%, which ensures a high nonradiative QY that is beneficial for PA imaging. (These properties are summarized in Supplementary Table 1.) Third, its absorption and emission spectra lie inside of the near-infrared window for biological tissues, which spans from 650 to 900 nm. Finally, fluorescence emission of iRFP provides additional options for signal analysis and quantification.
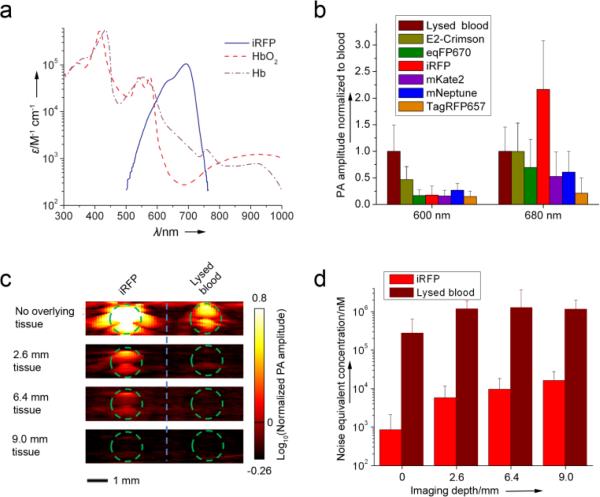
To date, several far-red shifted GFP-like FPs have been reported, therefore we decided to start by comparing the PA signals from iRFP and the GFP-like proteins. Initial assessment of the theoretical PA properties of iRFP and the most red-shifted GFP-like proteins, such as E2-Crimson[9], mNeptune[10], mKate2[11], eqFP670[12], and TagRFP657[13], clearly indicated the iRFP's superiority (Supplementary Table 1). Note that this theoretical assessment did not take into account the substantially more red-shifted absorption spectrum of iRFP, which coincides with the absorption minimum of oxyhemoglobin (shown on Figure 1a).
Figure 1.
(a) Overlay of the molar extinction spectra of oxygenated hemoglobin (HbO2), deoxygenated hemoglobin (Hb), and iRFP. (b) Comparison of PA signal amplitudes of purified iRFP and purified E2-Crimson, eqFP670, mKate2, mNeptune, and TagRFP657 in model gelatin set up at 600 nm and 680 nm. PA signal amplitudes were normalized to the blood signal amplitude at the corresponding wavelength. (c) Deep-PAM cross sections of the tubes containing purified iRFP or oxygenated blood with the tissue overlay and (d) noise equivalent sensitivity of the deep-PAM technique in nM of the protein (or blood) versus depth. Green dashed line in (c) indicates the tube boundary.
In order to demonstrate that iRFP provides higher stronger photoacoustic contrast signals thanrelative to blood, the following in vitro experiment was performed. The purified iRFP, E2-Crimson, mNeptune, mKate2, eqFP670, and TagRFP657 proteins, together with lysed oxygenated blood (control), were imaged in a PA computed tomography (PACT) setup[14]. The samples were embedded into in a gelatin block and imaged using two laser wavelengths (600 nm and 680 nm) which approximately corresponded to the proteins’ absorption maxima. The resulting amplitude of the PACT signal was normalized to the blood signal amplitude (Figure 1b). This method clearly shows the contrast of the proteins’ PACT signals over the intrinsic signal of blood. The contrasts for FPs at 680 nm were higher than those at 600 nm, with iRFP's 2.2-fold increase being the highest. These results justified the choice of bacteriophytochrome iRFP over the far-red GFP-like proteins for PA imaging.
To assess the maximal imaging depth of the iRFP probe, a deep-Photoacoustic Microscopy (deep-PAM) setup capable of depth-resolved cross sections was employed[3]. Both iRFP and lysed oxygenated blood in tubes were imaged with tissue overlays imitating different depths (Figure 1c). Calculations of a noise equivalent concentration (Figure 1d) demonstrated that in the setup used, the iRFP sample with a concentration of ~16 μM can be detected up to 9 mm deep in the tissue.
These in vitro results suggested that using 680 nm excitation light, iRFP should also provide substantially stronger PA signal than blood in vivo, owing to its high extinction coefficient and more red-shifted spectra. However, an additional concern was yet to be resolved. The iRFP protein, unlike the GFP-like proteins, requires binding of a biliverdin (BV) co-factor to become fluorescent. BV is the enzymatic product of a heme, and is endogenously produced in many mammalian tissues[15]. To date, the iRFP fluorescence has only been demonstrated in vivo in the tissues enriched with BV, such as the liver and spleen[8]. Since concentration of endogenous BV varies in different organs, additional in vivo data were required in order to support applicability of the iRFP probe to other tissues. Conventional fluorescence imaging was chosen to test that.
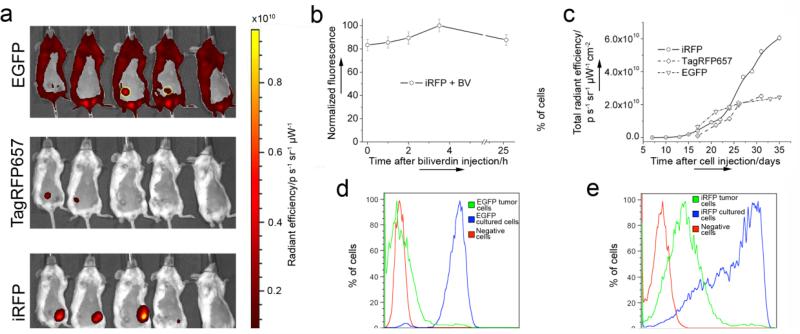
A preclonal mixture of the rat adenocarcinoma MTLn3 cells stably expressing iRFP was injected into the mammary gland of immunocompromised mice, along with control MTLn3 cells expressing EGFP or far-red TagRFP657. The fluorescent signal at the MTLn3 injection site was first detected in the iRFP channel after just one week (Supplementary Fig. 1). After 3 weeks, iRFP expressed in the tumor provided bright and clear signal with substantially better contrast than the EGFP or TagRFP657 control. tumors (Figure 2a). An additional BV injection into the mouse vein only slightly increased the already high iRFP fluorescence intensity (Figure 2b). Injection of the BV directly into the tumor resulted in localized signal enhancment (Supplementary Fig. 2) which may be helpful in some cases, but not suitable when there is a need to compare whole tumor brightness changes over time. Nevertheless, these results demonstrate that injections of exogenous BV is not required to visualize iRFP in tissues other than the liver and spleen.
Figure 2.
iRFP expression in mouse Xenograft model. (a) Bright fluorescence of the iRFP-expressing tumor three weeks after cell injection, in comparison with TagRFP657 and low contrast EGFP-expressing tumors (circled with yellow). The mouse on the right is the control. The color bar represents radiant efficiency. (b) iRFP-expressing tumor brightness change after intravenous BV injection. (c) Tumor growth curves plotted based on fluorescence brightness increase of iRFP, TagRFP657 or EGFP. (d) and (e) FACS analysis of the cells isolated from the EGFP or iRFP -expressing tumors five weeks after injection, in comparison with negative MTLn3 cells and respective preclonal mixture (iRFP) or stable line (EGFP) growing in culture.
Monitoring the fluorescence signal allowed us to plot the growth curves for the iRFP-, TagRFP657- and EGFP-expressing tumors (Figure 2c). EGFP, being the brightest of the protiens used in this experiment on molecular level, showed only modest in vivo brightness which is substantially lower than iRFP and similar to TagRFP657. Moreover, EGFP tumor growth seems to be much slower than in the case of far-red and near-infrared proteins (given that the studied tumors were of a similar size) suggesting that blue light, exciting EGFP, does not penetrate as deep into the tumor as it grows, and thus not all EGFP molecules are excited. Again, this demostrates the superiority of the far-red and moreover near-infrared FPs for in vivo imaging. Also, simultanious expression of iRFP and TagRFP657 protiens in one mouse succesfully demonstrated the possibility of the dual color far-red/near infra-red in vivo fluorescent imaging using FPs.
Postmortem fluorescence-activated cell sorting (FACS) analysis of a distribution of the fluorescent cells in the excised tumors additionally confirmed the previously demonstrated noncytotoxicity of iRFP[8]. Indeed, both the EGFP and iRFP tumor cells showed similar ratios between negative and fluorescent cells (~3.5% positive cells) (Figure 2d and e). Since EGFP is considered one of the most non-cytotoxic standards[16], these results confirmed that iRFP does not exhibit cytotoxicity[8].
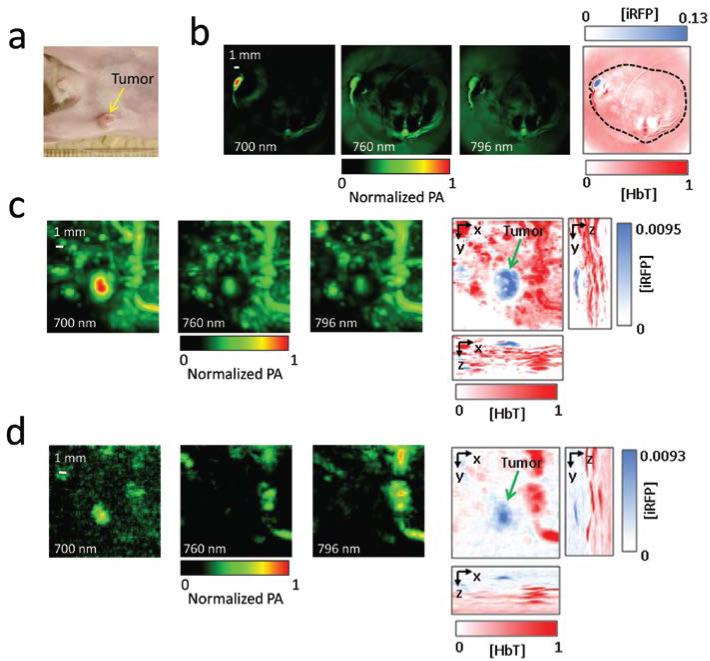
All these data motivated an in vivo photoacoustic experiment. We exploited the same mouse tumor xenograft model with iRFP-expressing MTLn3 cells, and imaged mice two and three weeks after injecting the cancer cells. While even a two week old tumor could be visualized using the PACT and deep-PAM techniques (Supplementary Fig. 3 and 4), the three week old tumor showed a high contrast and imaging depth (Figure 3). During the PACT experiment, images at wavelengths of 700 nm, 760 nm, and 796 nm were obtained to spectrally resolve iRFP and blood. The position and size of the PACT visualized tumor on the axial mouse cross-section matched those in the photograph (Figure 3a and 3b). The PACT detection of the iRFP-expressing tumor achieved 100 μm tangential resolution in subcutaneous imaging.
Figure 3.
In vivo PACT and deep-PAM imaging of mouse mammary gland tumor (a) Photograph of the mouse with the three-week tumor xenograft growing in the mammary pad (yellow arrow). (b) PACT image of the tumor shown in the mouse cross-section. The three images on the left were taken at different wavelengths (indicated); the right-most image is a spectrally separated one, with the tumor in blue and the blood in red. The spectrally resolved iRFP signal is normalized to the spectrally resolved blood signal. The black dashed line shows the mouse body borders. (c) and (d) Deep-PAM maximum amplitude projection images of the tumor and surrounding major blood vessels taken (c) without and (d) with 4-mm thick tissue overlay. The three left images on each panel were taken at different wavelengths (indicated), the three right images on each panel are maximum amplitude projection images with orthogonal orientations; the left and bottom images were used to create the spectrally separated images (in the center). Again, the tumor is labeled blue, the blood is labeled red, and the spectrally resolved iRFP signal is normalized to the spectrally resolved blood signal. The tumor position is indicated by the green arrow.
Deep-PAM[3] studies provided both spectral resolution and maximum amplitude projections in three orthogonal planes. Their combination allowed the production of volumetric, spectrally resolved images, with depths up to 4 mm as mimicked by the tissue overlay (Figures 3c and d). In the deep-PAM mode, 280 μm lateral and 75 μm axial resolutions at a depth of 4 mm were achieved, which so far is the best combination of the depth versus resolution among all currently available genetically-encoded probes. Comparing the PA signals of blood and iRFP also provided an estimate of the concentration for the probe of ~21 μM.
FPs have brought considerable convenience in monitoring intracellular processes to optical microscopy. However, until recently FPs were only available from the GFP-like family. Excitation and emission of these FPs were limited to the blue, green, and red spectral regions, which made their use in whole-body imaging a challenge[17]. Optical visualization of these FPs inside a mammalian body was feasible only for very large objects, such as terminal cancer tumors[18], or by employing spectrum-resolving algorithms, such as volumetric tomography[19] or FMT[20].
Compared to pure optical modalities, PA imaging has substantial advantages, and when combined with proper genetically-encoded probes should have greater applicability for whole-body studies in mammals. Owing to its substantially more red-shifted absorption spectra and high extinction coefficient, the bacteriophytochrome-derived iRFP protein provides significantly higher PA contrast than conventional GFP-like proteins. On the other hand, similarly to the GFP-like proteins, iRFP can be delivered into the body by means of standard genetic manipulations. Moreover, compared to other genetically-encoded PA probes, such as beta-galactosidase, iRFP does not require injection of the exogenous substrates[21]. Lastly, the fluorescent properties of iRFP probe allows using both photoacoustic and fluorescent imaging modalities such as FMT; since this optical approach does not provide microscopic resolution but may have better penetration and thus imaging depth, then it could be a good complementto PA methods. Overall, as demonstrated in this study, the combinations of the iRFP probe with PACT or with deep-PAM techniques can facilitate deep-tissue imaging of the internal tissues and organs by providing high resolution at depths not previously achievable by other genetically-encoded probes.
Supplementary Material
Footnotes
We thank Bojana Gligorijevic for help with the mice, and Jeffrey Segall for providing the EGFP-expressing MTLn3 cells. We are grateful to Benjamin Glick (University of Chicago), Dmitry Chudakov and Konstantin Lukyanov (both from the Institute of Bioorganic Chemistry, Russia) for the plasmids encoding GFP-like proteins. We thank Yu Zhang and Yunan Xia for help with maintaining cell cultures. We thank James Ballard for help with editing the manuscript. This work was supported by the National Institutes of Health grants GM073913 and CA164468 (to V.V.V) and in part by EB000712, EB008085, CA134539 and CA136398 (to L.V.W.)
Supporting information for this article is available on the WWW under http://www.angewandte.org or from the author.
Contributor Information
Grigory S. Filonov, Department of Anatomy and Structural Biology, and Gruss-Lipper Biophotonics Center Albert Einstein College of Medicine 1300 Morris Park Avenue, Bronx, NY 10461.
Arie Krumholz, Department of Biomedical Engineering, Optical Imaging Laboratory, Washington University in St. Louis, One Brookings Drive, St. Louis, MO 63130.
Jun Xia, Department of Biomedical Engineering, Optical Imaging Laboratory, Washington University in St. Louis, One Brookings Drive, St. Louis, MO 63130.
Junjie Yao, Department of Biomedical Engineering, Optical Imaging Laboratory, Washington University in St. Louis, One Brookings Drive, St. Louis, MO 63130.
Lihong V. Wang, Department of Biomedical Engineering, Optical Imaging Laboratory, Washington University in St. Louis, One Brookings Drive, St. Louis, MO 63130 lhwang@seas.wustl.edu
Vladislav V. Verkhusha, Department of Anatomy and Structural Biology, and Gruss-Lipper Biophotonics Center Albert Einstein College of Medicine 1300 Morris Park Avenue, Bronx, NY 10461 vladislav.verkhusha@einstein.yu.edu
References
- 1.a Wang LV. Med Phys. 2008;35:5758–5767. doi: 10.1118/1.3013698. [DOI] [PMC free article] [PubMed] [Google Scholar]; b Wang LV. Nat Photonics. 2009;3:503–509. doi: 10.1038/nphoton.2009.157. [DOI] [PMC free article] [PubMed] [Google Scholar]
- 2.Maslov K, Zhang HF, Hu S, Wang LV. Opt Lett. 2008;33:929–931. doi: 10.1364/ol.33.000929. [DOI] [PubMed] [Google Scholar]
- 3.Song KH, Wang LV. J Biomed Opt. 2007;12:060503. doi: 10.1117/1.2818045. [DOI] [PubMed] [Google Scholar]
- 4.Ntziachristos V. Nat Methods. 2010;7:603–614. doi: 10.1038/nmeth.1483. [DOI] [PubMed] [Google Scholar]
- 5.Kim C, Favazza C, Wang LV. Chem Rev. 2010;110:2756–2782. doi: 10.1021/cr900266s. [DOI] [PMC free article] [PubMed] [Google Scholar]
- 6.a Hoffman RM. J Biomed Opt. 2005;10:41202. doi: 10.1117/1.1992485. [DOI] [PubMed] [Google Scholar]; b Chudakov DM, Matz MV, Lukyanov S, Lukyanov KA. Physiol Rev. 2010;90:1103–1163. doi: 10.1152/physrev.00038.2009. [DOI] [PubMed] [Google Scholar]; c Weissleder R, Ntziachristos V. Nat Med. 2003;9:123–128. doi: 10.1038/nm0103-123. [DOI] [PubMed] [Google Scholar]
- 7.Razansky D, Distel M, Vinegoni C, Ma R, Perrimon N, Köster RW, Ntziachristos V. Nature Photonics. 2009;3:412–417. [Google Scholar]
- 8.Filonov GS, Piatkevich KD, Ting LM, Zhang J, Kim K, Verkhusha VV. Nat Biotechnol. 2011;29:757–761. doi: 10.1038/nbt.1918. [DOI] [PMC free article] [PubMed] [Google Scholar]
- 9.Strack RL, Hein B, Bhattacharyya D, Hell SW, Keenan RJ, Glick BS. Biochemistry. 2009;48:8279–8281. doi: 10.1021/bi900870u. [DOI] [PMC free article] [PubMed] [Google Scholar]
- 10.Lin MZ, et al. Chem Biol. 2009;16:1169–1179. doi: 10.1016/j.chembiol.2009.10.009. [DOI] [PMC free article] [PubMed] [Google Scholar]
- 11.Shcherbo D, et al. Biochem J. 2009;418:567–574. doi: 10.1042/BJ20081949. [DOI] [PMC free article] [PubMed] [Google Scholar]
- 12.Shcherbo D, et al. Nat Methods. 2010;7:827–829. doi: 10.1038/nmeth.1501. [DOI] [PMC free article] [PubMed] [Google Scholar]
- 13.Morozova KS, Piatkevich KD, Gould TJ, Zhang J, Bewersdorf J, Verkhusha VV. Biophys J. 2010;99:L13–15. doi: 10.1016/j.bpj.2010.04.025. [DOI] [PMC free article] [PubMed] [Google Scholar]
- 14.Gamelin J, Maurudis A, Aguirre A, Huang F, Guo P, Wang LV, Zhu Q. Opt Express. 2009;17:10489–10498. doi: 10.1364/oe.17.010489. [DOI] [PMC free article] [PubMed] [Google Scholar]
- 15.Mantle TJ. Biochem Soc Trans. 2002;30:630–633. doi: 10.1042/bst0300630. [DOI] [PubMed] [Google Scholar]
- 16.Brazelton TR, Blau HM. Stem Cells. 2005;23:1251–1265. doi: 10.1634/stemcells.2005-0149. [DOI] [PubMed] [Google Scholar]
- 17.Rice BW, Contag CH. Nat Biotechnol. 2009;27:624–625. doi: 10.1038/nbt0709-624. [DOI] [PubMed] [Google Scholar]
- 18.Yang M, Luiken G, Baranov E, Hoffman RM. Biotechniques. 2005;39:170, 172. doi: 10.2144/05392BM02. [DOI] [PubMed] [Google Scholar]
- 19.Zacharakis G, Kambara H, Shih H, Ripoll J, Grimm J, Saeki Y, Weissleder R, Ntziachristos V. Proc Natl Acad Sci U S A. 2005;102:18252–18257. doi: 10.1073/pnas.0504628102. [DOI] [PMC free article] [PubMed] [Google Scholar]
- 20.Deliolanis NC, Wurdinger T, Pike L, Tannous BA, Breakefield XO, Weissleder R, Ntziachristos V. Biomed Opt Express. 2011;2:887–900. doi: 10.1364/BOE.2.000887. [DOI] [PMC free article] [PubMed] [Google Scholar]
- 21.Li L, Zemp RJ, Lungu G, Stoica G, Wang LV. J Biomed Opt. 2007;12:020504. doi: 10.1117/1.2717531. [DOI] [PubMed] [Google Scholar]
Associated Data
This section collects any data citations, data availability statements, or supplementary materials included in this article.


