

Background: Cohesion of interendothelial junctions is maintained by the connections existing between the VE-cadherin·catenin complex and the actin cytoskeleton.
Results: By interacting with α-catenin, the actin-binding protein EPLIN (epithelial protein lost in neoplasm) facilitates the recruitment of vinculin.
Conclusion: The EPLINα-catenin link provides a mechanosensory machinery by acting as a tension transmitter.
Significance: By anchoring the VE-cadherin·catenin complex to F-actin, EPLIN strengthens interendothelial junctions.
Keywords: Actin, Adherens Junction, Angiogenesis, Cadherins, Cell Junctions, Cell-Cell Interaction, Cytoskeleton
Abstract
Adherens junctions are required for vascular endothelium integrity. These structures are formed by the clustering of the homophilic adhesive protein VE-cadherin, which recruits intracellular partners, such as β- and α-catenins, vinculin, and actin filaments. The dogma according to which α-catenin bridges cadherin·β-catenin complexes to the actin cytoskeleton has been challenged during the past few years, and the link between the VE-cadherin·catenin complex and the actin cytoskeleton remains unclear. Recently, epithelial protein lost in neoplasm (EPLIN) has been proposed as a possible bond between the E-cadherin·catenin complex and actin in epithelial cells. Herein, we show that EPLIN is expressed at similar levels in endothelial and epithelial cells and is located at interendothelial junctions in confluent cells. Co-immunoprecipitation and GST pulldown experiments provided evidence that EPLIN interacts directly with α-catenin and tethers the VE-cadherin·catenin complex to the actin cytoskeleton. In the absence of EPLIN, vinculin was delocalized from the junctions. Furthermore, suppression of actomyosin tension using blebbistatin triggered a similar vinculin delocalization from the junctions. In a Matrigel assay, EPLIN-depleted endothelial cells exhibited a reduced capacity to form pseudocapillary networks because of numerous breakage events. In conclusion, we propose a model in which EPLIN establishes a link between the cadherin·catenin complex and actin that is independent of actomyosin tension. This link acts as a mechanotransmitter, allowing vinculin binding to α-catenin and formation of a secondary molecular bond between the adherens complex and the cytoskeleton through vinculin. In addition, we provide evidence that the EPLIN clutch is necessary for stabilization of capillary structures in an angiogenesis model.
Introduction
The endothelium forms a semipermeable barrier that regulates the passage of macromolecules and circulating cells between blood and tissues. Historically viewed as a passive vascular lining, vascular endothelium is instead a dynamic tissue submitted to a continuous remodeling required for physiological and pathological processes, such as wound healing and angiogenesis (1, 2). The barrier function of the endothelium is in large part regulated by adherens junctions. These adherens junctions comprise the transmembrane adhesive receptor VE-cadherin (VE-cad)3 that is the main protein involved in homophilic/homotypic cell-to-cell adhesion (3, 4).
VE-cad recruits intracellular partners that establish specific links with the actin cytoskeleton and consequently stabilize the interendothelial junctions (5). Like its epithelial homolog E-cadherin, VE-cad directly interacts with intracellular β- and γ-catenins, which in turn bind α-catenin. Until recently, it was widely accepted that α-catenin strengthens cadherin-mediated adhesion by promoting anchorage to the actin cytoskeleton. A few years ago, this concept was challenged by studies demonstrating that α-catenin is unable to bind simultaneously β-catenin and actin (6, 7). However, it is still accepted that the lack of catenin association to F-actin destabilizes cadherin-mediated cell adhesion.
The question of the links between the cadherin complex and actin cytoskeleton is more complex than previously envisioned because α-catenin is a multimodular molecule that undergoes, under the action of mechanical strengths, conformational changes unmasking cryptic ligand binding sites. Thus, although the N-terminal domain of α-catenin remains accessible for interacting with β/γ-catenins, its central domain recruits vinculin and probably α-actinin (8) through force-dependent changes of its conformation (9). These data support the notion that α-catenin is a tension transducer (9) and led to the concept that intermediate proteins bridge α-catenin to actin cytoskeleton (10).
Interestingly, a recent study identified a novel protein that is able to bind both α-catenin and actin filaments. This protein called epithelial protein lost in neoplasm (EPLIN), also known as Lima-1, was first identified as the product of a gene differentially expressed in normal and cancer cells (11). Two isoforms of EPLIN, designated as EPLINα and EPLINβ, are generated from this gene by two distinct promoters (12). The sequences of these two isoforms differ by the addition of a 160-amino acid extension at the N terminus of the α isoform.
EPLIN belongs to the family of LIM domain proteins as it contains a centrally located LIM domain known to form two closely packed zinc-binding subdomains (13). Additionally, EPLIN exhibits two functional acting binding sites, one on each side of the centrally located LIM domain, that give it the ability to cross-link and bundle actin filaments (14). In vitro, EPLIN stabilizes actin filaments by preventing their depolymerization and blocks the formation of branched filaments by inhibiting actin nucleation by Arp2/3 (14). Based on these properties, EPLIN is implicated in different actin-related processes, such as cell motility and migration, cytokinesis, and intercellular junctions (15–18). Subsequent in vivo studies confirmed the down-regulation of EPLINα in a number of human epithelial cancer cells and tissues, suggesting that the loss of EPLINα could contribute to the transformed phenotype. This indicates that EPLIN may act as a tumor suppressor (15).
In the endothelium, the presence of EPLIN is questionable because EPLINα transcript was previously shown to be undetectable in human umbilical vascular endothelial cells (HUVECs) by RT-PCR (15), whereas EPLINα protein was faintly detected in primary aortic endothelial cells (12). In the present study, we provide evidence that EPLIN is expressed at the mRNA and protein levels in HUVECs. In confluent endothelial cell monolayers, EPLIN appeared distributed along the actin cortical ring where it co-localized with α-catenin. Because EPLIN was found in epithelial cells to bridge the E-cadherin·catenin complex to F-actin via α-catenin, we tested whether EPLIN has the same interactants in endothelial cells as in epithelial cells. By immunoprecipitation and GST pulldown experiments, we showed that EPLIN directly interacted with α-catenin anchored to the VE-cad·β-catenin complex, thus providing a possible link with the actin cytoskeleton. We also explored the impact of EPLIN depletion on endothelial cell behavior. We observed that EPLIN down-regulation by siRNA did not modify HUVEC proliferation, adhesion, and migration. Nevertheless, our immunofluorescence analyses showed that the cortical actin ring is dramatically disturbed in EPLIN-silenced HUVECs. Similarly, we noted that EPLIN is necessary for the recruitment of vinculin at endothelial cell-cell junctions. Vinculin and EPLIN are both direct α-catenin partners. We showed that vinculin accumulation at cell-cell junctions requires myosin II activity, whereas EPLIN is recruited independently of myosin II contractility. From these observations, we proposed that EPLIN operates as a tension transmitter at endothelial cell-cell junctions. In addition, the behavior of HUVECs is strongly affected by the abrogation of EPLIN expression in in vitro angiogenesis. On a Matrigel matrix, EPLIN depletion promoted the rapid regression of the vascular capillary network that exhibited excessive fragility. Our data support the notion that EPLIN, by connecting the VE-cad·catenin complex to the actin cortical ring and by promoting vinculin junctional recruitment, reinforces the cohesion of cell-cell junctions that become more resistant to the strengths generated by the vascular network.
EXPERIMENTAL PROCEDURES
Reagents and Antibodies
Blebbistatin (Calbiochem) was prepared as a 50 mm stock in dimethyl sulfoxide (DMSO) and used at 5–50 μm. The monoclonal anti-EPLIN (BD Biosciences and Santa Cruz Biotechnology, Inc.), anti-β-tubulin (Sigma), anti-actin (Sigma), anti-VE-cad (BV9) (19, 20), anti-vinculin (7F9, Santa Cruz Biotechnology, Inc.), and anti-β-catenin (BD Biosciences) antibodies and the polyclonal rabbit anti-α-catenin (Sigma), goat anti-VE-cadherin (C19, Santa Cruz Biotechnology, Inc.), and rabbit anti-EPLIN (Bethyl Laboratories) antibodies were used in Western blot, immunoprecipitation, and immunofluorescence experiments. The secondary Cy3-conjugated anti-mouse antibody and the secondary HRP-conjugated antibodies were from Jackson ImmunoResearch Laboratories, and the secondary Alexa Fluor 488-conjugated anti-rabbit and anti-goat antibodies, Alexa Fluor 568-conjugated anti-mouse antibody, and the Alexa Fluor 633- and Alexa Fluor 647-conjugated phalloidin were from Invitrogen. Control siRNA and siRNA specific for human EPLIN possessing the sequence 5′-UUAUAGAGGUUUCUGAGAGGCGUGG-3′ as specified by Abe and Takeichi (18) were obtained from Invitrogen.
cDNA Constructs and Protein Expression in Escherichia coli
A cDNA fragment encoding the full-length sequence of human EPLINα was produced by polymerase chain reaction (PCR) using the clone IRATp970H10110D (ImaGenes) as a template and the following pair of oligonucleotide primers: forward, 5′-GCAGGATCCATGGAAAATTGTCT-3′; and reverse, 5′-TGCGGTACCTCACTCTTCATCCT-3′. After digestion with BamHI and KpnI, the PCR fragment was inserted into the plasmid pQE30 (Qiagen) to construct the vector pQE30-EPLINα coding for human EPLINα fused with an N terminus His (His-EPLIN) (68.5 kDa). Similarly, a cDNA fragment encoding the full-length sequence of human α-catenin was produced by PCR using the clone IRATp970B0778D (ImaGenes) as a template and the following pair of oligonucleotide primers: forward, 5′-GCAACTAGTATGACTTCGGCAAC-3′; and reverse, 5′-TGCAAGCTTCTAGAAGGAATCCATTGC-3′. After digestion with SpeI and HindIII, the PCR fragment was inserted into the plasmid pET41c (Novagen) to construct the vector pET41c-α-catenin coding for human α-catenin fused with an N terminus GST (GST-α-catenin) (126.5 kDa). Prior to the expression of the proteins, the cDNA constructs were sequenced to verify that no mutation had arisen during PCR.
To produce His-EPLIN, GST-α-catenin, and GST proteins, the E. coli BL21 RIL or BL21-DE3 strains (Stratagene) were transformed with the plasmids pQE30-EPLINα, pET41c-α-catenin, and pET41c, respectively. When the absorbance of the cultures reached 0.6–0.7 at 600 nm, the production of His-EPLIN, GST-α-catenin, and GST proteins was induced by adding to bacterial cultures 0.5, 1, and 10 μm isopropyl 1-thio-β-d-galactopyranoside, respectively, and completed within 3 h. After a 20-min centrifugation at 5000 rpm, bacteria were collected and resuspended in sonication buffer (50 mm Tris, pH 8, 150 mm NaCl, 6 mm reducing agent tris(2-carboxyethyl)phosphine). Following sonication, the three recombinant proteins were soluble. Consequently, after a 30-min sonicated lysate centrifugation at 14,000 rpm, pellets were discarded, and the supernatants were collected prior to be loading onto glutathione-Sepharose columns (GE HealthCare) for GST-α-catenin and GST or onto a nickel-chelating column (Qiagen) for His-EPLIN. The recombinant proteins were eluted from the affinity columns according to the manufacturers' protocols. The plasmid encoding for VE-Cad-GFP was described previously (21).
RNA Extraction and Analysis
Total RNA was extracted from HUVECs using the Nucleospin® RNA II kit (Macherey-Nagel). cDNAs were generated by reverse transcription using the SuperScript first strand synthesis system (Invitrogen) under conditions recommended by the manufacturer. RT-PCR was performed with the equivalent of 20 ng of reverse transcribed RNA using the AccuPrimeTM Taq DNA polymerase (Invitrogen) according to the parameters given in Table 1. The oligonucleotide primers used are listed in Table 2. Specific VE-cad, EPLIN, and hypoxanthine phosphoribosyltransferase (HPRT) PCR products were visualized by ethidium bromide staining.
TABLE 1.
PCR parameters
| Step | Conditions | No. of cycles |
|---|---|---|
| Initial denaturation | 3 min at 94 °C | 1 |
| Denaturation | 30 s at 94 °C | 30 |
| Annealing | 30 s at 55 °C | |
| Elongation | 30 s at 72 °C | |
| Final elongation | 10 min at 68 °C | 1 |
TABLE 2.
Primers used for amplifying PCR products
| Transcript | Sense | Antisense | Size |
|---|---|---|---|
| bp | |||
| VE-cadherin | 5′-CGCCTCTGTCATGTACCAAA-3′ | 5′-GTCTTCAGGCACGACAAATG-3′ | 252 |
| EPLIN | 5′-GGAGCAAAAGGAGAATGTGC-3′ | 5′-AATAGGAGCAACGGAAGCAG-3′ | 359 |
| HPRT | 5′GACCAGTCAACAGGGGACAT-3′ | 5′-AAGCAGATGGCCACAGAACT-3′ | 427 |
Cell Culture and Transfection
Culture conditions for Caco2, MDCK, Eahy926, and hCMEC/D3 (22) cell lines and for HUVECs are summarized in Table 3. α-Minimum Eagle's medium, DMEM, nonessential amino acids, and low serum growth supplement were from Invitrogen. Fetal calf serum (FCS), EBM-2, and EGM-2 SingleQuots were from Lonza, and the antibiotic-antimycotic solution was from PAA Laboratories. HUVECs were transfected using nucleofection (Amaxa Biosystems) according to the manufacturer's protocol. Briefly, the day before transfection, cells were seeded at a density of 30,000 cells/cm2 in EBM-2 medium supplemented with EGM-2 SingleQuots. For each siRNA transfection, 2·106 cells were harvested using Reagent Pack (Cambrex) and pelleted by centrifugation (6 min at 1000 rpm) prior to being resuspended in 100 μl of Nucleofector® solution, mixed with 6 μl of siRNA at 20 μm, and subjected to nucleofection. siRNA-transfected cells were used at 24 or 48 h after transfection. For fluorescence recovery after photobleaching (FRAP) experiments, HUVECs were simultaneously transfected with the plasmid coding VE-cad-GFP and siRNA using the nucleofection method.
TABLE 3.
Conditions of culture of different cell lines
αMEM, α-Minimum Eagle's medium; ATAM, antibiotic-antimycotic solution; LSGS, low serum growth supplement.
| Cell type | Medium |
|---|---|
| Caco2 | αMEM, 20% FCS, 1% ATAM |
| MDCK | DMEM, 10% FCS, 1% ATAM, 1% nonessential amino acids |
| Eahy926 | DMEM, 10% FCS, 1% ATAM |
| hCMEC/D3 | EBM-2 supplemented with 1/4 of EGM-2 SingleQuots |
| HUVEC | M199, 20% FCS, 2% LSGS, 1% ATAM |
| EBM-2 supplemented with EGM-2 SingleQuots |
Cell Lysis and Western Blot Analysis
HUVEC monolayers were rinsed in Ca2+- and Mg2+-containing PBS and resuspended in lysis buffer (50 mm Tris-HCl, pH 7.5, 150 mm NaCl, 1% Nonidet P-40, 0.25% sodium deoxycholate, 1 mm EDTA, 10% glycerol, 5 μg/ml leupeptin, 2 μg/ml aprotinin, 2 mm PMSF, 1 mm Na3VO4) as described previously for epithelial cells (18). Cell lysates were collected and centrifuged at 15,000 × g for 10 min at 4 °C. The protein concentration in cell lysates was determined with a Micro-BCA kit (Pierce) using bovine serum albumin (BSA) as a standard. Protein extracts were resolved in MOPS buffer (Bio-Rad) on precast CriterionTM XT 4–12% gradient Bis-Tris gels (Bio-Rad) under reducing conditions and electrotransferred onto Immobilon®-P transfer membrane (Millipore). After a blocking step with 5% nonfat dry milk, proteins were detected by specific primary antibodies as specified and the appropriate horseradish peroxidase-conjugated goat anti-mouse or goat anti-rabbit immunoglobulins (Jackson ImmunoResearch Laboratories). When mentioned, the signal was quantified using ImageJ software.
Immunoprecipitation Experiments
2 mg of total lysates were precleared on Protein A- (Sigma) or Protein G-Sepharose (Sigma) beads for immunoprecipitation experiments performed with either polyclonal or monoclonal antibodies, respectively. Precleared lysates were then incubated with 6 μg of specific antibody or nonimmune IgG at 4 °C for 2 h under agitation. Beads were then added for an additional 2 h at 4 °C under agitation and washed three times in washing buffer (50 mm Tris-HCl, pH 7.5, 150 mm NaCl, 1% Nonidet P-40, 10% glycerol) prior to resuspension in Laemmli buffer. After bead centrifugation, supernatants were then analyzed on precast Criterion XT 4–12% gradient Bis-Tris gels (Bio-Rad).
Subcellular Fractionation
Membrane and cytosolic fractions were separated from HUVEC lysates by ultracentrifugation as described previously (23).
Calcium Switch Experiments
HUVECs grown in EBM-2 supplemented with EGM-2 SingleQuots (Clonetics) until confluence were rinsed with Ca2+- and Mg2+-free PBS and incubated in complete EBM-2 medium with 2 mm EGTA for 36 h prior to being switched back to complete EBM-2 medium for the indicated time.
Immunofluorescence Microscopy
For immunostaining, cells cultured on glass coverslips were rinsed several times in Ca2+- and Mg2+-containing PBS, fixed for 10 min at 37 °C in 4% paraformaldehyde, and permeabilized in 4% paraformaldehyde containing 0.5% Triton X-100 for 5 min at room temperature. After a blocking step in 2% BSA, cells were incubated with the primary antibody for 1 h and subsequently with the appropriate secondary antibody for 45 min. The nucleus was stained with Hoechst dye prior to coverslip mounting on a slide using FluorSaveTM reagent (Calbiochem). An Axioplan 2 microscope (Zeiss) equipped with a ×100 or ×50 objective was used for cell observation. Images were captured with an AxioCam MR camera using AxioVision software. When specified, images were acquired using a confocal microscope TCS-SP2 (Leica) with a ×63/1.4 objective.
Pulldown Assays
For GST pulldown assays, 50 μl of glutathione beads coupled with GST or GST-α-catenin were incubated overnight at 4 °C with 50 μl of His-EPLIN in the presence of 2% BSA or 2 mg of HUVEC total lysate. After three washing steps with 50 mm Tris, 150 mm NaCl, proteins were eluted with 10 mm glutathione and analyzed on a 4–12% gradient gel. Immunofluorescent staining of VE-Cad, EPLIN, and α-catenin in Matrigel matrix was performed following in-gel fixation and permeabilization of tubules using PBS containing 0.5% Triton X-100 and 4% paraformaldehyde.
In Vitro Proliferation Assay
Proliferation assays were performed using 96-well plates precoated overnight with 7 μg/ml fibronectin and blocked with PBS, 2% BSA for 2 h. 24 h after siRNA transfection, HUVECs were seeded at a density of 15,000 cells/well using 8 wells per condition. After 24- and 48-h incubation times, cells were fixed by adding 150 mm NaCl-containing Percoll (100 μl/well) and 10% glutaraldehyde-containing Percoll (50 μl/well). Cells were rinsed in PBS before staining with 0.1% (w/v) crystal violet. After extensive washing, colored cells were lysed in 0.2% Triton X-100. Cell density was quantified by measuring absorbance of the resulting solutions at 560 nm using a Bio-Rad microplate reader.
In Vitro Adhesion Assay
Cellular adhesion was assessed using 96-well plates precoated overnight with 0, 2.5, 5, and 10 μg/ml fibronectin. HUVECs were then seeded in serum-free medium at a density of 30,000 cells/well and incubated for 15 min at 37 °C to allow cell-matrix adhesion. An extensive and vigorous washing step with PBS was performed to remove nonadherent cells. As for the proliferation assay, cells were fixed in 150 mm NaCl-containing Percoll and 10% glutaraldehyde-containing Percoll and rinsed in PBS before staining with 0.1% (w/v) crystal violet. Colored cells were lysed in 0.2% Triton X-100, and cell density was quantified by measuring absorbance of the resulting solutions at 560 nm using a Bio-Rad microplate reader.
In Vitro Wounding Migration Assay
24 h after cell seeding in a 2-well Lab-Tek slide (Nunc), siRNA control- and siRNA EPLIN-treated HUVEC monolayers were scratched with a tip to obtain a linear wound. Reclosure of the wound was monitored by time lapse microscopy under low magnification (4×) until cells were reconstituted into homogenous monolayers. Distances covered by the migration fronts were measured at 20 different points along the wound using ImageJ software.
In Vitro Tubule Formation Assay
The angiogenic impact of EPLIN extinction was assessed using a Matrigel angiogenesis assay. 50 μl/cm2 Matrigel was plated into a 2-well Lab-Tek slide (Nunc) and maintained at 37 °C for 30 min to induce gel polymerization. Then 50,000 cells/cm2, counted with the Scepter handheld automated cell counter (catalogue number PHCC00000, Millipore), were seeded onto the Matrigel layer. Formation of tubes was visualized by time lapse microscopy under low magnification (4×) for 26 h. The total length of the vascular capillary network was quantified using ImageJ software.
FRAP Experiments
For VE-cad-GFP FRAP and spot tracking, images were acquired using a Zeiss ConfoCor microscope equipped with a plan apochromat 100× oil objective (numerical aperture, 1.4). Photobeaching was performed using the 488 nm line of an argon laser. The size of the spot was 0.8 μm2. Fluorescence recovery was then recorded every 3 s during 150 s over regions of interest of 180 × 100 pixels (9 × 3.6 μm2) centered on the spot and oriented parallel to the adherens junctions. Lateral movements of the junctions were compensated using the Stackreg plugin of ImageJ software. Using ImageJ software, the bleached intensity was calculated as the mean intensity in a 0.8-μm2 disk centered on the bleach spot. This intensity was then normalized by the mean intensity of the whole region of interest, excluding a 2.54-μm2 circular region centered on the bleached spot. The normalized intensity of the two prebleached time points were averaged to obtain a prebleached intensity reference. The time points were then expressed as a percentage of the prebleached intensity. Normalization by the mean intensity of the adherent junction, excluding the bleach spot (24), was also tested. No significant difference with the previous method was observed except that it is more sensitive to cell movements. Data were fitted using a diffusion dominant model (25),
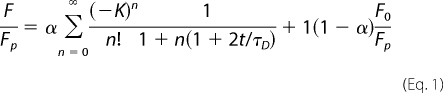 |
where Fp and F0 are the intensities before and just after bleach and α is the fraction of mobile proteins. τD = w2/D is the characteristic diffusion time where w is the waist of the laser beam and D is the coefficient of diffusion of the proteins. K is a parameter related to the kinetics of bleaching, F0/Fp = (1 − e−K)/K, for a Gaussian laser beam.
Time Lapse Videomicroscopy
Time lapse videomicroscopy experiments were performed on siRNA control- and siRNA EPLIN-treated HUVECs grown in a 2-well Lab-Tek slide. Images were collected with an IX71 Olympus microscope equipped with a heated work plate, a humidifier, and a CO2 delivery system and using an UPlan FLN ×4/0.13 PhL objective and an ORCA-ER camera (Hamamatsu). The microscope was also equipped with a motorized stage (Märzhäuser GmbH and Prior Scientific Instruments Ltd.) to allow multiposition and multicondition acquisition and automated experiments.
RESULTS
EPLIN Is Expressed in Endothelial Cells at Intercellular Junctions
In epithelial cells, EPLIN was recently shown to link actin filaments to α-catenin when bound to the E-cadherin·β-catenin complex (18). Because EPLIN expression was only reported in epithelial cells, we first investigated whether EPLIN was also present in endothelial cells. RT-PCR analysis revealed the existence of an EPLIN transcript in HUVECs (Fig. 1A). The presence of both EPLINα and -β proteins was detected by Western blot analysis in the endothelial Eahy926, hCMEC/D3, and human umbilical vascular endothelial cell types (Fig. 1B). However, although EPLINα and -β isoforms were expressed in similar amounts in MDCK and Caco2 epithelial cell lines, significantly lower EPLINβ protein levels were detected in endothelial cells, particularly in the Eahy926 cell line (Fig. 1B).
FIGURE 1.

EPLIN expression in epithelial and endothelial cells. A, RT-PCR analysis of EPLIN and VE-cadherin mRNAs in HUVECs. EPLIN (lane 1), HPRT (lane 2), HPRT and VE-cad (lane 3), and HPRT and EPLIN (lane 4) mRNAs were converted into cDNAs prior to being used as templates for subsequent PCR amplification. VE-cad was used as a positive control, and HPRT was used as an internal standard. A negative control was performed with no template (lane 5). B, Western blot analysis of EPLIN expression in Caco2, MDCK, Eahy926 (EAHY), hCMEC/D3 (HCMEC), and HUVEC lysates. The membrane was reprobed with anti-β-tubulin (β-tub) antibody as a protein loading control. C, Western blot analysis of the subcellular localization of EPLIN and α-catenin proteins in confluent HUVECs. The membrane (Mb) and cytoplasmic (Cyto) fractions were separated from HUVEC lysates by ultracentrifugation and then analyzed by Western blot for their EPLIN and α-catenin contents. Molecular mass markers (kDa) are given at the left margin of each blot.
To test whether EPLIN is able to promote interaction between the endothelial catenin·cadherin complex and F-actin as it does in epithelial cells, its subcellular localization was explored in HUVECs. The membrane and cytoplasmic fractions were separated from HUVEC lysates by ultracentrifugation and analyzed for their EPLIN content by Western blot (Fig. 1C). Similar to α-catenin, EPLIN was preferentially detected in the membrane fraction compared with the cytoplasmic fraction (Fig. 1C). An immunocytochemical localization of EPLIN was also carried out on HUVECs plated at different densities. Fig. 2 shows that EPLIN was mainly located along actin stress fibers in sparse cells, whereas it accumulated along the cortical actin ring in confluent monolayers. Similar results were obtained with hCMEC/D3, Eahy926, Caco2, and MDCK cells (Fig. 3A). Furthermore, EPLIN co-localized with α-catenin at cell-cell junctions in all cell types (Fig. 3B). Confocal microscopy further confirmed that EPLIN and α-catenin together with actin co-localized at cell-cell junctions. The three signals were present all along the intercellular junctions in the z axis. In addition, after a careful scrutiny of confocal images, we observed that whenever EPLIN was located at cell-cell junctions it appeared co-localized with α-catenin and actin. However, junctional α-catenin could be co-localized with actin in spots without EPLIN. These data led us to think that EPLIN could be one of the missing links between the VE-cad-based complex and the cortical actin filaments.
FIGURE 2.

Differential distribution of EPLIN in sparse and confluent HUVECs. HUVECs were plated on glass coverslips at two different densities and stained with anti-EPLIN antibody, FITC-phalloidin, and Hoechst. Bar, 20 μm.
FIGURE 3.

Subcellular localization of EPLIN and α-catenin in endothelial and epithelial cells. A, Caco2, MDCK, Eahy926 (EAHY), hCMEC/D3 (HCMEC), and human umbilical vascular endothelial cells were immunolabeled for EPLIN and α-catenin (α-Cat). Scale bar, 20 μm. B, confocal analysis of α-catenin, EPLIN, and F-actin on Caco2 and HUVEC monolayers. White lines reflect the plane for Z acquisition. Scale bar, 20 μm.
Association of EPLIN with VE-cadherin·Catenin Complex in HUVECs
To assess whether EPLIN is associated with the VE-cad·catenin complex in HUVECs, various immunoprecipitation experiments were performed (Fig. 4). In a first series of experiments, we show that α- and β-catenins as well as VE-cadherin were co-immunoprecipitated with EPLIN. Interestingly, only the entire 135-kDa form of VE-cadherin and not the intracellularly truncated 100-kDa form (Fig. 4B, VE-cad tr) was immunoprecipitated, indicating that the VE-cadherin cytoplasmic tail is necessary for its participation in the complex. Immunoprecipitations of α-catenin (Fig. 4C), β-catenin (Fig. 4D), and VE-cad (Fig. 4E) confirmed the association of EPLIN with α- and β-catenins and with VE-cad. To verify immunoprecipitation data, GST pulldown assays were performed using α-catenin N-terminally coupled to GST (GST-α-catenin). Pulldown assays performed with HUVEC extracts revealed that GST-α-catenin interacted with both α and β isotypes of endogenous EPLIN, whereas GST did not (Fig. 4F). To determine whether α-catenin is the element within the VE-cad·catenin complex that directly binds EPLIN, the GST-α-catenin fusion protein was assayed for its capacity to bind the purified recombinant EPLIN fused with a polyhistidine tag (His-EPLIN). As illustrated in Fig. 4G, GST-α-catenin precipitated His-EPLIN, whereas GST did not. These data indicate that in HUVECs EPLIN associates with the VE-cad·catenin complex via α-catenin.
FIGURE 4.

Association of EPLIN with VE-cadherin-based complex in HUVECs. Co-immunoprecipitations of EPLIN with VE-cad and α- and β-catenins in HUVECs are shown. Anti-EPLIN (B), α-catenin (α-cat) (C), β-catenin (β-cat) (D), and VE-cad (E) immunoprecipitations (IP) were probed successively for EPLIN, α-catenin, β-catenin, and VE-cad. As controls, the whole cell lysate (Lys) was run in parallel (A), and the immunoprecipitations performed using rabbit (negative control for anti-EPLIN, anti-α-catenin, and anti-VE-cad immunoprecipitations) or mouse (negative control for anti-β-catenin immunoprecipitation) non-immune IgG (NI) were analyzed simultaneously. Note that in B immunoprecipitations performed using the rabbit anti-EPLIN antibody were probed with the mouse anti-EPLIN antibody. *, nonspecific band revealed by mouse anti-EPLIN antibody. VE-Cad tr corresponds to a truncated form of VE-Cad cleaved at its C terminus and deleted of the catenin-binding domains (18). F, Interaction of α-catenin with EPLIN. GST or GST-α-catenin immobilized on glutathione beads was incubated with HUVEC lysates. Pulldown assays and whole HUVEC lysate were revealed with the mouse anti-EPLIN antibody. G, direct interaction between purified EPLIN and α-catenin. Purified His-EPLIN was incubated with purified GST or GST-α-catenin immobilized on glutathione beads as indicated. Pulldown assays and whole HUVEC lysate were revealed with the mouse anti-EPLIN antibody. Each panel is illustrative of three experiments. WB, Western blot.
Differential Recruitment of EPLIN and α-Catenin to Newly Formed Cell-Cell Contacts
Recruitment of EPLIN and α-catenin in the formation of cell-cell contacts was then investigated. Consequently, to initiate cell-cell contacts, HUVECs were treated with EGTA (for 36 h) and then switched to standard Ca2+ conditions. At different post-Ca2+ addition times, HUVECs were co-labeled for EPLIN and VE-cadherin (data not shown) and EPLIN and α-catenin. In low Ca2+-containing medium, EPLIN was clearly detected at cell edges but also along some actin fibers (Fig. 5D), whereas VE-cad appeared delocalized from cell-cell junctions (data not shown), and α-catenin exhibited a cytoplasmic punctate staining (Fig. 5E). After cell-cell adhesion was stimulated by calcium addition, α-catenin and VE-cadherin progressively accumulated at contact sites (Fig. 5K). Although EPLIN localized at cell edges before the initiation of cell-cell adhesion, α-catenin and VE-cadherin were recruited temporally.
FIGURE 5.

Differential recruitment of EPLIN, VE-cadherin, and α-catenin to newly formed cell-cell contacts in HUVECs. HUVECs grown in EGTA-containing medium were switched from low Ca2+ to standard Ca2+ conditions and fixed in normal Ca2+ conditions at 0, 10, and 60 min post-Ca2+ addition. Cells were stained for EPLIN (D, G, J), and α-catenin (α-cat; B, E, H, K). Bars, 20 μm.
EPLIN Abrogation Does Not Affect HUVEC Proliferation, Adhesion, and Migration
To further our understanding of the role of EPLIN at cell-cell junctions, abrogation of EPLIN was carried out in HUVECs using siRNA technology. We first established the time course of EPLIN down-regulation in HUVECs treated with EPLIN siRNA. Practically immediately after siRNA transfection, HUVECs were plated and allowed to grow for additional 24-, 48-, or 72-h periods of time prior to cell lysis. Western blot analysis indicated that at 24 h post-transfection EPLIN expression was 80% lower compared with control siRNA (Fig. 6, A and B). Between 48 and 72 h post-transfection, EPLIN expression progressively re-increased (Fig. 6, A and B). To test whether EPLIN silencing influenced the expression of VE-cad and α-catenin, Western blot analyses were carried out on EPLIN siRNA-treated HUVECs. Fig. 6C shows that the levels of VE-cad and α-catenin protein expression were unaffected by EPLIN knockdown.
FIGURE 6.

Transient depletion of EPLIN in HUVECs. A, Western blot analysis of EPLIN protein expression in siRNA-treated HUVECs. Lysates of HUVECs transfected with control (Ctrl) or EPLIN siRNA were analyzed by Western blot to determine EPLINα and -β protein levels. Immunoblots were reprobed with β-tubulin (β-tub) as a protein loading control. B, efficiency of EPLIN extinction at 24, 48, and 72 h post-siRNA transfection. Evaluation of the residual amounts of EPLIN was performed using the quantification of the immunoreactive bands after normalization to β-tubulin using ImageJ software. C, Western blot analysis of VE-cadherin, α-catenin, and tubulin protein expression levels in HUVECs transfected with control (siCtrl) and EPLIN (siEPLIN) siRNA. Lysates of siRNA-treated HUVECs were probed successively for EPLIN, VE-cad, α-catenin (α-cat), and β-tubulin (β-tub). β-Tubulin expression was monitored for normalization of protein loading. tr, truncated.
To investigate whether EPLIN depletion disrupts cell-cell adhesion and/or alters cell morphology, siRNA-treated HUVEC monolayers were labeled for EPLIN, α-catenin, and VE-cad. Down-regulation of EPLIN affected neither the distribution of α-catenin (Fig. 7A) and VE-cad (Fig. 7B) at sites of cell-cell contacts nor cell morphology (Fig. 7, A and B). But abrogation of EPLIN expression in HUVECs disturbed the organization of cortical F-actin. At confluence, control siRNA-treated HUVECs exhibited cortical F-actin organized along the adhesion belt (Fig. 7C, arrows). By contrast, EPLIN depletion led to a phalloidin staining decrease of the cortical actin ring with formation of gaps within the actin cytoskeleton network of adjoining cells (Fig. 7C, arrowheads). In addition, residual cortical actin bundles bridged adjacent cells by adopting a radial orientation. These features suggest that EPLIN is absolutely required for the elaboration of the cortical F-actin belt. Interestingly, EPLIN depletion led to an increase in actin stress fibers (Fig. 7C).
FIGURE 7.

Immunofluorescence analysis of EPLIN, α-catenin, VE-cad, and actin distributions in siRNA-treated confluent HUVECs. 24 h after transfection with control (Ctrl) or EPLIN siRNA, HUVECs were stained for EPLIN, α-catenin, and nuclei (Hoechst) (A); for EPLIN, VE-Cad, and nuclei (B); and for EPLIN, actin, and nuclei (C). In C, arrows point to cortical F-actin (above), and arrowheads point to gaps within the cortical F-actin network (below). Confocal images are representative of at least three independent experiments. Scale bars, 10 (A) and 20 μm (B and C).
No defect in cell growth rate was observed between siRNA control- and siRNA EPLIN-treated cells at 24- and 48-h incubation times (Fig. 8, A and B). Moreover, quantification of endothelial cell adhesion to a fibronectin-coated surface revealed that the number of adhering siRNA-treated cells increased with the level of coated fibronectin but was unaffected by EPLIN depletion (Fig. 8, C and E).
FIGURE 8.

Effect of EPLIN depletion on in vitro proliferation, adhesion, and wound healing assays. A and B, in vitro proliferation assay. siRNA-treated HUVECs were imaged after 24 and 48 h of proliferation after prestaining with crystal violet (A). Following lysis, optical density (OD) of the resulting solutions was measured at 560 nm. (B). □, control (Ctrl) siRNA-treated HUVECs; ■, siRNA-treated HUVECs. C and E, in vitro adhesion assay. 15 min after cell seeding, adherent siRNA-treated cells, stained with crystal violet, were imaged (C). After lysis, optical density of the resulting solutions was measured at 560 nm (E). D and F, wound healing assays. Confluent monolayers of siRNA-treated cells were scratched (time = 0) and imaged over time to track wound reclosure (D). The distances covered by the cell fronts were measured over time (F). Each panel is illustrative of three experiments. Fn, fibronectin.
Next, we tested whether EPLIN knockdown would have an impact on endothelial migration postinjury. Endothelial monolayers transfected with control or EPLIN siRNA were subjected to a wound repair assay, and time lapse imaging was used to document wound closure over time (Fig. 8D). For both control- and EPLIN siRNA-treated monolayers, wound closure was completed by 11 h postinjury. Distances covered by the cell fronts were plotted versus time, and the rates of wound closure indicate that HUVEC migration was not altered by EPLIN depletion (Fig. 8F). Moreover, automated single cell tracking of scratched monolayers revealed that the trajectories of cells are not affected by EPLIN down-regulation (data not shown). In conclusion, EPLIN depletion does not modify the ability of HUVECs to proliferate, adhere, and migrate.
EPLIN Is Not Essential for Stability of Mature VE-cadherin-mediated Adhesion
To gain insights into the role of EPLIN in the dynamics of mature VE-cad adhesion, we performed FRAP experiments. For this, we transiently co-transfected HUVECs with the cDNA plasmid coding VE-cad C-terminally fused with GFP (VE-cad-GFP) and with either control or EPLIN siRNA (Fig. 9). We characterized the dynamics of VE-cad-GFP localized to sites of cell-cell contacts in both siRNA control- and siRNA EPLIN-treated HUVEC monolayers (Fig. 9A). For both siRNA-treated cells, fluorescence signals came back within 50 s, and the mobile fraction was estimated to be 75% of the total junctional VE-cad-GFP population (Fig. 9B). The mean diffusion coefficients of VE-cad-GFP determined from 50 individual trajectories for each transfection condition were estimated to (5 ± 1) × 10−2 μm2·s−1 for control- as well as for EPLIN siRNA-treated HUVECs. This value is consistent with data published on E-cad-GFP (24), GFP-N-cad (26), and cad-11-GFP (27) when involved in mature cell-cell contacts. The fact that VE-cad diffusion is not affected by EPLIN depletion suggests that the primary function of EPLIN is not to control VE-cad-mediated stability at adherens junctions.
FIGURE 9.

Dynamics of VE-cad-GFP at endothelial cell-cell contacts. A, representative examples of pre- and postphotobleached images of VE-Cad-GFP at cell-cell contacts. VE-cad-GFP-overexpressing HUVECs transfected with either control or EPLIN siRNA were grown to confluence prior to performing FRAP experiments. Photobleached spots are circled. B, mean fluorescence recovery curves for control and EPLIN siRNA-treated HUVECs. The curves were generated from 50 independent experiments for control (top) and EPLIN (bottom) siRNA-treated cells.
Role of EPLIN in Mechanotransduction
Vinculin is another actin-binding protein known to directly interact with α-catenin (9, 28, 29). To test whether EPLIN and vinculin can interact with VE-cad-bound α-catenin, their respective immunocytochemical localization was analyzed in HUVECs. Fig. 10A showed that vinculin localized at both focal adhesion (arrowheads) and cell-cell junction sites (arrows). As cell confluence increased, cell-cell junctions lost their zig-zag aspect, and vinculin and EPLIN accumulated at cell-cell junctions. In fact, co-localization of EPLIN and vinculin appeared restricted to areas where cell-cell junctions were mature.
FIGURE 10.

Subcellular distributions of EPLIN and vinculin in HUVECs. A, HUVECs were stained with polyclonal anti-EPLIN, mAb anti-vinculin, Alexa Fluor 488-labeled goat anti-rabbit, and Alexa Fluor 568-labeled goat anti-mouse antibodies and Hoechst. Bar, 20 μm. Arrows and arrowheads point to mature and immature cell-cell junctions, respectively. B, immunofluorescence analysis of EPLIN and vinculin (Vin) distributions in siRNA-treated HUVECs. 24 h after transfection with control (Ctrl) or EPLIN siRNA, HUVECs were stained for EPLIN, vinculin, and nuclei (Hoechst) as described in A. Scale bar, 20 μm. Boxed regions are magnified in the side panels. Scale bar, 10 μm.
We next sought to determine whether vinculin and EPLIN are recruited at cell-cell junctions independently of each other. For this, the immunolocalization of vinculin was analyzed in EPLIN-depleted HUVECs. A clear delocalization of vinculin from cell-cell junctions was observed in the absence of EPLIN in contrast to what happened in control siRNA-treated HUVECs (Fig. 10B). This observation indicates that the recruitment of vinculin at cell-cell junctions requires the presence of EPLIN.
Recently, it was discovered that vinculin reversibly disappeared from epithelial cell-cell junctions when force generated by myosin II was inhibited with blebbistatin (9), a specific inhibitor of non-muscle myosin II activity (30). To investigate whether EPLIN and vinculin are affected by actomyosin activity in HUVECs, we examined the junctional localization of EPLIN and vinculin in HUVECs treated for 30 min with different concentrations of blebbistatin (Fig. 11). In HUVECs treated with 0, 5, 10, and 50 μm blebbistatin, EPLIN was nearly completely co-localized with α-catenin at cell-cell junctions despite the disturbing effects of blebbistatin on cell-cell junctions (Fig. 11A). In contrast, junctional vinculin staining was strikingly reduced in blebbistatin-treated HUVECs, indicating that drug treatment caused a redistribution of vinculin from cell-cell junctions (Fig. 11B). Together, these results indicate that in HUVECs EPLIN is present at cell-cell junctions independently of myosin II contractility, whereas junctional localization of vinculin requires myosin II activity.
FIGURE 11.

Effect of blebbistatin treatment on subcellular localization of α-catenin, EPLIN, and vinculin revealed by confocal microscopy analysis. HUVECs treated with 0, 5, 10, and 50 μm blebbistatin (Blebb) were fixed before double labeling for α-catenin and EPLIN (A) and for α-catenin and vinculin (B). Scale bars, 20 μm.
To quantify the blebbistatin sensitivity of the two junctional proteins vinculin and EPLIN, we determined the EPLIN/α-catenin and vinculin/α-catenin fluorescent intensity ratios at cell-cell junctions in blebbistatin-treated cells (Fig. 12). This quantification revealed a significant reduction in the vinculin level after blebbistatin treatment (Fig. 12B). More precisely, the reduction reached 34 and 59% in HUVECs treated with 5 and 10 μm blebbistatin, respectively. Similar analysis revealed no significant difference in the junctional level of EPLIN between control and blebbistatin-treated HUVECs (Fig. 12C). This difference of behavior probably reflects the differential capacity of EPLIN and vinculin to interact with α-catenin.
FIGURE 12.

Effects of blebbistatin on junctional recruitment of vinculin and EPLIN. After pretreatment with 0, 5, or 10 μm blebbistatin, HUVECs were double stained for EPLIN and α-catenin and for vinculin and α-catenin. Fluorescence intensities were measured along white lines perpendicularly drawn to cell-cell junctions as illustrated in A. After background subtraction, fluorescence intensity profiles were generated, and the maximal intensity of fluorescence was used as a measure of junctional protein level. For normalization, EPLIN and vinculin maximal intensities of fluorescence were divided by the corresponding α-catenin maximal intensity of fluorescence to generate EPLIN/α-catenin (B) and vinculin/α-catenin (C) ratios. The mean values for the ratios were obtained from 20 measures for each condition. Statistical analysis using the Tukey method indicated that the junctional level of vinculin decreased, whereas the junctional level of EPLIN remained roughly constant as blebbistatin concentration increased.
Impact of EPLIN Depletion on Angiogenesis
We next wondered whether EPLIN depletion would impair more elaborate processes, such as in vitro angiogenesis, during which intracellular tensions generated by the actin cytoskeleton and transmitted from cell to cell through adherens junctions are required for proper vascular organization (31–33). To investigate the effect of EPLIN depletion on angiogenesis, in vitro tubule formation assays were performed using a Matrigel matrix onto which an equal number of HUVECs pretreated with either EPLIN or control siRNA were seeded. Observation by phase-contrast microscopy showed that control- and EPLIN siRNA-transfected cells kept the capacity to elaborate precapillary structures. Immunostaining of these pseudovascular structures showed that EPLIN co-localized at cell-cell junctions with VE-cadherin (Fig. 13A) and α-catenin (Fig. 14A). Moreover, at EPLIN-null junctions, VE-cadherin and α-catenin immunofluorescent signals were still detectable, indicating that EPLIN depletion in precapillary structures did not affect the subcellular localization of VE-Cad (Fig. 13B) and α-catenin (Fig. 14B).
FIGURE 13.

Localization of EPLIN and VE-cadherin in pseudovascular structures elaborated in Matrigel matrix. Pseudovascular tubules were formed using untreated HUVECs (A) or siRNA-treated HUVECs (B). 24 h after cell seeding, cells were labeled for EPLIN, VE-cadherin, and nuclei as performed in Fig. 7B. Ctrl, control.
FIGURE 14.

Localization of EPLIN and α-catenin in pseudovascular structures elaborated in Matrigel matrix. Pseudovascular tubules were formed using untreated HUVECs (A) or siRNA (si)-treated HUVECs (B). 24 h after cell seeding, cells were labeled for EPLIN and α-catenin (α-cat) as performed in Fig. 7A. Ctrl, control.
By time lapse microscopy, we noticed that a progressive formation of lacunae emerged from the organization of HUVECs initially homogeneously distributed on the Matrigel matrix (Fig. 15A). To temporally quantify the vascular network construction, the total length of capillaries was measured over time using ImageJ software. At 2 h postseeding, control and EPLIN siRNA-treated HUVECs exhibited preliminary capillary networks with equivalent total lengths prior to undergoing powerful remodeling (Fig. 15, 2 h). As illustrated for control siRNA-transfected cells in Fig. 15B, this vascular network remodeling process could be clearly divided into two phases. During the first phase (2–12 h), the lacunae grew and fused, leading to an exponential decrease of the network length (Fig. 15A). In the second phase (12–26 h), the vascular network reached a steady state, leading to a stabilization of the total capillary length. For EPLIN siRNA-down-regulated HUVECs, a very similar decrease of the network length was observed during the 2–12-h postseeding period. But in contrast to what happened for control siRNA-treated cells during the second phase, network length continuously decreased with post-cell seeding time (Fig. 15B). We observed that internodal connections were lacking, and a certain number of endothelial cells remained as single cells, unincorporated into any tubular structures or agglutinated into bunches at the tips of retracting tubes after their breakage (Fig. 15A, arrowhead). Compared with the preliminary networks, at 26 h postseeding, control and EPLIN siRNA-treated cells showed a 43 and 70% decrease of total network length, respectively (Fig. 15B). Careful examination of the network generated from EPLIN-down-regulated cells revealed that vascular capillaries underwent numerous breakage events (Fig. 15A, arrows). This led to a concomitant lacuna surface growth and network length decrease. Quantification of the breakage events revealed that in the absence of EPLIN the precapillary network tended to break twice more than in control cells (Fig. 15C). To verify that no apoptosis took place in the absence of EPLIN, we performed caspase 3 immunostaining of the pseudovascular networks elaborated in the presence or absence of EPLIN at 24 h postseeding. In both experiments, very few cells exhibited caspase 3 staining, indicating that no apoptosis arose during the formation of the pseudovascular networks (data not shown). We conclude that EPLIN-depleted HUVECs maintain their ability to elaborate preliminary vascular networks; however, the vascular pseudocapillaries regress during the remodeling process. Because intercellular tensions increase during this latter step (31), this feature possibly reflects an alteration in the link between the VE-cad·catenin complex and the cortical actin ring as observed previously in HUVECs seeded on fibronectin-coated dishes.
FIGURE 15.

Effect of EPLIN depletion on in vitro tubule formation assay. A, phase-contrast videomicroscopy images comparing the vascular network formation process for HUVECs pretreated with control (siCtrl) or EPLIN (siEPLIN) siRNAs. 24 h after siRNA transfection, HUVECs were plated onto Matrigel layers for 2 h before time lapse microscopy of the temporal evolution of precapillary structures. Postseeding time is mentioned on each image. Arrows point to capillary network breakage. Note that some endothelial cells aggregated into bunches (arrowheads). B, quantification of the vascular network full length. Phase-contrast videomicroscopy images, such as those presented in A, were analyzed using ImageJ software to calculate the full length of the capillary network. Mean values reported in this panel were calculated from three different observation fields. ■, control siRNA-treated HUVECs; □, EPLIN siRNA-treated HUVECs. * indicates a statistical difference with a p value <0.05. C, quantification of the average number of breakage events per image over time. Breakage events were counted 26 h after cell seeding. Mean values reported in this panel were calculated from three different observation fields. Each panel is illustrative of four experiments.
DISCUSSION
There is growing evidence that cells and tissues are subjected to intercellular forces during cell remodeling and tissue morphogenesis (46). This mainly occurs through adherens junctions mostly by cadherins, suggesting that the cadherin complex is physically and mechanically coupled to the actin cytoskeleton (24, 34). The traditional view proposing that cadherin·catenin complexes are directly anchored to F-actin through α-catenin has been contested recently with convincing data proving that α-catenin cannot simultaneously bind to cadherin-β·γ-catenin complex and actin (6, 7). To encompass all these observations, it could be assumed that some mediators are able to bridge the cadherin·catenin complex to F-actin. This view correlates with the discovery that an increasing number of actin-associated proteins, such as vinculin (35), α-actinin (8, 36), formin (37), and Ajuba (38), are able to associate with α-catenin. By directly associating with α-catenin, vinculin (28) and Ajuba (38) contribute to the bridging of E-cadherin adhesive complexes to the cortical actin cytoskeleton in epithelial cells. Through these different types of connections, α-catenin can associate with various actin structures. In a recent study, EPLIN was described as a novel mediator able to couple E-cadherin·catenin to F-actin (18), but whether this occurs in endothelial intercellular junctions needs to be explored.
Until now, EPLIN has been considered as an epithelial protein down-regulated in many epithelial cancer cell lines. In the present study, we show that EPLIN mRNA and EPLINα and -β proteins are also present in HUVECs (Fig. 1). Additionally, we observed that EPLINα protein is expressed at comparable levels in epithelial and in endothelial cells of venous or microvascular origin. Altogether, these findings contradict previous reports that mentioned no or only weak expression of EPLIN at mRNA and protein levels in arterial (39) and venous (12, 15) endothelial cells. We also found that EPLINβ protein is less expressed in endothelial cells. As isotypes α and β are generated by two independent promoters, it is thus likely that EPLINβ promoter is differentially regulated in epithelial and endothelial cells (40).
Our first investigations on EPLIN subcellular localization in confluent HUVECs showed that EPLIN is mostly associated with the plasma membrane and more particularly at cell-cell junctions where it co-localizes with α-catenin in agreement with a recent study on epithelial cells (Fig. 3) (18). Previous reports mentioned that EPLIN is predominantly distributed along actin stress fibers in U2OS osteosarcoma (41), primary osteoblasts (16), and EPLIN-overexpressing NIH 3T3 cells (16). Similarly, in sparse HUVECs, EPLIN is mainly localized along stress fibers, consistent with the idea that it is an actin-binding protein (Fig. 2) (12).
Our data also highlight an association between VE-cad and EPLIN. Direct interaction of EPLIN and α-catenin was subsequently attested by in vitro binding of His-EPLIN and GST-α-catenin and by co-immunoprecipitation experiments using HUVECs (Fig. 4). Additionally, we proved that EPLIN associates with α-catenin tethered to the VE-cadherin adhesive complex. Thus, these data provide evidence that EPLIN participates in the linkage of the VE-cad·catenin complex to the cortical actin fibers via α-catenin and also predict that EPLIN functions similarly in endothelial cells and in epithelial cells (18). In Ca2+ switch experiments, EPLIN, VE-cadherin, and α-catenin exhibited distinct cellular localization in low Ca2+-containing medium (Fig. 5). Although EPLIN was located at cell-cell junctions and on stress fibers, α-catenin and VE-cadherin appeared delocalized from cell-cell junctions. Ca2+ addition induced α-catenin and VE-cadherin recruitment at interendothelial junctions as described previously for VE-cad (42). The fact that both proteins were recruited at the same rate suggested that they were probably indirectly associated. Once positioned, α-catenin may interact with EPLIN already present at cell-cell junctions. Thus, α-catenin might be the last element that fills the gap between the VE-cadherin complex and the actin filament-EPLIN network.
Down-regulation of EPLIN has been described in many cancer-derived or transformed cells, and it was proposed that EPLIN could act as a tumor suppressor (12, 15). Overexpression of EPLIN in some transformed cells reverses their capacity to grow in an anchorage-independent way, indicating that EPLIN may function in growth control by associating with and regulating the actin cytoskeleton (41). Herein, to gain insights on the role of EPLIN in the endothelium, its expression was blocked by siRNA in HUVECs. EPLIN silencing did not affect VE-cad and α-catenin expression (Fig. 6). Neither the adhesive nor the proliferative properties of HUVECs appeared affected by EPLIN silencing (Fig. 8). In addition, EPLIN depletion had no impact on the rates of wound closure or the migration capacity of EPLIN-silenced cells remaining intact (Fig. 8). This is not in agreement with previous data indicating that EPLIN ectopic expression decreases motility and cell-matrix adhesion of human endothelial HECV cells (39). This discrepancy may arise from differences in experimental procedures. In one case, EPLINα was forcibly induced in HECV human endothelial cells, whereas we used EPLIN silencing by siRNA in human umbilical vascular endothelial primary cells.
However, in the absence of EPLIN, we observed a deficit of connections between cell-cell junctions and F-actin (Fig. 7). EPLIN depletion created gaps within the actin cortical network of adjacent cells. This probably reflects the defect in vinculin recruitment observed at cell-cell junctions in EPLIN-silenced HUVECs (Fig. 10).
EPLIN is recruited at endothelial cell-cell junctions without requiring actomyosin contractility (Fig. 11A). This feature demonstrates the capacity of EPLIN to interact with the closed conformation that α-catenin adopts in the absence of myosin II-mediated contractility. By contrast, vinculin escapes from endothelial cell-cell junctions when tension exerted by the actomyosin cytoskeleton is reduced (Fig. 11B). This is in agreement with previous work showing that vinculin preferentially interacts with the stretched conformation of α-catenin at epithelial cell-cell junctions (9). We propose a model (Fig. 16) in which EPLIN primarily connects the VE-cadherin·catenin complex to F-actin by interacting with the closed conformation of α-catenin. Then because of the forces applied by the actin filament-EPLIN network, α-catenin adopts a stretched conformation, unmasking a cryptic binding domain for vinculin. Depending on the tension amplitude exerted by the cytoskeleton, we observed that cell-cell junctions recruit variable amounts of vinculin (Fig. 12). Vinculin, which also exhibits open and closed conformations (43, 44), may induce sequential recruitment of additional actin-binding proteins. Consequently, by acting them in concert, EPLIN and vitronectin reinforce the connections of the VE-cadherin complex to the cortical actin filaments (Fig. 16). The multiplicity of connections between the two entities is likely at the basis of adherens junction strengthening.
FIGURE 16.

EPLIN acts as a tension transducer at the basis of the conformational modification in α-catenin (adapted from Ref. 9). A, in the absence of EPLIN, actomyosin contractility is not transmitted to α-catenin (α-cat). Consequently, α-catenin keeps its folded conformation and cannot interact with vinculin as shown in Fig. 10B. B, in the presence of blebbistatin, actomyosin contractility is blocked, and α-catenin is maintained under a folded conformation, preventing vinculin recruitment as illustrated in Fig. 11B. C, when myosin II exerts its contractile activity, α-catenin adopts a stretched conformation, allowing vinculin recruitment and thus F-actin anchoring to cell-cell junctions. β-cat, β-catenin.
In Matrigel assays using EPLIN-silenced HUVECs, we observed that the precapillary network formed normally despite EPLIN down-regulation (Fig. 15A). This implies that EPLIN does not interfere with the early steps of the angiogenic process and correlates with the fact that cell-matrix and cell-cell adhesions are unaltered in EPLIN-silenced HUVECs. By contrast, during the later step of tube formation, there is a marked alteration of in vitro morphogenesis (Fig. 15A). Upon EPLIN depletion, a decrease of internodal connections and a regression of the vascular network occur as a result of an increase of breakage events within the capillary network (Fig. 15, B and C). Our immunolabeling data excluded the possibility that VE-cadherin and α-catenin could be delocalized from cell-cell junctions (Figs. 13 and 14). To explain these breakages, we hypothesized that EPLIN depletion would impair intercellular adhesion by increasing the mobility of VE-cadherin molecules decoupled from the actin cytoskeleton. Surprisingly, FRAP experiments revealed no difference in VE-cadherin mobility in the presence and absence of EPLIN (Fig. 9). Altogether, these results indicate that neither the mobility nor the junction stability was affected by EPLIN depletion.
Finally, we suspected that breakages undergone by precapillary structures result from the reduced density of F-actin anchored to adherens junctions. This defect should render cell-cell junctions more sensitive to forces exerted directly perpendicular to the cell-cell interface (45, 46).
In conclusion, our data indicate that EPLIN participates in a two-tiered mechanism leading to optimal interaction between the adherens junctions and the actin cytoskeleton. In this context, the EPLINα-catenin link provides a mechanosensory machinery by acting as a tension transmitter. This machinery is required for in vitro vascular morphogenesis. As tumor angiogenesis has become a major target of anticancer therapies (47), the understanding of a novel mechanism of vessel formation may have clinical significance.
Footnotes
- cad
- cadherin
- EPLIN
- epithelial protein lost in neoplasm
- HUVEC
- human umbilical vascular endothelial cell
- HPRT
- hypoxanthine phosphoribosyltransferase
- MDCK
- Madin-Darby canine kidney
- FRAP
- fluorescence recovery after photobleaching
- Bis-Tris
- 2-[bis(2-hydroxyethyl)amino]-2-(hydroxymethyl)propane-1,3-diol.
REFERENCES
- 1. Aird W. C. (2007) Phenotypic heterogeneity of the endothelium: II. representative vascular beds. Circ. Res. 100, 174–190 [DOI] [PubMed] [Google Scholar]
- 2. Liebner S., Cavallaro U., Dejana E. (2006) The multiple languages of endothelial cell-to-cell communication. Arterioscler. Thromb. Vasc. Biol. 26, 1431–1438 [DOI] [PubMed] [Google Scholar]
- 3. Vestweber D. (2008) VE-cadherin: the major endothelial adhesion molecule controlling cellular junctions and blood vessel formation. Arterioscler. Thromb. Vasc. Biol. 28, 223–232 [DOI] [PubMed] [Google Scholar]
- 4. Gavard J. (2009) Breaking the VE-cadherin bonds. FEBS Lett. 583, 1–6 [DOI] [PubMed] [Google Scholar]
- 5. Shapiro L., Weis W. I. (2009) Structure and biochemistry of cadherins and catenins. Cold Spring Harb. Perspect. Biol. 1, a003053. [DOI] [PMC free article] [PubMed] [Google Scholar]
- 6. Drees F., Pokutta S., Yamada S., Nelson W. J., Weis W. I. (2005) α-Catenin is a molecular switch that binds E-cadherin-β-catenin and regulates actin-filament assembly. Cell 123, 903–915 [DOI] [PMC free article] [PubMed] [Google Scholar]
- 7. Yamada S., Pokutta S., Drees F., Weis W. I., Nelson W. J. (2005) Deconstructing the cadherin-catenin-actin complex. Cell 123, 889–901 [DOI] [PMC free article] [PubMed] [Google Scholar]
- 8. Nieset J. E., Redfield A. R., Jin F., Knudsen K. A., Johnson K. R., Wheelock M. J. (1997) Characterization of the interactions of α-catenin with α-actinin and β-catenin/plakoglobin. J. Cell Sci. 110, 1013–1022 [DOI] [PubMed] [Google Scholar]
- 9. Yonemura S., Wada Y., Watanabe T., Nagafuchi A., Shibata M. (2010) α-Catenin as a tension transducer that induces adherens junction development. Nat. Cell Biol. 12, 533–542 [DOI] [PubMed] [Google Scholar]
- 10. Vestweber D., Winderlich M., Cagna G., Nottebaum A. F. (2009) Cell adhesion dynamics at endothelial junctions: VE-cadherin as a major player. Trends Cell Biol. 19, 8–15 [DOI] [PubMed] [Google Scholar]
- 11. Chang D. D., Park N. H., Denny C. T., Nelson S. F., Pe M. (1998) Characterization of transformation related genes in oral cancer cells. Oncogene 16, 1921–1930 [DOI] [PubMed] [Google Scholar]
- 12. Maul R. S., Chang D. D. (1999) EPLIN, epithelial protein lost in neoplasm. Oncogene 18, 7838–7841 [DOI] [PubMed] [Google Scholar]
- 13. Zheng Q., Zhao Y. (2007) The diverse biofunctions of LIM domain proteins: determined by subcellular localization and protein-protein interaction. Biol. Cell 99, 489–502 [DOI] [PubMed] [Google Scholar]
- 14. Maul R. S., Song Y., Amann K. J., Gerbin S. C., Pollard T. D., Chang D. D. (2003) EPLIN regulates actin dynamics by cross-linking and stabilizing filaments. J. Cell Biol. 160, 399–407 [DOI] [PMC free article] [PubMed] [Google Scholar]
- 15. Jiang W. G., Martin T. A., Lewis-Russell J. M., Douglas-Jones A., Ye L., Mansel R. E. (2008) Eplin-α expression in human breast cancer, the impact on cellular migration and clinical outcome. Mol. Cancer 7, 71. [DOI] [PMC free article] [PubMed] [Google Scholar]
- 16. Han M. Y., Kosako H., Watanabe T., Hattori S. (2007) Extracellular signal-regulated kinase/mitogen-activated protein kinase regulates actin organization and cell motility by phosphorylating the actin cross-linking protein EPLIN. Mol. Cell. Biol. 27, 8190–8204 [DOI] [PMC free article] [PubMed] [Google Scholar]
- 17. Chircop M., Oakes V., Graham M. E., Ma M. P., Smith C. M., Robinson P. J., Khanna K. K. (2009) The actin-binding and bundling protein, EPLIN, is required for cytokinesis. Cell Cycle 8, 757–764 [DOI] [PubMed] [Google Scholar]
- 18. Abe K., Takeichi M. (2008) EPLIN mediates linkage of the cadherin catenin complex to F-actin and stabilizes the circumferential actin belt. Proc. Natl. Acad. Sci. U.S.A. 105, 13–19 [DOI] [PMC free article] [PubMed] [Google Scholar]
- 19. Breviario F., Caveda L., Corada M., Martin-Padura I., Navarro P., Golay J., Introna M., Gulino D., Lampugnani M. G., Dejana E. (1995) Functional properties of human vascular endothelial cadherin (7B4/cadherin-5), an endothelium-specific cadherin. Arterioscler. Thromb. Vasc. Biol. 15, 1229–1239 [DOI] [PubMed] [Google Scholar]
- 20. Almagro S., Durmort C., Chervin-Pétinot A., Heyraud S., Dubois M., Lambert O., Maillefaud C., Hewat E., Schaal J. P., Huber P., Gulino-Debrac D. (2010) The motor protein myosin-X transports VE-cadherin along filopodia to allow the formation of early endothelial cell-cell contacts. Mol. Cell. Biol. 30, 1703–1717 [DOI] [PMC free article] [PubMed] [Google Scholar]
- 21. Delanoë-Ayari H., Al Kurdi R., Vallade M., Gulino-Debrac D., Riveline D. (2004) Membrane and acto-myosin tension promote clustering of adhesion proteins. Proc. Natl. Acad. Sci. U.S.A. 101, 2229–2234 [DOI] [PMC free article] [PubMed] [Google Scholar]
- 22. Weksler B. B., Subileau E. A., Perrière N., Charneau P., Holloway K., Leveque M., Tricoire-Leignel H., Nicotra A., Bourdoulous S., Turowski P., Male D. K., Roux F., Greenwood J., Romero I. A., Couraud P. O. (2005) Blood-brain barrier-specific properties of a human adult brain endothelial cell line. FASEB J. 19, 1872–1874 [DOI] [PubMed] [Google Scholar]
- 23. Heyraud S., Jaquinod M., Durmort C., Dambroise E., Concord E., Schaal J. P., Huber P., Gulino-Debrac D. (2008) Contribution of annexin 2 to the architecture of mature endothelial adherens junctions. Mol. Cell. Biol. 28, 1657–1668 [DOI] [PMC free article] [PubMed] [Google Scholar]
- 24. Cavey M., Rauzi M., Lenne P. F., Lecuit T. (2008) A two-tiered mechanism for stabilization and immobilization of E-cadherin. Nature 453, 751–756 [DOI] [PubMed] [Google Scholar]
- 25. Axelrod D., Koppel D. E., Schlessinger J., Elson E., Webb W. W. (1976) Mobility measurement by analysis of fluorescence photobleaching recovery kinetics. Biophys. J. 16, 1055–1069 [DOI] [PMC free article] [PubMed] [Google Scholar]
- 26. Comunale F., Causeret M., Favard C., Cau J., Taulet N., Charrasse S., Gauthier-Rouvière C. (2007) Rac1 and RhoA GTPases have antagonistic functions during N-cadherin-dependent cell-cell contact formation in C2C12 myoblasts. Biol. Cell 99, 503–517 [DOI] [PubMed] [Google Scholar]
- 27. Kiener H. P., Stipp C. S., Allen P. G., Higgins J. M., Brenner M. B. (2006) The cadherin-11 cytoplasmic juxtamembrane domain promotes α-catenin turnover at adherens junctions and intercellular motility. Mol. Biol. Cell 17, 2366–2376 [DOI] [PMC free article] [PubMed] [Google Scholar]
- 28. Watabe-Uchida M., Uchida N., Imamura Y., Nagafuchi A., Fujimoto K., Uemura T., Vermeulen S., van Roy F., Adamson E. D., Takeichi M. (1998) α-Catenin-vinculin interaction functions to organize the apical junctional complex in epithelial cells. J. Cell Biol. 142, 847–857 [DOI] [PMC free article] [PubMed] [Google Scholar]
- 29. Weiss E. E., Kroemker M., Rüdiger A. H., Jockusch B. M., Rüdiger M. (1998) Vinculin is part of the cadherin-catenin junctional complex: complex formation between α-catenin and vinculin. J. Cell Biol. 141, 755–764 [DOI] [PMC free article] [PubMed] [Google Scholar]
- 30. Straight A. F., Cheung A., Limouze J., Chen I., Westwood N. J., Sellers J. R., Mitchison T. J. (2003) Dissecting temporal and spatial control of cytokinesis with a myosin II inhibitor. Science 299, 1743–1747 [DOI] [PubMed] [Google Scholar]
- 31. Stéphanou A., Meskaoui G., Vailhé B., Tracqui P. (2007) The rigidity in fibrin gels as a contributing factor to the dynamics of in vitro vascular cord formation. Microvasc. Res. 73, 182–190 [DOI] [PubMed] [Google Scholar]
- 32. Arnaoutova I., George J., Kleinman H. K., Benton G. (2009) The endothelial cell tube formation assay on basement membrane turns 20: state of the science and the art. Angiogenesis 12, 267–274 [DOI] [PubMed] [Google Scholar]
- 33. McDonald D. M., Baluk P. (2005) Imaging of angiogenesis in inflamed airways and tumors: newly formed blood vessels are not alike and may be wildly abnormal: Parker B. Francis lecture. Chest 128, (suppl.) 602S–608S [DOI] [PubMed] [Google Scholar]
- 34. Smutny M., Yap A. S. (2010) Neighborly relations: cadherins and mechanotransduction. J. Cell Biol. 189, 1075–1077 [DOI] [PMC free article] [PubMed] [Google Scholar]
- 35. Imamura Y., Itoh M., Maeno Y., Tsukita S., Nagafuchi A. (1999) Functional domains of α-catenin required for the strong state of cadherin-based cell adhesion. J. Cell Biol. 144, 1311–1322 [DOI] [PMC free article] [PubMed] [Google Scholar]
- 36. Harris E. S., Nelson W. J. (2010) VE-cadherin: at the front, center, and sides of endothelial cell organization and function. Curr. Opin. Cell Biol. 22, 651–658 [DOI] [PMC free article] [PubMed] [Google Scholar]
- 37. Kobielak A., Pasolli H. A., Fuchs E. (2004) Mammalian formin-1 participates in adherens junctions and polymerization of linear actin cables. Nat. Cell Biol. 6, 21–30 [DOI] [PMC free article] [PubMed] [Google Scholar]
- 38. Marie H., Pratt S. J., Betson M., Epple H., Kittler J. T., Meek L., Moss S. J., Troyanovsky S., Attwell D., Longmore G. D., Braga V. M. (2003) The LIM protein Ajuba is recruited to cadherin-dependent cell junctions through an association with α-catenin. J. Biol. Chem. 278, 1220–1228 [DOI] [PubMed] [Google Scholar]
- 39. Sanders A. J., Ye L., Mason M. D., Jiang W. G. (2010) The impact of EPLINα (epithelial protein lost in neoplasm) on endothelial cells, angiogenesis and tumorigenesis. Angiogenesis 13, 317–326 [DOI] [PubMed] [Google Scholar]
- 40. Chen S., Maul R. S., Kim H. R., Chang D. D. (2000) Characterization of the human EPLIN (epithelial protein lost in neoplasm) gene reveals distinct promoters for the two EPLIN isoforms. Gene 248, 69–76 [DOI] [PubMed] [Google Scholar]
- 41. Song Y., Maul R. S., Gerbin C. S., Chang D. D. (2002) Inhibition of anchorage-independent growth of transformed NIH3T3 cells by epithelial protein lost in neoplasm (EPLIN) requires localization of EPLIN to actin cytoskeleton. Mol. Biol. Cell 13, 1408–1416 [DOI] [PMC free article] [PubMed] [Google Scholar]
- 42. Liao F., Doody J. F., Overholser J., Finnerty B., Bassi R., Wu Y., Dejana E., Kussie P., Bohlen P., Hicklin D. J. (2002) Selective targeting of angiogenic tumor vasculature by vascular endothelial-cadherin antibody inhibits tumor growth without affecting vascular permeability. Cancer Res. 62, 2567–2575 [PubMed] [Google Scholar]
- 43. Mierke C. T. (2009) The role of vinculin in the regulation of the mechanical properties of cells. Cell Biochem. Biophys. 53, 115–126 [DOI] [PubMed] [Google Scholar]
- 44. Carisey A., Ballestrem C. (2011) Vinculin, an adapter protein in control of cell adhesion signalling. Eur. J. Cell Biol. 90, 157–163 [DOI] [PMC free article] [PubMed] [Google Scholar]
- 45. Maruthamuthu V., Sabass B., Schwarz U. S., Gardel M. L. (2011) Cell-ECM traction force modulates endogenous tension at cell-cell contacts. Proc. Natl. Acad. Sci. U.S.A. 108, 4708–4713 [DOI] [PMC free article] [PubMed] [Google Scholar]
- 46. Liu Z., Tan J. L., Cohen D. M., Yang M. T., Sniadecki N. J., Ruiz S. A., Nelson C. M., Chen C. S. (2010) Mechanical tugging force regulates the size of cell-cell junctions. Proc. Natl. Acad. Sci. U.S.A. 107, 9944–9949 [DOI] [PMC free article] [PubMed] [Google Scholar]
- 47. Baluk P., Hashizume H., McDonald D. M. (2005) Cellular abnormalities of blood vessels as targets in cancer. Curr. Opin. Genet. Dev. 15, 102–111 [DOI] [PubMed] [Google Scholar]