

Abstract
This study investigated the preparatory control of motor inhibition and motor execution using a stop signal task (SST) and functional magnetic resonance imaging (fMRI). In the SST, a frequent “go” signal triggered a prepotent response and a less frequent “stop” signal prompted the inhibition of this response. Preparatory control of motor inhibition and execution in the stop signal trials were examined by contrasting brain activation between stop success and stop error trials during the fore‐period, in which participants prepared to respond to go or to stop. Results from 91 healthy adults showed greater activation in the right prefrontal cortex and inferior parietal lobule during preparatory motor inhibition. Preparatory motor execution activated bilateral putamen, primary motor cortices, posterior cingulate cortex, ventromedial prefrontal cortex, and superior temporal/intraparietal sulci. Furthermore, the extents of these inhibition and execution activities were inversely correlated across subjects. On the basis of a median split of the stop signal reaction time (SSRT), subjects with short SSRT showed greater activity in the right orbital frontal cortex during preparatory inhibition. These new findings suggest that the go and stop processes interact prior to target presentation in the SST, in accord with recent computational models of stop signal inhibition. Hum Brain Mapp, 2012. © 2011 Wiley Periodicals, Inc.
Keywords: stop signal, inhibitory control, proactive, prefrontal, race model, go/no‐go
INTRODUCTION
In the stop signal task (SST), participants are required to respond to a go signal during “go trials” which occur frequently and set up a prepotent response tendency. In “stop trials” where a stop signal follows the go signal, participants are required to inhibit the response. The SST is widely used to study the cerebral processes of cognitive control [Verbruggen and Logan, 2008].
An important issue in the study of stop signal inhibition concerns the influence of top‐down/preparatory control. Neuronal recordings have documented these preparatory activities in animals [Everling and Munoz, 2000; Johnston et al., 2007; Narayanan and Laubach, 2009]. For example, Stuphorn et al. [ 2010] showed that neurons in the supplementary eye field (SEF) exhibited stronger activation before target presentation in successfully than unsuccessfully inhibited stop trials, indicating a role of the SEF in preparatory motor inhibition. In another study, Lo et al. [ 2009] observed high baseline activity in the fixation neurons of frontal eye field and superior colliculus before stop signal onset. These fixation neurons inhibited movement neurons, suggesting a top‐down control for movement inhibition.
Preparatory processes related to motor inhibition have been studied using functional magnetic resonance imaging (fMRI) in humans. Jaffard and colleagues [ 2008] examined the neural processes underlying proactive inhibition in a simple reaction time task that involved target detection (see also Ballanger, 2009]. By comparing trials in which participants had to withhold movements while waiting for target appearance (not cued; inhibition in place) and trials in which a cue signaled the appearance of an upcoming target (cued; inhibition released), they observed greater activation of the superior medial prefrontal cortex and inferior parietal lobule in support of preparatory inhibitory control. More recently, Chikazoe et al. [ 2009] examined the preparation of inhibition in a SST. In addition to the ‘uncertain‐go’ trials where the go signal could be followed by a stop signal (inhibition in place), they introduced the ‘certain‐go’ trials where the go signal was never followed by a stop signal (inhibition released). The results showed greater activation in the pre‐supplementary motor area, inferior frontal gyrus, and bilateral insula during uncertain‐go as compared to certain‐go trials.
Although these two studies provided important clues to the neural processes underlying preparatory inhibition, a few potential confounds need to be considered. First, a cue that signals an upcoming target may lead to an odd‐ball effect by engaging attention and deactivating the default mode brain regions, as discussed in the study [Jaffard et al., 2008]. Second, neither study addressed preparatory inhibition that influenced behavioral outcomes. To do this, for instance, one would have to consider the greater difference in reaction time when the cue‐target interval is long (stimulus onset asynchrony or SOA = 500 ms) than short (SOA = 100 ms) between cued and not‐cued trials by directly examining trial by SOA interaction [Jaffard et al., 2008]. Similarly, Chikazoe et al. [ 2009] did not distinguish between success and failure of inhibition and thus fell short of addressing how preparatory control might influence behavioral outcomes. Furthermore, in both studies, the trial‐by‐trial uncertainty might have introduced affective processes that were not directly related to motor response inhibition. The current work aimed to circumvent these issues and elucidate preparatory processes that determined behavioral outcomes—stop success or error—in the SST.
In our previous studies of the SST, we examined regional brain activations with hemodynamic responses associated with go target onsets [Li et al., 2006b, 2008a, b, c]. Such a model did not capture preparatory activities, which required the events of interest to be described with the onsets of fixation point at the beginning of a trial. On the other hand, because the fixation point and go signal onsets in our SST were within 5 s of each other (see Materials and Methods), while the canonical hemodynamic response peaks at 6–10 s, it was not feasible to include both events in a single model to extract activation related specifically to preparation [Huettel et al., 2009; Huettel and McCarthy, 2000, 2001; Soon et al., 2003]. In the current study, we instead constructed two separate models to describe activations associated with the fixation point (F model) and go signal onsets (G model), and characterize the preparatory and signal‐evoked processes, respectively. By contrasting the two models with appropriate masks, we expected to identify regional brain activations specific to preparatory processes during stop signal inhibition.
We hypothesized that preparatory motor execution and inhibition would each involve structures known to exhibit delayed motor activities (e.g., primary motor cortex; Alexander and Crutcher, 1990] and to mediate attentional monitoring (e.g., inferior parietal lobule; Corbetta and Shulman, 2002]. On the basis of Lo et al.'s computational model [ 2009] of neuronal behaviors during saccade countermanding, we also expected a negative correlation between preparatory motor execution and inhibition. Specifically, the extent of regional brain activations during preparatory motor inhibition and execution should correlate inversely across subjects.
MATERIALS AND METHODS
Participants and Behavioral Task
Ninety‐one healthy adults (46 males) with a mean age of 28.9 years (SD = 7.9) participated in the study. Participants met the following criteria for recruitment: age between 18 and 60; right‐handed and able to read and write English; no current or history of diagnosis of any Axis I psychiatric or substance (except nicotine) use disorders; no current use of psychotropic medications; no significant current medical conditions including neurological, cardiovascular, endocrine, renal, hepatic, or thyroid disorders. Women who were pregnant or breast feeding were not recruited. Participants tested negative for cocaine, amphetamines, opioids, and benzodiazepines prior to their fMRI. All participants signed a written consent after they were given a detailed explanation of the study in accordance with institute guidelines and procedures approved by the Yale Human Investigation Committee.
All participants performed a stop signal task or SST (Fig. 1; Li et al., 2006b; Logan and Cowan, 1984; Logan et al., 1984]. Two types of trials, “GO” and “STOP” were randomly presented with an inter‐trial‐interval of 2 s (the time between the end of the previous trial and the start of the current trial). A fixation dot appeared on screen to signal the beginning of each trial. The dot was replaced by a “circle”—the go signal—after a time interval, the “fore‐period,” which varied from 1 s to 5 s. The randomized fore‐period minimized anticipation and allowed jittering of events of interest. Participants were instructed to press a button using the right index finger when they saw the circle. The circle disappeared at button press or after 1 s if the participant failed to respond.
Figure 1.
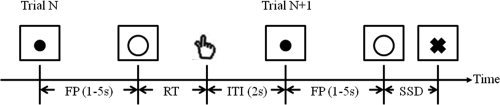
Stop signal paradigm. In GO trials (75%, Trial N), participants responded to the go signal (a circle) and in STOP trials (25%, Trial N+1) they had to withhold the response when they saw the stop signal (a cross). In both trials, the go signal appeared after a randomized time interval between 1 and 5 s (the fore‐period or FP, uniform distribution) following the appearance of the fixation point. The stop signal followed the go signal by a time delay ‐ the stop signal delay (SSD). The SSD was updated according to a staircase procedure, whereby it increased and decreased by 67 ms following a stop success (SS) and stop error (SE) trial, respectively. The inter‐trial‐interval (ITI) was 2 s. In this diagram, a GO trial was followed by a STOP trial to illustrate the two trial types and the ITI.
In approximately one quarter of the trials, the circle was followed by a “cross”—the stop signal. Participants were instructed not to press the button when they saw the cross. The trial terminated at button press or after 1 s if the participant successfully inhibited the response. The time between the go and stop signals, the stop signal delay (SSD), started at 200 ms and varied from one stop trial to the next according to a staircase procedure. If the participant successfully inhibited the response, the SSD increased by 67 ms in the next stop trial; if the participant failed in inhibiting the response, the SSD decreased by 67 ms. With the staircase procedure we anticipated that participants would succeed in withholding the response half of the time.
Participants were trained on the task before their fMRI. They were instructed to quickly press the button when they saw the go signal while keeping in mind that a stop signal might come up in some trials. In the scanner, they completed four sessions of the task, each lasting 10 minutes.
Behavioral Data Analysis
A critical SSD was computed for each participant; it represented the time delay required for the participant to successfully withhold a response in half of the stop trials [Levitt, 1971]. SSDs across stop trials were grouped into runs (sequences of trials), with each run defined as a monotonically increasing or decreasing series. We derived a mid‐run estimate by taking the middle SSD of every second run. The critical SSD was computed by taking the mean of all mid‐run SSDs (Supporting Information Fig. 1 ). It was reported that, except for experiments with a small number of trials (less than 30), the mid‐run estimate was close to the maximum likelihood estimate of X 50 (50% SS in the SST, Wetheril et al., 1966]. The stop signal reaction time (SSRT) was then computed for each participant by subtracting the critical SSD from the median reaction time in go trials [Logan and Cowan, 1984; Logan et al., 1984].
Imaging Protocol
Conventional T1‐weighted spin‐echo sagittal anatomical images were acquired for slice localization using a 3T scanner (Siemens Trio). Anatomical images of the functional slice locations were next obtained with spin‐echo imaging in the axial plan parallel to the AC‐PC line with TR = 300 ms, TE = 2.5 ms, bandwidth = 300 Hz/pixel, flip angle = 60°, field of view = 220 × 220 mm2, matrix = 256 × 256, 32 slices with slice thickness = 4 mm and no gap. Functional blood oxygenation level dependent (BOLD) signals were then acquired with a single‐shot gradient‐echo echo‐planar imaging (EPI) sequence. Thirty‐two axial slices parallel to the AC‐PC line covering the whole brain were acquired with TR = 2,000 ms, TE = 25 ms, bandwidth = 2,004 Hz/pixel, flip angle = 85°, field of view = 220 × 220 mm2, matrix = 64 × 64, 32 slices with slice thickness = 4 mm and no gap. Three hundred images were acquired in each run for a total of four runs.
Spatial Preprocessing of Brain Images
Data were analyzed with Statistical Parametric Mapping (SPM8, Wellcome Department of Imaging Neuroscience, University College London, UK). Images from the first five TRs at the beginning of each trial were discarded to enable the signal to achieve steady‐state equilibrium between radio frequency pulsing and relaxation. Images of each individual subject were realigned (motion‐corrected) and corrected for slice timing. A mean functional image volume was constructed for each subject for each run from the realigned image volumes. These mean images were co‐registered with the high resolution structural image and then segmented for normalization to an MNI (Montreal Neurological Institute) EPI template with affine registration followed by nonlinear transformation [Ashburner and Friston, 1999; Friston et al., 1995a]. Finally, images were smoothed with a Gaussian kernel of 8 mm at Full Width at Half Maximum.
General Linear Model
There were four possible trial outcomes: Go success (GS), go error (GE), stop success (SS), and stop error (SE) (Fig. 1). Two GLMs were constructed. The first GLM, the G model, was built with the onsets of the go signal from every trial convolved with a canonical hemodynamic response function (HRF) and the temporal derivative of the canonical HRF [Friston et al., 1995b]. For GS trials, the go signal onset was parametrically modulated by the reaction time and its temporal derivative; for SS and SE trials, the go signal onset was parametrically modulated by the SSD and its temporal derivative [Büchel et al., 1996, 1998; Cohen, 1997; Li et al., 2006b]. Realignment parameters in all 6 dimensions were also entered in the model. Serial autocorrelation of the time series was corrected by a first degree autoregressive or AR(1) model [Della‐Maggiore et al., 2002; Friston et al., 2000]. The data were high‐pass filtered (1/128 Hz cutoff) to remove low‐frequency signal drifts. The GLM estimated the component of variance that could be explained by each of the regressors. Otherwise identical, the second GLM ‐ the F model ‐ was built with the onsets of the fixation point instead of the go signal. We use a subscripted ‘G’ and ‘F’ to denote the model that the trial was in. For example, SEG and SEF each represent the SE trials in the G and F model, respectively.
Figure 2 illustrates the steps of our analyses. In the first level analysis, we constructed for each participant the contrasts SSG>SEG and SEG>SSG from the G model as well as SSF>SEF and SEF>SSF from the F model. Note that the canonical hemodynamic response is slow, peaking at 6–10 s and lasting for 20 s, while the fixation point and go signal onsets differed only by an average (fore‐period) of 3 s, it was not feasible to include both events in a single model [Huettel et al., 2009; Huettel and McCarthy, 2000, 2001; Soon et al., 2003]. On the other hand, the G or F model alone could not distinguish between preparatory and signal‐evoked processes. However, the contrasts SSG>SEG and SEG>SSG described differences in signal‐evoked cerebral processes of response inhibition and execution, whereas the contrasts SSF>SEF and SEF>SSF captured, to a larger extent, differences in preparatory processes of response inhibition and execution. By comparing the F and G models with appropriate masks, we could identify regional brain activations specific to the preparatory processes of motor inhibition and execution. Furthermore, with SSRT as an index of inhibitory control [Li et al., 2006b; Logan and Cowan, 1984; Logan et al., 1984], we examined whether the activities of specific brain areas during preparatory control would interact with SSRT.
Figure 2.
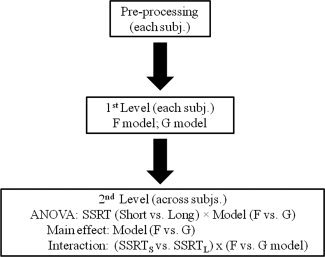
A flow chart illustrating the general analyses step by step.
To this end, in second level analysis, we used a flexible factorial design [Glascher and Gitelman, 2008] with the model (F vs. G) as the within‐subject factor and SSRT as the between‐subject factor. We were interested in the main effects of the model (F vs. G), i.e., (SSF>SEF)>(SSG>SEG) and (SEF>SSF)>(SEG>SSG), which reflect preparatory processes of motor inhibition and execution, respectively. However, each of these “compound” contrasts could be interpreted in two different ways. For example, the contrast (SSF>SEF)>(SSG>SEG) would produce identical activations as in (SEG>SSG)>(SEF>SSF). To ensure that activation reflects the former but not the latter, we created a mask that included areas in (SSF>SEF) and excluded areas in (SEG>SSG), both evaluated at P < 0.001, uncorrected. That is, we examined (SSF>SEF)>(SSG>SEG) with a mask of “(SSF>SEF) and ∼ (SEG>SSG)”. Similarly, we examined (SEF>SSF)>(SEG>SSG) with a mask of “(SEF>SSF) and ∼ (SSG>SEG)” to examine the preparatory processes of motor execution. Please see Supporting Information Figure 2 for additional explanations.
The interaction examined the difference in preparatory processes in participants with different SSRTs. The same masks were applied to the interactions. Specifically, the mask of “(SSF>SEF) and ∼ (SEG>SSG)” was applied to [(SSF>SEF)>(SSG>SEG)]Short > [(SSF>SEF)>(SSG>SEG)]Long, and the mask of “(SEF>SSF) and ∼ (SSG>SEG)” was applied to [(SEF>SSF)>(SEG>SSG)]Short > [(SEF>SSF)> (SEG>SSG)]Long.
Correlation Between Regional Brain Activations and SSRT
We used MarsBaR [Brett et al., 2002] to derive for each individual subject the effect size of activity change for regions of interest (ROI) identified for preparatory processes. In linear regressions we correlated across subjects the effect sizes between preparatory motor inhibition and execution to test whether these two processes were independent or interacting.
RESULTS
Behavioral Performance
Table I summarized the general performance on the SST. The median go trial reaction time was slightly shorter than the mean go trial reaction time, consistent with the right‐skewed reaction time distributions observed for the SST [Logan and Cowan, 1984; Logan et al., 1984]. On average, participants made errors in roughly half of the stop trials, suggesting that their overall performance was adequately tracked by the staircase procedure.
Table I.
Behavioral performance on the stop signal task across subjects
| Performance | ||
|---|---|---|
| Range | Mean ± standard deviation | |
| Median GORT | 315 ↔ 762 ms | 575 ± 96 ms |
| Mean GORT | 345 ↔ 762 ms | 583 ± 90 ms |
| SSRT | 98 ↔ 266 ms | 201 ± 33 ms |
| GS% | 89.8 ↔ 100 | 96.4 ± 2.9 |
| SS% | 44.9 ↔ 55.3 | 50.4 ± 2.2 |
GORT, go trial reaction time; SSRT, stop signal reaction time; GS%, percentage of go success trials; SS%, percentage of stop success trials.
Preparatory Processes: Main Effects of Model
Following our previous work [Li et al., 2006a, 2009], we examined for gender differences in the current study. Specifically, we included gender as a regressor in our analyses and found no differences between men and women. We therefore reported the results by combining men and women.
The two main effects each reflected preparatory processes for motor inhibition and execution: (SSF>SEF)>(SSG>SEG) and (SEF>SSF)>(SEG>SSG). Figure 3 and Supporting Information Table I showed the results of regional brain activations at P < 0.001, uncorrected. As described above, the contrast (SSF>SEF)>(SSG>SEG) was masked for small volume correction (SVC) by an ROI that included areas identified from SSF>SEF and excluded areas from SEG>SSG, both evaluated at P < 0.001, uncorrected. Similarly, the contrast (SEF>SSF)>(SEG>SSG) was masked by an ROI that included areas identified from SEF>SSF and excluded areas from SSG>SEG, both evaluated at P < 0.001, uncorrected (Supporting Information Figs. 3 and 4).
Figure 3.
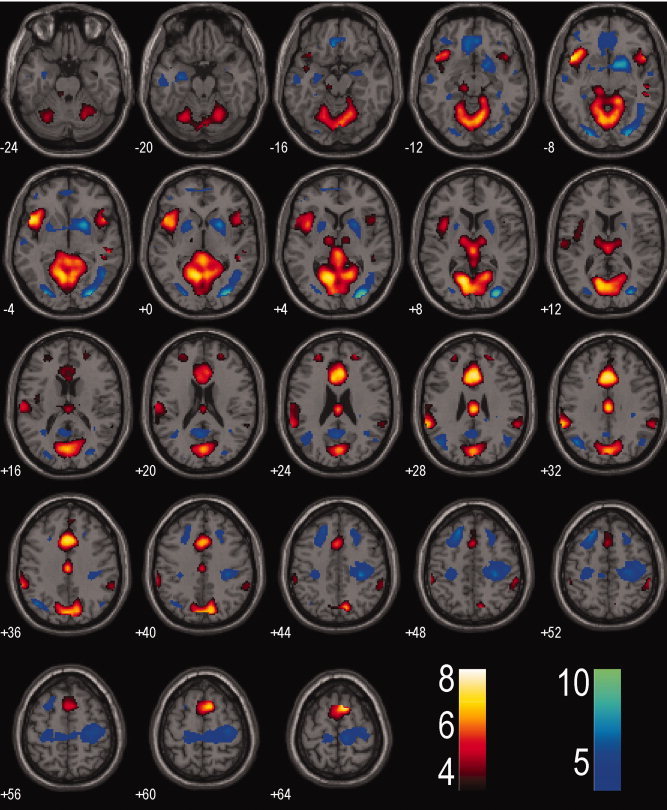
Regional brain activations identified from the ‘compound’ contrast that includes (SSF>SEF)>(SSG>SEG) in warm color and the ‘compound’ contrast that includes (SEF>SSF)>(SEG>SSG) in cold color overlaid on a T1 structural image. Whole brain analysis, p<0.001, uncorrected. Color bar represents voxel T value.
Figure 4.
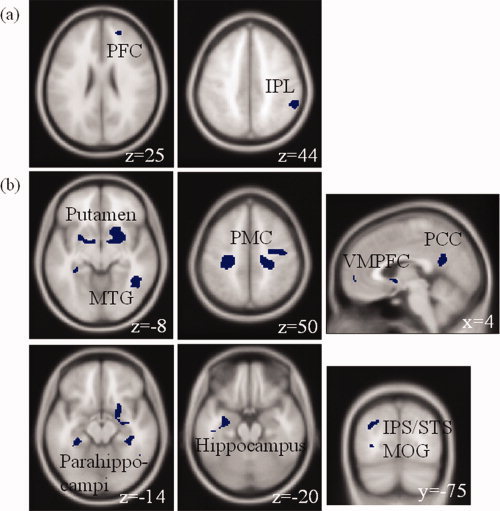
(a) Regional brain activations identified from “(SSF>SEF)>(SSG>SEG) and SSF>SEF but not SEG>SSG”. Activation was found in the right prefrontal cortex (PFC) and inferior parietal lobule (IPL). (b) Regional brain activations identified from “(SEF>SSF)>(SEG>SSG) and SEF>SSF but not SSG>SEG”. Activation was found in bilateral putamen, bilateral primary motor cortices (PMC), posterior cingulate cortex (PCC), ventromedial prefrontal cortex (VMPFC), right middle temporal gyrus (MTG), bilateral parahippocampi, left hippocampus, left middle occipital gyrus (MOG), and left superior temporal/intraparietal sulci (STS/IPS). [Color figure can be viewed in the online issue, which is available at wileyonlinelibrary.com.]
The results of SVC were obtained at a threshold of P < 0.05, corrected for false discovery rate or FDR [Genovese et al., 2002] and a cluster size greater than 10 voxels. The areas involved in preparatory motor inhibition included the right prefrontal cortex (PFC) and inferior parietal lobule (IPL). The areas involved in preparatory motor execution included bilateral putamen, bilateral primary motor cortices (PMC), posterior cingulate cortex (PCC), ventromedial prefrontal cortex (VMPFC), bilateral parahippocampi, left hippocampus, left middle occipital gyri (MOG), and left posterior ascending segment of superior temporal/intraparietal sulci (STS/IPS). Figure 4 shows the T maps overlaid on a structural image with identified brain areas listed in Table II.
Table II.
Regional brain activations for preparatory motor inhibition and execution with masking
| Contrast | Side | Region | Cluster | FDR P | Z | MNI Coordinate | ||
|---|---|---|---|---|---|---|---|---|
| Size | Value | Value | X | Y | Z | |||
| (SSF>SEF)>(SSG>SEG) | R | PFC | 16 | 0.000 | 4.69 | 24 | 50 | 25 |
| R | IPL | 53 | 0.000 | 4.57 | 63 | −46 | 31 | |
| (SEF>SSF)>(SEG>SSG) | R | Putamen | 258 | 0.000 | 7.29 | 18 | 5 | −8 |
| L | Putamen | 114 | 0.000 | 6.22 | −9 | 2 | −8 | |
| R | MTG | 54 | 0.000 | 6.06 | 48 | −58 | −5 | |
| R | PMC | 285 | 0.000 | 5.86 | 30 | −28 | 49 | |
| R/L | PCC | 144 | 0.000 | 5.85 | −3 | −55 | 19 | |
| L | Hippocampus | 16 | 0.000 | 5.79 | −30 | −10 | −20 | |
| L | STS/IPS | 61 | 0.000 | 5.51 | −42 | −70 | 28 | |
| L | MOG | 28 | 0.000 | 4.94 | −27 | −82 | 13 | |
| R/L | VMPFC | 10 | 0.000 | 4.85 | 3 | 56 | −2 | |
| L | PMC | 208 | 0.000 | 4.85 | −9 | −28 | 55 | |
| L | Parahippocampus | 21 | 0.002 | 4.17 | −33 | −37 | −11 | |
| R | Parahippocampus | 11 | 0.004 | 3.98 | 36 | −31 | −14 | |
PFC, prefrontal cortex; IPL, inferior parietal lobule; MTG, middle temporal gyrus; PMC, primary motor cortex; PCC, posterior cingulate cortex; STS/IPS, posterior ascending segment of superior temporal/intraparietal sulci; MOG, middle occipital gyrus; VMPFC, ventromedial prefrontal cortex.
To examine whether these preparatory activities of motor execution and inhibition are independent or interacting, we correlated the effect sizes of the regional brain activations across subjects. The results showed that preparatory activities of motor execution and inhibition were inversely correlated between most of these brain regions (Table III). As an example, Figure 5 illustrates the correlation between motor preparatory activity of the putamen and preparatory inhibitory activity of the IPL.
Table III.
Linear correlations (in Pearson's r) between regional brain activations during preparatory motor inhibition and execution
| Preparatory motor inhibition | |||||
|---|---|---|---|---|---|
| R PFC | R IPL | ||||
| Preparatory motor execution | r | P | r | P | |
| R Putamen | −0.3927 | 0.0001* | −0.4387 | 0.0000* | |
| L Putamen | −0.4197 | 0.0000* | −0.3960 | 0.0001* | |
| R MTG | −0.4312 | 0.0000* | −0.3385 | 0.0010* | |
| R PMC | −0.2845 | 0.0063 | −0.2339 | 0.0256 | |
| R/L PCC | −0.2072 | 0.0488 | −0.0510 | 0.6311 | |
| L Hippocampus | −0.1515 | 0.1518 | −0.0579 | 0.5859 | |
| L STS/IPS | −0.4073 | 0.0001* | −0.1648 | 0.1186 | |
| L MOG | −0.1230 | 0.2454 | −0.2126 | 0.0430 | |
| R/L VMPFC | −0.3075 | 0.0030 | −0.1730 | 0.1010 | |
| L PMC | −0.2771 | 0.0078 | −0.3134 | 0.0025 | |
| L Parahippocampus | −0.1640 | 0.1204 | 0.0187 | 0.8601 | |
| R Parahippocampus | −0.1561 | 0.1395 | −0.1403 | 0.1846 | |
PFC, prefrontal cortex; IPL, inferior parietal lobule; MTG, middle temporal gyrus; PMC, primary motor cortex; PCC, posterior cingulate cortex; STS/IPS, posterior ascending segment of superior temporal/intraparietal sulci; MOG, middle occipital gyrus; VMPFC, ventromedial prefrontal cortex. *P < 0.05/24 or P < 0.0021, corrected for multiple comparisons.
Figure 5.
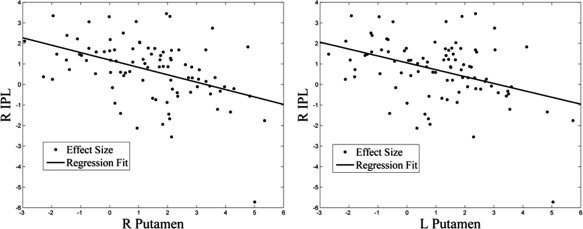
Linear correlation of preparatory motor activity in bilateral putamen and preparatory inhibitory activity in the right inferior parietal lobule (IPL) across subjects. Each data point represented one subject (n = 91).
Interaction of Preparatory Activity and SSRT
Individuals with short SSRT showed greater preparatory motor inhibition [(SSF>SEF)>(SSG>SEG)]Short > [(SSF>SEF) >(SSG>SEG)]Long in the right orbital frontal cortex (OFC, x = 45, y = 32, z = −11, Z = 3.21, p fwe = 0.003, cluster size = 2), compared with those with long SSRT (see Fig. 6). Individuals with short and long SSRT did not show differences in preparatory motor execution. The effect size of OFC was significantly and negatively correlated with SSRT (r = −0.2316, P = 0.0272).
Figure 6.
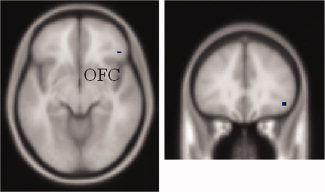
Regional activation of interaction between preparatory control and SSRT. [(SSF>SEF)>(SSG>SEG)]Short > [(SSF>SEF)>(SSG>SEG)]Long showed greater activation in the right orbital frontal cortex (OFC). [Color figure can be viewed in the online issue, which is available at wileyonlinelibrary.com.]
DISCUSSION
This study investigated preparatory processes of motor inhibition and execution during the stop signal task (SST). We modeled the time series separately with the fixation point and go signal onsets for stop success and stop error trials. By comparing the two models we identified regional brain activations related to these preparatory processes.
Preparatory Motor Inhibition
The contrast (SSF>SEF)>(SSG>SEG) revealed activation in the right prefrontal cortex (PFC) and inferior parietal lobules (IPL), suggesting a role of these structures in preparatory motor inhibition. These preparatory inhibitory activities were differentially associated with stop success and stop error. The current findings thus extended Chikazoe et al. [ 2009] and Jaffard et al. [ 2008] by confirming that these preparatory inhibitory activities are explicitly related to behavioral outcomes.
The right dorsal PFC and IPL, together as parts of the fronto‐parietal network, were shown to be involved in mediating top‐down attentional control [Corbetta and Shulman, 2002; Miller and Cohen, 2001; Sakai and Passingham, 2003]. Activation in the dorsal PFC has been reported in top‐down attentional control in various cognitive tasks that required sustained attention [Buschman and Miller, 2007; Wilkins et al., 1987], inhibition [Fassbender et al., 2006; Hester et al., 2004], and perceptual/visual attention shifting [Coull et al., 2000; Robbins, 2007]. Using the same SST, our previous study revealed greater activation in the right PFC during stop success than stop error trials, suggesting its importance in attentional control [Li et al., 2006b]. Our current study hence extended the function of the right PFC; attentional control was in place as early as during the preparatory period in the SST.
Our results were also consistent with the finding of greater IPL activation during no‐cued (inhibition in place) than cued (inhibition released) trials as reported in Jaffard et al. [ 2008]. In a visual‐cuing experiment, IPL was activated during cue but not target presentation, indicating its role in top‐down attentional control [Hopfinger et al., 2000]. Corbetta and Shulman [ 2002] showed that activation of bilateral ventral IPL's predicts attention to cue location during the pre‐cueing period in visual perception tasks. Taken together, the PFC and IPL activation in the current study may suggest allocation of attention to the stop signal during preparatory motor inhibition.
Preparatory Motor Execution
We observed greater activation in bilateral putamen, primary motor cortices (PMC), posterior cingulate cortex (PCC), ventromedial prefrontal cortex (VMPFC), and superior temporal/intraparietal sulci (STS/IPS) during preparatory motor preparation. In particular, the effect size of preparatory motor activities in several structures including the putamen and STS/IPS was inversely correlated with preparatory inhibitory activities of the PFC and IPL, indicating an interaction between these two processes [Boucher et al., 2007; Schall and Boucher, 2007]. This finding supported a recent computational neuronal model showing that the go and stop processes interact early during the preparatory period [Lo et al., 2009].
The activation in bilateral putamen and PMC are consistent with numerous previous studies implicating these structures in movement preparation [Hauber, 1998; Marchand et al., 2008; Tanji and Mushiake, 1996]. For instance, in unit recordings of monkeys, Alexander and Crutcher [ 1990] showed increased neuronal activities in the putamen and PMC before stimulus presentation that signaled a hand movement. Jaeger et al. [ 1993] identified different sets of neurons in the basal ganglia for different aspects of motor preparation (e.g., movement direction and amplitude) and suggested that motor preparation is processed simultaneously in different areas in the basal ganglia. In an fMRI study of humans comparing self‐initiated and externally cued movements, Wiese et al. [ 2004] reported greater activation in the putamen for self‐initiated hand movements.
It is well known that the PMC is involved in movement preparation and execution [Alexander and Crutcher, 1990; Michelon et al., 2006; Zang et al., 2003]. In an fMRI study of delayed sequential movements, Cui et al. [ 2000] reported activation of bilateral PMC in movement preparation with weaker activation in the ipsilateral than contralateral brain. In another study, transcranial magnetic stimulation of the PMC disrupted memory consolidation for movement preparation but not execution in the ipsilateral hand, suggesting a necessary role of the PMC for movement preparation in the ipsilateral effectors [Cohen and Poldrack, 2008]. Consistent with these results, the bilateral PMC activation in our study indicates its involvement in preparatory motor execution.
Activation in the putamen during motor preparation is consistent with the formulation of direct and indirect pathways in motor control, in which the putamen facilitates movement execution [Afifi, 2003; Alexander and Crutcher, 1990; DeLong and Wichman, 2007]. A recent study employing a variant of the SST suggested that the putamen is involved in response inhibition, thus seemingly inconsistent with the current findings [Zandbelt and Vink, 2010]. In the latter study, participants responded in order to “arrest” a moving bar at a target position but had to withhold the response if the bar stopped moving automatically. By contrasting stop success and stop error trials, the investigators observed greater activation in the inferior parietal lobules and midde/inferior/orbital frontal gyri as well as the putamen. Moreover, activation of the putamen increased for trials with greater probability of a stop signal. While greater activation of the frontal and parietal regions, presumably reflecting increased signal monitoring, were observed in many previous studies [Hampshire et al., 2009, 2010; Leung and Cai, 2007; Li et al., 2006b, 2009; Rubia et al., 2001; Sharp et al., 2010], the findings of putamen activation warranted new considerations. The putamen responds to smooth pursuit eye movement and imagery of motion stimuli [Kimming et al., 2008; Kovács et al., 2008; Li, 2000; Lynch, 2009; Previc et al., 2000]. Thus, one possibility is that, in this stop signal task, stop success trials involved greater monitoring of the eye movement that persued the visual stimulus than stop error trials required. These considerations suggest that the roles of basal ganglia in motor control need to be investigated beyond the conceptual framework of direct/indirect pathways [Li et al., 2008c; Marchand, 2010; Marchand et al., 2007, 2008].
Another area associated with preparatory motor execution is the posterior ascending segment of superior temporal/intraparietal sulci (STS/IPS). The STS is involved in a number of different cognitive functions including preparation for pointing movements [Astafiev et al., 2003; see review in Hein and Knight, 2008]. The IPS is known to mediate motor intention [Snyder et al., 1997, 1998] and encode cognitive sets [Stoet and Snyder, 2004]. Neurophysiological studies on monkeys suggested that the posterior parietal cortex integrates sensorimotor information for visuo‐motor coordination [Hinkley et al., 2009] and for motor selection and planning [Cui and Andersen, 2007]. In humans, this multisensory integration is critical in early movement planning [Andersen and Buneo, 2002]. Therefore, the STS/IPS activation during preparatory motor execution is consistent with their roles in movement planning.
A few other brain regions including the PCC and VMPFC also showed preparatory motor activities. However, unlike the putamen and STS/IPS, these activities were largely not significantly correlated with preparatory inhibitory activities of the right PFC and IPL, suggesting a less specific function in determining stop signal inhibition. Greater PCC activation during preparatory motor execution is consistent with its role in sensory‐motor integration in animals (e.g. Dean and Platt, 2006; Olson and Musil, 1992] and in humans [Antal et al., 2008]. A recent fMRI study of golf performance showed greater activation in the PCC before club swing in novices than in professional golfers, indicating its contribution to motor planning for complex tasks without intensive practice [Milton et al., 2007]. An earlier study in healthy adults using an attentional detection task showed that PCC activity was correlated inversely with go reaction time, suggesting a cue‐induced anticipatory bias [Mesulam et al., 2001]. Moreover, PCC and VMPFC activation predicted stop errors, as compared with stop successes, in the same SST [Li et al., 2007]. Taken together, the PCC and VMPFC activation could reflect the preparation with a bias towards making a movement.
Interaction of Preparatory Activity and SSRT
Individuals with short SSRT showed greater activation in the right orbital frontal cortex (OFC) during preparatory motor inhibition, compared to those with long SSRT. Our previous studies of functional connectivity during stop signal performance suggested that the right OFC plays a role in attentional monitoring in the process of response inhibition [Duann et al., 2009; see also Hampshire et al., 2010; Sharp et al., 2010]. More recently, in an independent component analysis, we showed that the right fronto‐parietal network including the OFC is primarily responsible for attentional allocation to the stop signal to expedite response inhibition [Zhang and Li, 2011]. Therefore, the finding of greater activation in the right OFC may suggest superiority of attentional/inhibitory control during the preparatory period in subjects with short SSRT.
CONCLUSION
With a novel contrast, we identified neural processes of preparatory control for motor inhibition and execution in the stop signal task. In confirmation of our hypothesis, preparatory motor inhibition activated structures known to control attention while inhibiting movement; motor preparation engaged the cortical and subcortical brain regions where neurons show motor planning activities. In particular, the extents of preparatory inhibition and execution were negatively correlated across subjects, suggesting a mutual inhibition of the go and stop processes before signal onsets. These findings extended the literature of stop signal task which has heretofore focused on signal‐elicited processes and confirmed the importance of top‐down control of stop signal inhibition.
Supporting information
Additional Supporting Information may be found in the online version of this article.
Supplementary Tables and Figure.
Acknowledgements
The authors thank Dr. Alissa Winkler, Dr. Jaime Ide, Dr. Sheng Zhang, Olivia Hendrick, Sarah Bednarski, and Emily Erdman for their many helpful discussions.
REFERENCES
- Alexander GE, Crutcher MD ( 1990): Preparation for movement: Neural representations of intended direction in three motor areas of the monkey. J Neurophysiol 64: 133–150. [DOI] [PubMed] [Google Scholar]
- Andersen RA, Buneo CA ( 2002): Intentional maps in posterior parietal cortex. Annu Rev Neurosci 25: 189–220. [DOI] [PubMed] [Google Scholar]
- Antal A, Baudewig J, Paulus W, Dechent P ( 2008): The posterior cingulate cortex and planum temporale/parietal operculum are activated by coherent visual motion. Visual Neurosci 25: 17–26. [DOI] [PubMed] [Google Scholar]
- Ashburner J, Friston KJ ( 1999): Nonlinear spatial normalization using basis functions. Hum Brain Mapp 7: 254–266. [DOI] [PMC free article] [PubMed] [Google Scholar]
- Astafiev SV, Shulman GL, Stanley CM, Snyder AZ, Van Essen DC, Corbetta M ( 2003): Functional organization of human intraparietal and frontal cortex for attending, looking, and pointing. J Neurosci 23: 4689–4699. [DOI] [PMC free article] [PubMed] [Google Scholar]
- Ballanger B ( 2009): Top‐down control of saccades as part of a generalized model of proactive inhibitory control. J Neurophysiol 102: 2578–2580. [DOI] [PubMed] [Google Scholar]
- Boucher L, Palmeri TJ, Logan GD, Schall JD ( 2007): Inhibitory control in mind and brain: An interactive race model of countermanding saccades. Psychol Rev 114: 376–397. [DOI] [PubMed] [Google Scholar]
- Büchel C, Wise RJ, Mummery CJ, Poline JB, Friston KJ ( 1996): Nonlinear regression in parametric activation studies. Neuroimage 4: 60–66. [DOI] [PubMed] [Google Scholar]
- Büchel C, Holmes AP, Rees G, Friston KJ ( 1998): Characterizing stimulus‐response functions using nonlinear regressors in parametric fMRI experiments. Neuroimage 8: 140–148. [DOI] [PubMed] [Google Scholar]
- Buschman TJ, Miller EK ( 2007): Top‐down versus bottom‐up control of attention in the prefrontal and posterior parietal cortices. Science 315: 1860–1862. [DOI] [PubMed] [Google Scholar]
- Chikazoe J, Jimura K, Hirose S, Yamashita K, Miyashita Y, Konishi S ( 2009): Preparation to inhibit a response complements response inhibition during performance of a stop‐signal task. J Neurosci 29: 15870–15877. [DOI] [PMC free article] [PubMed] [Google Scholar]
- Cohen MS ( 1997): Parametric analysis of fMRI data using linear systems methods. Neuroimage 6: 93–103. [DOI] [PubMed] [Google Scholar]
- Cohen JR, Poldrack RA ( 2008): Automaticity in motor sequence learning does not impair response inhibition. Psychon Bull Rev 15: 108–115. [DOI] [PubMed] [Google Scholar]
- Corbetta M, Shulman GL ( 2002): Control of goal‐directed and stimulus‐driven attention in the brain. Nat Rev Neurosci 3: 201–215. [DOI] [PubMed] [Google Scholar]
- Coull JT, Frith CD, Buchel C, Nobre AC ( 2000): Orienting attention in time: behavioral and neuroanatomical distinction between exogenous and endogenous shifts. Neuropsychologia 38: 808–819. [DOI] [PubMed] [Google Scholar]
- Cui H, Andersen RA ( 2007): Posterior parietal cortex encodes autonomously selected motor plans. Neuron 56: 552–559. [DOI] [PMC free article] [PubMed] [Google Scholar]
- Cui SZ, Li EZ, Zang YF, Weng XC, Ivry R, Wang JJ ( 2000): Both sides of human cerebellum involved in preparation and execution of sequential movements. Neuroreport 11: 3849–3853. [DOI] [PubMed] [Google Scholar]
- Dean HL, Platt ML ( 2006): Allocentric spatial referencing of neuronal activity in macaque posterior cingulate cortex. J Neurosci 26: 1117–1127. [DOI] [PMC free article] [PubMed] [Google Scholar]
- Della‐Maggiore V, Chan W, Peres‐Neto PR, McIntosh AR ( 2002): An empirical comparison of SPM preprocessing parameters to the analysis of fMRI data. Neuroimage 17: 19–28. [DOI] [PubMed] [Google Scholar]
- Duann JR, Ide JS, Luo X, Li CSR ( 2009): Functional connectivity delineates distinct roles of the inferior frontal cortex and presupplementary motor area in stop signal inhibition. J Neurosci 29: 10171–10179. [DOI] [PMC free article] [PubMed] [Google Scholar]
- Everling S, Munoz DP ( 2000): Neuronal correlates for preparatory set associated with pro‐saccades and anti‐saccades in the primate frontal eye field. J Neurosci 20: 387–400. [DOI] [PMC free article] [PubMed] [Google Scholar]
- Fassbender C, Simoes‐Franklin C, Murphy K, Hester R, Meaney J, Robertson IH, Garavan H ( 2006): The role of a right fronto‐parietal network in cognitive control. J Psychophsiol 20: 286–296. [Google Scholar]
- Friston K, Holmes AP, Worsley KJ, Poline JB, Frith CD, Frackowiak R. ( 1995a): Statistical parametric maps in functional imaging: A general linear approach. Hum Brain Mapp 2: 189–210. [Google Scholar]
- Friston KJ, Ashburner J, Frith CD, Poline JB, Heather JD, Frackowiak RSJ ( 1995b): Spatial registration and normalization of images. Hum Brain Mapp 3: 165–189. [Google Scholar]
- Friston KJ, Josephs O, Zarahn E, Holmes AP, Rouquette S, Poline JB ( 2000): To smooth or not to smooth? Bias and efficiency in fMRI time‐series analysis. Neuroimage 12: 196–208. [DOI] [PubMed] [Google Scholar]
- Genovese CR, Lazar NA, Nichols T ( 2002): Thresholding of statistical maps in functional neuroimaging using the false discovery rate. Neuroimage 15: 870–878. [DOI] [PubMed] [Google Scholar]
- Glascher J, Gitelman D ( 2008): Contrast weights in flexible factorial design with multiple groups of subjects. Unpublished tutorial (http://www.jiscmail.ac.uk/cgi-bin/webadmin?A2=ind0803&L=SPM&P=R16629).
- Hampshire A, Chamberlain SR, Monti MM, Duncan J, Owen AM ( 2010): The role of the right inferior frontal gyrus: Inhibition and attentional control. Neuroimage 50: 1313–1319. [DOI] [PMC free article] [PubMed] [Google Scholar]
- Hampshire A, Thompson R, Duncan J, Owen AM ( 2009): Selective tuning of the right inferior frontal gyrus during target detection. Cogn Affect Behav Neurosci 9: 103–112. [DOI] [PMC free article] [PubMed] [Google Scholar]
- Hauber W ( 1998): Involvement of basal ganglia transmitter systems in movement initiation. Prog Neurobiol 56: 507–540. [DOI] [PubMed] [Google Scholar]
- Hein G, Knight RT ( 2008): Superior temporal sulcus—It's my area: Or is it? J Cogn Neurosci 20: 2125–2136. [DOI] [PubMed] [Google Scholar]
- Hester RL, Murphy K, Foxe JJ, Foxe DM, Javitt DC, Garavan H ( 2004): Predicting success: Patterns of cortical activation and deactivation prior to response inhibition. J Cogn Neurosci 16: 776–785. [DOI] [PubMed] [Google Scholar]
- Hinkley LBN, Krubitzer LA, Padberg J, Disbrow EA ( 2009): Visual‐manual exploration and posterior parietal cortex in humans. J Neurophysiol 102: 3433–3446. [DOI] [PMC free article] [PubMed] [Google Scholar]
- Hopfinger JB, Buonocore MH, Mangun GR ( 2000): The neural mechanisms of top‐down attentional control. Nat Neurosci 3: 284–291. [DOI] [PubMed] [Google Scholar]
- Huettel SA, McCarthy G ( 2000): Evidence for a refractory period in the hemodynamic response to visual stimuli as measured by MRI. Neuroimage 11: 547–553. [DOI] [PubMed] [Google Scholar]
- Huettel SA, McCarthy G ( 2001): Regional differences in the refractory period of the hemodynamic response: An event‐related fMRI study. Neuroimage 14: 967–976. [DOI] [PubMed] [Google Scholar]
- Huettel SA, Song AW, McCarthy G ( 2009): Functional Magnetic Resonance Imaging. New York: Sinauer Associates. [Google Scholar]
- Jaeger D, Gilman S, Aldridge JW ( 1993): Primate basal ganglia activity in a precued reaching task: Preparation for movement. Exp Brain Res 95: 51–64. [DOI] [PubMed] [Google Scholar]
- Jaffard M, Longcamp M, Velay JL, Anton JL, Roth M, Nazarian B, Boulinguez P ( 2008): Proactive inhibitory control of movement assessed by event‐related fMRI. Neuroimage 42: 1196–1206. [DOI] [PubMed] [Google Scholar]
- Johnston K, Levin HM, Koval MJ, Everling S ( 2007): Top‐down control‐signal dynamics in anterior cingulate and prefrontal cortex neurons following task switching. Neuron 53: 453–462. [DOI] [PubMed] [Google Scholar]
- Kimmig H, Ohlendorf S, Speck O, Sprenger A, Rutschmann RM, Haller S, Greenlee MW ( 2008): fMRI evidence for sensorimotor transformations in human cortex during smooth pursuit eye movements. Neuropsychologia 46: 2203–2213. [DOI] [PubMed] [Google Scholar]
- Kovács G, Raabe M, Greenlee MW ( 2008): Neural correlates of visually induced self‐motion illusion in depth. Cereb Cortex 18: 1779–1787. [DOI] [PubMed] [Google Scholar]
- Leung HC, Cai W ( 2007): Common and differential ventrolateral prefrontal activity during inhibition of hand and eye movements. J Neurosci 27: 9893–9900. [DOI] [PMC free article] [PubMed] [Google Scholar]
- Levitt H ( 1971): Transformed up‐down methods in psychoacoustics. J Acoust Soc Am 49: 467–477. [PubMed] [Google Scholar]
- Li CSR ( 2000): Impairment of motor imagery in putamen lesions in humans. Neurosci Lett 287: 13–16. [DOI] [PubMed] [Google Scholar]
- Li CSR, Huang C, Constable RT, Sinha R. ( 2006a): Gender differences in the neural correlates of response inhibition during a stop signal task. Neuroimage 32: 1918–1929. [DOI] [PubMed] [Google Scholar]
- Li CSR, Huang C, Constable RT, Sinha R ( 2006b): Imaging response inhibition in a stop‐signal task: Neural correlates independent of signal monitoring and post‐response processing. J Neurosci 26: 186–192. [DOI] [PMC free article] [PubMed] [Google Scholar]
- Li CSR, Huang C, Yan P, Paliwal P, Constable RT, Sinha R ( 2008a): Neural correlates of post‐error slowing during a stop signal task: A functional magnetic resonance imaging study. J Cogn Neurosci 20: 1021–1029. [DOI] [PMC free article] [PubMed] [Google Scholar]
- Li CSR, Yan P, Bergquist KL, Sinha R ( 2007): Greater activation of the “default” brain regions predicts stop signal errors. Neuroimage 38: 640–648. [DOI] [PMC free article] [PubMed] [Google Scholar]
- Li CSR, Yan P, Chao HHA, Sinha R, Paliwal P, Constable RT, Zhang S, Lee TW ( 2008b): Error‐specific medial cortical and subcortical activity during the stop signal task: A functional magnetic resonance imaging study. Neuroscience 155: 1142–1151. [DOI] [PMC free article] [PubMed] [Google Scholar]
- Li CSR, Yan P, Sinha R, Lee TW ( 2008c): Subcortical processes of motor response inhibition during a stop signal task. Neuroimage 41: 1352–1363. [DOI] [PMC free article] [PubMed] [Google Scholar]
- Li CSR, Zhang S, Duann JR, Yan P, Sinha R, Mazure CM ( 2009): Gender differences in cognitive control: An extended investigation of the stop signal task. Brain Imaging Behav 3: 262–276. [DOI] [PMC free article] [PubMed] [Google Scholar]
- Lo CC, Boucher L, Pare M, Schall JD, Wang XJ ( 2009): Proactive inhibitory control and attractor dynamics in countermanding action: A spiking neural circuit model. J Neurosci 29: 9059–9071. [DOI] [PMC free article] [PubMed] [Google Scholar]
- Logan GD, Cowan WB ( 1984): On the ability to inhibit thought and action: A theory of an act of control. Psychol Rev 91: 295–327. [DOI] [PubMed] [Google Scholar]
- Logan GD, Cowan WB, Davis KA ( 1984): On the ability to inhibit simple and choice reaction‐time responses: A model and a method. J Exp Psychol Human 10: 276–291. [DOI] [PubMed] [Google Scholar]
- Lynch JC ( 2009): Pursuit eye movement signals in the basal ganglia. Neuroreport 20: 103–104. [DOI] [PubMed] [Google Scholar]
- Marchand WR ( 2010): Cortico‐basal ganglia circuitry: A review of key research and implications for functional connectivity studies of mood and anxiety disorders. Brain Struct Funct 215: 73–96. [DOI] [PubMed] [Google Scholar]
- Marchand WR, Lee JN, Thatcher JW, Hsu EW, Rashkin E, Suchy Y, Chelune G, Starr J, Barbera SS ( 2008): Putamen coactivation during motor task execution. Neuroreport 19: 957–960. [DOI] [PubMed] [Google Scholar]
- Marchand WR, Lee JN, Thatcher JW, Thatcher GW, Jensen C, Starr J ( 2007): Motor deactivation in the human cortex and basal ganglia. Neuroimage 38: 538–548. [DOI] [PubMed] [Google Scholar]
- Mesulam MM, Nobre AC, Kim YH, Parrish TB, Gitelman DR ( 2001): Heterogeneity of cingulate contributions to spatial attention. Neuroimage 13: 1065–1072. [DOI] [PubMed] [Google Scholar]
- Michelon P, Vettel JM, Zacks JM ( 2006): Lateral somatotopic organization during imagined and prepared movements. J Neurophysiol 95: 811–822. [DOI] [PubMed] [Google Scholar]
- Miller EK, Cohen JD ( 2001): An integrative theory of prefrontal cortex function. Annu Rev Neurosci 24: 16–7202. [DOI] [PubMed] [Google Scholar]
- Milton J, Solodkin A, Hlustik P, Small SL ( 2007): The mind of expert motor performance is cool and focused. Neuroimage 35: 804–813. [DOI] [PubMed] [Google Scholar]
- Narayanan NS, Laubach M ( 2009): Delay activity in rodent frontal cortex during a simple reaction time task. J Neurophysiol 101: 2859–2871. [DOI] [PMC free article] [PubMed] [Google Scholar]
- Olson CR, Musil SY ( 1992): Topographic organization of cortical and subcortical projections to posterior cingulate cortex in the cat: Evidence for somatic, ocular, and complex subregions. J Comp Neurol 324: 237–260. [DOI] [PubMed] [Google Scholar]
- Previc FH, Liotti M, Blakemore C, Beer J, Fox P ( 2000): Functional imaging of brain areas involved in the processing of coherent and incoherent wide field‐of‐view visual motion. Exp Brain Res 131: 393–405. [DOI] [PubMed] [Google Scholar]
- Robbins TW ( 2007): Shifting and stopping: Fronto‐striatal substrates, neurochemical modulation and clinical implications. Philos Trans R Soc Lond B Biol Sci 362: 917–932. [DOI] [PMC free article] [PubMed] [Google Scholar]
- Rubia K, Russell T, Overmeyer S, Brammer MJ, Bullmore ET, Sharma T, Simmons A, Williams SC, Giampietro V, Andrew CM, Taylor E ( 2001): Mapping motor inhibition: Conjunctive brain activations across different versions of go/no‐go and stop tasks. Neuroimage 13: 250–261. [DOI] [PubMed] [Google Scholar]
- Rushworth MFS, Johansen‐Berg H, Gobel SM, Devlin JT ( 2003): The left parietal and premotor cortices: Motor attention and selection. Neuroimage 20: S89–S100. [DOI] [PubMed] [Google Scholar]
- Sakai K, Passingham RE ( 2003): Prefrontal inetractions reflect future task operations. Nature Neurosci 6: 75–81. [DOI] [PubMed] [Google Scholar]
- Schall JD, Boucher L ( 2007): Executive control of gaze by the frontal lobes. Cogn Affect Behav Neurosci 7: 396–412. [DOI] [PubMed] [Google Scholar]
- Sharp DJ, Bonnelle V, De Boissezon X, Beckmann CF, James SG, Patel MC, Mehta MA ( 2010): Distinct frontal systems for response inhibition, attentional capture, and error processing. Proc Natl Acad Sci USA 107: 6106–6111. [DOI] [PMC free article] [PubMed] [Google Scholar]
- Snyder LH, Batista AP, Andersen RA ( 1997): Coding of intention in the posterior parietal cortex. Nature 386: 167–170. [DOI] [PubMed] [Google Scholar]
- Snyder LH, Batista AP, Andersen RA ( 1998): Change in motor plan, without a change in the spatial locus of attention, modulates activity in posterior parietal cortex. J Neurophysiol 79: 2814–2819. [DOI] [PubMed] [Google Scholar]
- Soon CS, Venkatraman V, Chee MWL ( 2003): Stimulus repetition and hemodynamic response refractoriness in event‐related fMRI. Hum Brain Mapp 20: 1–12. [DOI] [PMC free article] [PubMed] [Google Scholar]
- Stoet G, Snyder LH ( 2004): Single neurons in posterior parietal cortex of monkeys encode cognitive set. Neuron 42: 1003–1012. [DOI] [PubMed] [Google Scholar]
- Stuphorn V, Brown JW, Schall JD ( 2010): Role of supplementary eye field in saccade initiation: Executive, not direct, control. J Neurophysiol 103: 801–816. [DOI] [PMC free article] [PubMed] [Google Scholar]
- Tanji J, Mushiake H ( 1996): Comparison of neuronal activity in the supplementary motor area and primary motor cortex. Brain Res Cogn Brain Res 3: 143–150. [DOI] [PubMed] [Google Scholar]
- Tunik E, Houk JC, Grafton ST ( 2009): Basal ganglia contribution to the initiation of corrective submovements. Neuroimage 47: 1757–1766. [DOI] [PMC free article] [PubMed] [Google Scholar]
- Thoenissen D, Zilles K, Toni I ( 2002): Differential involvement of parietal and precentral regions in movement preparation and motor intention. J Neurosci 22: 9024–9034. [DOI] [PMC free article] [PubMed] [Google Scholar]
- Verbruggen F, Logan GD ( 2008): Response inhibition in the stop‐signal paradigm. Trends Cogn Sci 12: 418–424. [DOI] [PMC free article] [PubMed] [Google Scholar]
- Wetheril GB, Chen H, Vasudeva RB ( 1966): Sequential estimation of quantal response curves—A new method of estimation. Biometrika 53: 439–454. [Google Scholar]
- Wiese H, Stude P, Nebel K, de Greiff A, Forsting M, Diener HC, Keidel M ( 2004): Movement preparation in self‐initiated versus externally triggered movements: an event‐related fMRI‐study. Neurosci Lett 371( 2‐3): 220–225. [DOI] [PubMed] [Google Scholar]
- Wilkins AJ, Shallice T, McCarthy R ( 1987): Frontal lesions and sustained attention. Neuropsychologia 25: 359–365. [DOI] [PubMed] [Google Scholar]
- Zandbelt BB, Vink M ( 2010): On the role of the striatum in response inhibition. PLoS One 5: e13848. [DOI] [PMC free article] [PubMed] [Google Scholar]
- Zang Y, Jia F, Weng X, Li E, Cui S, Wang Y, Hazeltine E, Ivry R ( 2003): Functional organization of the primary motor cortex characterized by event‐related fMRI during movement preparation and execution. Neurosci Lett 337: 69–72. [DOI] [PubMed] [Google Scholar]
- Zhang S, Li CSR (2011): Functional networks for cognitive control in a stop signal task: Independent component analysis. Hum Brain Mapp Mar 1. doi: 10.1002/hbm.21197. [Epub ahead of print]. [DOI] [PMC free article] [PubMed] [Google Scholar]
Associated Data
This section collects any data citations, data availability statements, or supplementary materials included in this article.
Supplementary Materials
Additional Supporting Information may be found in the online version of this article.
Supplementary Tables and Figure.