

Abstract
Recent advances in non-invasive neuroimaging have enabled the measurement of connections between distant regions in the living human brain, thus opening up a new field of research: Human connectomics. Different imaging modalities allow the mapping of structural connections (axonal fiber tracts) as well as functional connections (correlations in time series), and individual variations in these connections may be related to individual variations in behaviour and cognition. Connectivity analysis has already led to several important advances. Segregated brain regions may be identified by their unique patterns of connectivity, structural and functional connectivity may be compared to elucidate how dynamic interactions arise from the anatomical substrate, and the architecture of large-scale networks connecting sets of brain regions may be analyzed in detail. The combination of structural and functional connectivity has begun to reveal key patterns of human brain organization, such as the existence of distinct modules or sub-networks that become engaged in different cognitive tasks. Collectively, advances in human connectomics open up the possibility of studying how brain connections mediate regional brain function and thence behaviour.
Keywords: Neuroimaging, Network, Neuroanatomy, Connectome, Diffusion Imaging, fMRI, Resting-State
Introduction
The principal goal of connectomics is the comprehensive mapping and analysis of brain connectivity, across all scales, from the micro-scale of individual synaptic connections between neurons to the macro-scale of brain regions and interregional pathways [1]. The nascent field of macro-connectomics, at first glance, shares little but a name with its microscopic cousin. Instead of building maps of neural circuits that are detailed enough to include every axonal connection, macro-connectomics attempts to map brain connections at the largest scale. In doing so, it bridges two influential ideas in systems neuroscience [2]. Functional specialisation considers large regions of the brain’s grey matter as individual units that become engaged in different functional contexts; and functional integration considers how such brain regions interact and influence one-another to produce coherent experiences and behaviour (e.g. [3,4]). It is this systems-level understanding of neural processing that has most to benefit from macro-connectomics, which aims to provide systematic approaches both for identifying functional sub-units, and for mapping the connections between them.
Invasive techniques for localising brain regions and tracing anatomical connections have existed for many decades. Tracers are injected into a candidate brain region, taken up inside cells and transported along the axon. Post-mortem histological staining then reveals the distribution of the labelled axons and their connections with distant cells. Tracer techniques are exquisitely precise and accurate. Using different tracers, experimenters may specifically map connections travelling in different pathways or emerging from different cell types or layers. Using viral tracers, monosynaptic or multi-synaptic connections may be selectively labelled. Recent advances have been directed at detailed and accurate quantification of the density of regional brain connections [5,6].
By comparison, presently available techniques for measuring brain connections non-invasively are based on a process of inference – their estimation is indirect; they can be difficult to interpret quantitatively; and they continue to be error-prone. However, their non-invasive nature and ease of measurement permit us to address scientific questions that cannot be answered by any other means. In particular, brain connections can be measured in living human subjects, and measurements can be made simultaneously across the entire brain, thus permitting the creation of a comprehensive whole-brain connection map, the connectome. Hence, areal connections may be compared in humans across individuals and across many cortical and sub-cortical sites, allowing detailed studies of connectional organisation and individual differences. Furthermore, these techniques enable direct investigation of the common rationale that underlies the study of brain circuitry at any scale – the assumed importance of connectional architecture for functional processing and thence behaviour. Using in vivo techniques, this dependence may be tested directly, by comparing structural connectivity to measurements of regional activations and interregional correlations (functional connectivity). Furthermore, variations in anatomical or functional connectivity across the population may be related to variations in behavioural abilities[7].
In this review, we survey the current state-of-the-art in human connectomics, including a comparison of techniques for mapping brain connectivity, the use of connectivity data to discern functionally specialized regions, the relation of structural to functional connections, and the use of network analysis measures to quantitatively characterize the architecture of the human connectome.
Measuring regional brain connections in the living human brain
There are two common approaches for mapping inter-regional connections in-vivo. They both use Magnetic Resonance Imaging (MRI), but rely on very different principles. Diffusion tractography aims to infer the tracks of axon bundles millimetre-by-millimetre as they traverse the brain’s white matter. By contrast, resting state functional MRI measures spontaneous fluctuations in the blood-oxygenation-level-dependent (BOLD) signal in grey matter regions and estimates statistical dependencies between these BOLD time series, usually expressed as cross-correlations.
Diffusion tractography
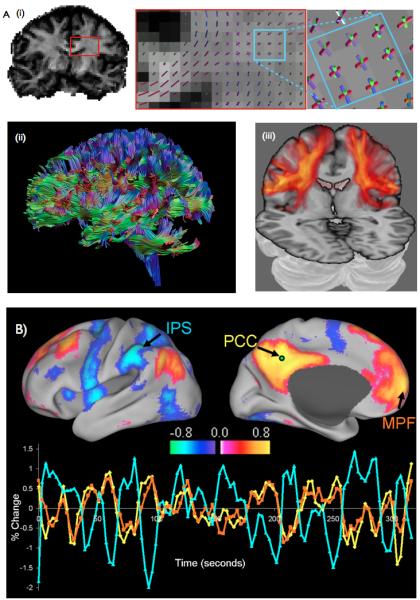
Central to all diffusion tractography studies is the anisotropic diffusion of water in and around axons. Whilst freely diffusing molecules will diffuse equally in all directions, the presence of semi-permeable boundaries in tissue may hinder diffusion along some orientations but not others. In brain white matter, axonal membranes and myelin sheaths hinder diffusion perpendicular to the axon [8], leaving diffusion fastest along the axon. This orientational dependence of diffusion is termed anisotropy. Using diffusion-weighted MRI, we can measure this anisotropy and the peak diffusion orientations in each imaging voxel [9] [10] [11] [12] (Fig. 1). However, such voxels cover cubes of tissue around 1.5×1.5×1.5mm3, each potentially containing tens of thousands of axons. The diffusion orientations we measure therefore relate to the orientations of bundles of coherently oriented axons passing through the voxel. By tracing these orientations voxel-to voxel through the white matter, diffusion tractography reconstructs these bundles and thence interregional connections [13] (Fig. 1).
Figure 1.
Measuring connections in the living human brain
- Measuring anatomical connections with diffusion imaging. (i) A map of diffusion anisotropy (left) reveals the orientational dependence on diffusion in white matter. Insets: The peak orientations of diffusion lie along coherent fibre bundles (middle). Complex fiber crossings can be resolved (right). For example here the corona radiata(blue/purple), callosal projections(red) and the superior longitudinal fasciculus (green) cross in the same voxels. (ii) Determinsitic tractography follows these peak diffusion orientations to reconstruct paths between distant brain regions. Image courtesy of Alexander Leemans. (iii) Probabilistic tractography reveals a distribution of probable connections from a single seed. Here, brighter and more opaque pixels display higher connection probability to ventral parietal region OP4. Image adapted from [17]
- Functional connectivity can be measured using resting fMRI. Here we show two networks whose regions reproducibly exhibit correlated resting activity – the default mode network (red) and the dorsal attention network (blue). Three example timeseries are shown. Medial prefrontal fluctuations (orange) exhibit high correlation with posterior cingulate fluctuations (yellow), but not with intraparietal fluctuations (blue). Image taken from [78].
It is easy to imagine that such a process is prone to error. Fiber bundles may cross, split or merge as they pass through the voxel. Even in parts of white matter where such complexities do not exist, successive measurement errors are compounded along the pathway. In combination, these biological and methodological factors cause spread and uncertainty in the reconstructed fiber trajectories. This spread cannot be captured by deterministic tractography approaches that associate each seed with a single connection. By contrast distributed or probabilistic tractography approaches use sophisticated algorithms to estimate this spread [14] or uncertainty [15,16]. In these techniques each seed is associated not with a single connection, but rather a distribution of connection probabilities to all other brain regions (e.g. [17], Fig. 1).
Nevertheless, direct comparison with invasive studies in non-human primates reveal that, whilst current tractography approaches successfully map many existing connections, they also suffer from both false positive and false negative results [18]. Minimising such errors is a major focus of methodological research in the field. Higher quality data is being acquired using new and more powerful scanners [19], and ingenious scanning strategies that maximise hardware potential (e.g. [20]). Novel algorithms are being developed for reconstructing complex white matter features from the diffusion-weighted signal [21,22] that can be used to inform and constrain tractography solutions [23].
Functional connectivity
Unlike tractography, fMRI connectivity approaches do not attempt to measure brain connections directly. Instead they express connectivity as statistical dependencies between patterns of grey matter activity [24]. At rest, regional brain activity exhibits low frequency oscillations that are correlated across distant brain regions (Fig. 1). Despite the fact that the neural origin of these slow signal fluctuations is still only partially understood [25], resting-state functional connectivity has proven to be extraordinarily informative about brain organization. Regions engaging in coherent oscillations are organised into distinct networks [26,27] that are highly consistent across individuals [28-30]. Nevertheless, inter-individual variability in these functional connections is predictive of genetic variability[31], neurodegeneration [32], and behavioural differences [33]. Notably, the exact same networks can be reconstructed by considering which regions co-activate across thousands of task-related fMRI experiments [34], suggesting that the underlying functional anatomy measured by resting fMRI plays a central role in the task-engaged brain.
Functional connectivity estimates statistical dependencies and thus does not necessarily reflect direct neural interactions along synaptic paths. Correlations can be the result of direct neural interactions mediated by synaptic links or they can be induced between brain regions that do not share a monosynaptic connection, but, for example, are either connected indirectly or receive common input via a third region. Ongoing research provides hope that such ambiguities may be resolved either by examining the covariance structure of many regions simultaneously [35], or by explicit modelling of interregional stochastic dynamics [36].
Connectional anatomy and functional specialisation
Despite these limitations, it is clear that both anatomical and functional connectivity, measured either invasively or by MRI, place strong constraints on regional brain function. When the results of many invasive tracer studies are considered simultaneously [37], it is possible to build “connectional fingerprints” for brain regions that differ in their cellular cytoarchitecture which is assumed to reflect functional divisions. These fingerprints show the pattern of afferent and efferent connections between the candidate and all other brain regions (Fig. 2). Notably, each cytoarchitectonic region has a unique connectional fingerprint [38], suggesting that constraints on regional functional processing derive not only from the cellular, but also the connectional architecture of the local tissue.
Figure 2.
Functional specialisation and connectional architecture.
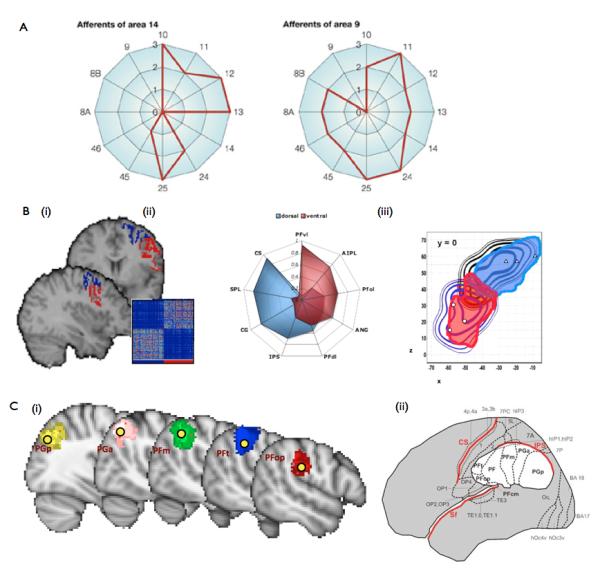
- Invasive tracer studies in macaque monkey reveal that regions defined by their cyto-architecture also differ in their connectivity to other areas. Here we show afferent “connectivity fingerprints” for Walker’s area 9 and 14 in the prefrontal cortex. The two regions receive inputs from a markedly different set of other prefrontal regions. Figure adapted from [38].
- (b) These connectional differences can be used to delineate cortical regions. (i)For example, a sharp change in connectivity exists between dorsal (PMd) and ventral (PMv) regions in lateral premotor cortex. Mathematical clustering techniques can detect these connectional differences (inset), which can be easily seen (ii) in their respective connectivity fingerprints to other cortical regions. (iii) As in similar studies, these connectivity-defined regions (solid regions) align well with delineations made solely on the basis of regional functional properties (contours). Images adapted from[45].
- Connectivity-based parcellation can be applied to large patches of cortex. For example, 10 connectionally distinct regions can be identified in the parietal cortex [47]. Here we show (i) the 5 regions that lie in the inferior parietal lobule alongside (ii) a map of the same region, delineated by post-mortem cyto-architecture [83]. For ease of comparison, centres of gravity of the cytoarchiarchitectonic regions in (ii) are overlaid on the connectionally defined regions in (i). Images adapted from [46] and [79].
Non-invasive techniques can harness these connectional differences to parcellate grey matter into regions of homogeneous connectivity[39]. For example when thalamic voxels are partitioned with tractography into regions connected to different cortical zones, the resulting maps bear striking resemblance to histological maps of thalamic nuclear clusters [40]. These connectivity-defined regions predict the locations within thalamus of fMRI activations for different tasks [41]. For example, across many studies thalamic activations during motor tasks lie within the region of thalamus primarily connected to sensori-motor cortex, whereas executive tasks activate regions of thalamus connected to the prefrontal cortex.
Similar approaches can be taken to subdividing cortical regions [42] but here, in part due to inter-species differences, it may be less clear what target regions will lead to accurate parcellations. Instead, connectivity fingerprints can be calculated from each seed voxel to every other voxel in the brain, and submitted to automated clustering routines [43,44] (Fig. 2). These early studies showed that when small patches of cortex (such as the supplementary and pre-supplementary motor areas) were divided according to their connections, boundaries aligned almost perfectly with those measured using relevant tasks in fMRI [43], with functional meta-analyses [45] or with post-mortem cyto-architecture [44]. Similar techniques have more recently been applied to sub-divide much larger patches of cortex [46,47]. Despite their increased complexity, in each case these cortical parcellations survive careful scrutiny with respect to known functional and cytoarchitectonic subdivisions (Fig 2).
Using similar logic, cortical and subcortical grey matter can also be parcellated according to their patterns of functional connectivity. Indeed, the delineation of SMA and preSMA that provided the first example of parcellation according to anatomical connections [43], can be replicated essentially identically if functional connections are considered instead [48] and again, similar ideas can be used to delineate multiple regional boundaries [49,50]. However, despite their clear similarities functional and structural connectivities have different sensitivities and biases. It is therefore likely that substantial advances in the power and robustness of connectivity-based parcellations will be achieved by algorithms that consider both types of data simultaneously. Using such strategies, researchers hope to be able to provide automated systematic approaches for delineating connectional architecture across the entire brain.
Relating structural to functional connections
The central rationale for human connectomics builds on the premise that structural brain connectivity can serve as a basis for understanding brain dynamics and behaviour. As discussed earlier the two main techniques for measuring regional brain connections are strikingly different both in what they attempt to measure (structural vs functional connections) and in how they measure it. Can the two ways of mapping brain connectivity be interrelated?
A series of convergent studies have reported that patterns of functional connectivity observed during the brain’s resting-state have a structural basis [51-53] (Fig. 3). In non-human primates, where anatomical data from tracer studies is available, the direct comparison between maps of functional correlations and anatomical connections has revealed striking similarities [53,54]. In humans, whole-brain maps of structural and functional connectivity have been compiled from the same cohort of participants, allowing their direct comparison [55-57]. While the strength of structural connectivity was found to be partially predictive of the strength of functional connectivity, the assessment of functional connectivity as simple cross-correlation generally does not allow the inference of underlying structural connections. This asymmetric relationship reinforces the need for the independent assessment of structural connections, for example with the tools of diffusion imaging and tractography.
Figure 3.

Relating structural and functional connectivity.
- Anatomical connectivity, determined from tracer injections, and BOLD cross-correlations, recorded during spontaneous brain activity under anaesthesia, in macaque parietal and frontal cortex. Left panel shows map of retrogradely labelled brain regions after injection into area LIP (lateral intraparietal area). Right panel shows a map of voxels exhibiting BOLD correlations amongst at least 3 out of 4 regions of the monkey oculomotor system (FEF, frontal eye fields; LIP; MT, middle temporal area; MST, middle superior temporal area). AS, arcuate sulcus; CeS, central sulcus; IPS, intraparietal sulcus; SF; sylvian sulcus; STS, superior temporal sulcus. Image adapted from [53].
- Average structural connectivity (SC) and resting-state functional connectivity (rsFC) matrices for 998 randomly partitioned regions of cerebral cortex obtained from diffusion tractography and fMRI recordings of the same cohort of participants [55]. Regions are arranged in a fronto-parietal-temporal gradient (indicated on the left) and connections are displayed for right hemisphere (RH), left hemisphere (LH) and interhemispheric pathways. The scatter plot on the right shows the relation between connection weights in SC and rsFC matrices.
- Upper panels show resting-state functional connectivity in the default mode network, with regions in the posterior cingulate cortex/precuneus (PCC), medial prefrontal cortex (MPFC) and medial temporal lobe (MTL) exhibiting strong functional correlations. Lower panels show two views of diffusion imaging tractography of structural connections linking PCC and MPFC as well as PCC and MPFC in a single subject. Note the absence of direct MPFC/MTL connectivity. Images adapted from [52].
At the level of individual regions and pathways, strong evidence supports the idea that the strengths of functional influences are dependent on the density or efficacy of anatomical connections. For example, individual differences in the anatomical microstructure of the cingulum were found to exhibit a significant correlation with functional connectivity between midline brain regions [58]. Complete sectioning of the corpus callosum, a major tract connecting the two cerebral hemispheres, resulted in an acute and strong reduction of inter-hemispheric functional connectivity [59]. In some cases, measurements of structural connectivity could be directly related to differences in individual performance, as in a recent study of perceptual rivalry [60]. Several indices of gray and white matter structure in the superior parietal lobes predicted individual variability in the rate at which perceptual alternations occurred. Jointly, these studies document a crucial role of brain structure for dynamics and behaviour. The relationship is made even more salient by recent observations indicating that sensory and motor experience can result in structural changes in specific brain circuits [61]. Hence, the connectome is both shaping and shaped by behaviour.
An emerging focus in the analysis of functional connectivity concerns its change across time. Functional couplings between neural elements are increasingly viewed as highly time-dependent – indeed they are known to be powerfully reconfigured by changes in both internal and environmental state. Even patterns of resting-state fMRI cross-correlations estimated from a slow physiological signal over long periods of time can exhibit significant fluctuations [62]. At a faster time scale, electromagnetic recordings reveal rich temporal structure in correlations and coherences across brain regions on time scales of hundreds of milliseconds [63]. Time-varying functional connectivity implies that the set of potential functional connections is far greater and more variable than that of direct structural linkages. Relating specific patterns of structural connectivity to variable and dynamic functional interactions will remain a key challenge for human connectomics, a challenge that can be addressed with the tools and concepts offered by modern network science.
Network analysis and modeling
Brain networks generated by human connectomics studies can be described and modeled with a broad range of network analysis tools [64,65] (Fig. 4), many of which have also been profitably applied in other biological systems. In general, all networks, including those generated from brain data, consist of collections of nodes and edges, usually aggregated in matrix form. In structural brain networks, nodes correspond to neural elements (typically brain regions), and edges define their interconnections (typically interregional pathways). A number of connectome studies have derived such networks from MRI data acquired over large portions of the human brain [18,66,67]. In parallel, significant efforts have been devoted to the development and validation of new analysis tools for brain networks, including some for detecting network hubs [68,69], communities or modules [70], and statistical methods for network comparison [71,72].
Figure 4.

Network analysis of the human connectome.
- Schematic example of a weighted undirected connection matrix and the corresponding graph structure for a small network of 14 nodes. Nodes with high/low degree, high clustering and high centrality are indicated.
- Anatomical distribution of a regionally measured graph metric, the betweenness centrality. Regions that exhibit consistently high centrality across a cohort of participants are labelled, and they are found to be aggregated along the cortical midline, and in parietal and prefrontal cortex. Image adapted from [66].
- Hierarchical modularity in the structural connectivity of human cerebral cortex [55], as revealed by recursive application of a network-based partitioning algorithm. Modules at the largest scale can be further subdivided into nested communities, thus demonstrating that cortical modules extend across multiple scales. Image adapted from [75].
When extracting networks from brain data, key processing steps involve the anatomical definition of nodes and the estimation of edges that capture their mutual structural or functional relationship. Whilst studies that look at patches of cortex may define nodes using the parcellation approaches described above [43] [49], these methods are not yet mature enough to be applied across the entire brain. Node definition therefore remains a significant challenge in whole-brain connectomics. Strategies have varied from looking at the level of single voxels [51], through random parcellations at various levels of granularity[66] , to coarser definitions on the basis of known landmarks or population-based templates[18,67]. The choice of approach is important since comparative analyses have demonstrated that most networks analysis measures are sensitive to different parcellation strategies. For example, network metrics vary significantly across random parcellations that differ in the number of nodes and edges [71], although qualitative features of network architecture generally remain stable [73]. The intrinsic dependence of network measures on network size and density requires that all comparative studies be carried out on a common parcellation, and that network metrics be normalized relative to suitable random models.
While there are as yet no consistent or agreed-upon methods for deriving nodes and edges to assemble human brain networks, numerous studies using a variety of imaging techniques, modalities, parcellation strategies and analysis tools are beginning to converge on some key features of human brain architecture. While early studies focused on demonstrating robust small-world attributes, particularly high local clustering and a short path length [18,66,67], more recent analyses have emphasized local and global efficiency {Achard, 2007 #140}, the detection and hierarchical arrangement of distinct network modules [74,75], and finding highly connected and central hub regions[68]. Clusters or modules are arranged in a nested hierarchy [75] and show significant overlap with known functional subdivisions and neurocognitive networks previously identified in functional studies [29]. Hubs are aggregated in parietal and frontal cortex, with a pronounced tendency for hubs to be interconnected into a structural core [66]. Intriguingly, the human connectome combines high efficiency with low wiring cost, and the cost-efficiency trade-off has recently been shown to constitute a heritable trait [76].
Conclusion
Comprehensive maps of the structural and functional connectivity of the human brain have provided important insights into how anatomical connections shape and constrain brain dynamics, and how this relation varies across individuals. New approaches from network analysis and modelling have begun to reveal some fundamental motifs of human brain architecture and their relation to brain function is a focus of ongoing research. The commencement of several concerted efforts to map the human connectome [77] will likely lead to significant advances in our understanding of human brain connectivity in the near future.
Highlights.
Structural and functional connectivity can be non-invasively measured across the whole human brain
Connectivity patterns of brain regions can aid parcellation and are related to their functional specialization
Structural connectivity partially predicts functional interactions among brain regions
Network analysis of connectome maps reveals high clustering, modules and hubs as major features of brain organization
Acknowledgements
T.B. was supported by The Wellcome Trust, UK Medical Research Council and the EU CONNECT project*. O.S. was supported by the J.S. McDonnell Foundation. Both authors were funded in part by the Human Connectome Project (1U54MH091657-01) from the 16 NIH Institutes and Centers that support the NIH Blueprint for Neuroscience Research
*CONNECT: The project “CONNECT” acknowledges the financial support of the Future and Emerging Technologies (FET) programme within the Seventh Framework Programme for Research of the European Commission, under FET-Open grant number: 238292.
Footnotes
Publisher's Disclaimer: This is a PDF file of an unedited manuscript that has been accepted for publication. As a service to our customers we are providing this early version of the manuscript. The manuscript will undergo copyediting, typesetting, and review of the resulting proof before it is published in its final citable form. Please note that during the production process errors may be discovered which could affect the content, and all legal disclaimers that apply to the journal pertain.
References
- 1.Sporns O, Tononi G, Kotter R. The human connectome: A structural description of the human brain. PLoS Comput Biol. 2005;1:e42. doi: 10.1371/journal.pcbi.0010042. [DOI] [PMC free article] [PubMed] [Google Scholar]
- 2.Zeki S, Shipp S. The functional logic of cortical connections. Nature. 1988;335:311–317. doi: 10.1038/335311a0. [DOI] [PubMed] [Google Scholar]
- 3.Friston KJ. Modalities, modes, and models in functional neuroimaging. Science. 2009;326:399–403. doi: 10.1126/science.1174521. [DOI] [PubMed] [Google Scholar]
- 4.Wilson CR, Gaffan D, Browning PG, Baxter MG. Functional localization within the prefrontal cortex: missing the forest for the trees? Trends Neurosci. 2010;33:533–540. doi: 10.1016/j.tins.2010.08.001. [DOI] [PMC free article] [PubMed] [Google Scholar]
- 5.Wang Q, Gao E, Burkhalter A. Gateways of ventral and dorsal streams in mouse visual cortex. Journal of Neuroscience. 2011;31:1905–1918. doi: 10.1523/JNEUROSCI.3488-10.2011. [DOI] [PMC free article] [PubMed] [Google Scholar]
- 6.Markov NT, Misery P, Falchier A, Lamy C, Vezoli J, Quilodran R, Gariel MA, Giroud P, Ercsey-Ravasz M, Pilaz LJ, et al. Weight consistency specifies regularities of macaque cortical networks. Cereb Cortex. 2011;21:1254–1272. doi: 10.1093/cercor/bhq201. ** An exquisite retrograde tracer study in the visual system shows reproducibility of cortico-cortical connection densities (fraction of labelled neurons) across many orders of magnitude.
- 7.Cohen MX, Schoene-Bake JC, Elger CE, Weber B. Connectivity-based segregation of the human striatum predicts personality characteristics. Nat Neurosci. 2009;12:32–34. doi: 10.1038/nn.2228. * Anatomical brain connections predict individual differences in behaviour. Here ventral striatal connections to hippocampus and amygdala predict novelty seeking behaviour, whereas prefrontal-striatal connections predict reward-dependent behaviour.
- 8.Moseley ME, Cohen Y, Kucharczyk J, Mintorovitch J, Asgari HS, Wendland MF, Tsuruda J, Norman D. Diffusion-weighted MR imaging of anisotropic water diffusion in cat central nervous system. Radiology. 1990;176:439–445. doi: 10.1148/radiology.176.2.2367658. [DOI] [PubMed] [Google Scholar]
- 9.Basser PJ, Mattiello J, LeBihan D. Estimation of the effective self-diffusion tensor from the NMR spin echo. J Magn Reson B. 1994;103:247–254. doi: 10.1006/jmrb.1994.1037. [DOI] [PubMed] [Google Scholar]
- 10.Tuch DS, Reese TG, Wiegell MR, Wedeen VJ. Diffusion MRI of complex neural architecture. Neuron. 2003;40:885–895. doi: 10.1016/s0896-6273(03)00758-x. [DOI] [PubMed] [Google Scholar]
- 11.Jansons KM, Alexander DC. Persistent Angular Structure: new insights from diffusion MRI data. Inf Process Med Imaging. 2003;18:672–683. doi: 10.1007/978-3-540-45087-0_56. [DOI] [PubMed] [Google Scholar]
- 12.Behrens TE, Johansen-Berg H, Jbabdi S, Rushworth MF, Woolrich MW. Probabilistic diffusion tractography with multiple fibre orientations: What can we gain? Neuroimage. 2007;34:144–155. doi: 10.1016/j.neuroimage.2006.09.018. [DOI] [PMC free article] [PubMed] [Google Scholar]
- 13.Basser PJ, Pajevic S, Pierpaoli C, Duda J, Aldroubi A. In vivo fiber tractography using DT-MRI data. Magn Reson Med. 2000;44:625–632. doi: 10.1002/1522-2594(200010)44:4<625::aid-mrm17>3.0.co;2-o. [DOI] [PubMed] [Google Scholar]
- 14.Tournier JD, Calamante F, Gadian DG, Connelly A. Direct estimation of the fiber orientation density function from diffusion-weighted MRI data using spherical deconvolution. Neuroimage. 2004;23:1176–1185. doi: 10.1016/j.neuroimage.2004.07.037. [DOI] [PubMed] [Google Scholar]
- 15.Parker GJ, Haroon HA, Wheeler-Kingshott CA. A framework for a streamline-based probabilistic index of connectivity (PICo) using a structural interpretation of MRI diffusion measurements. J Magn Reson Imaging. 2003;18:242–254. doi: 10.1002/jmri.10350. [DOI] [PubMed] [Google Scholar]
- 16.Behrens T, Woolrich M, Jenkinson M, Johansen-Berg H, Nunes R. Characterization and propagation of uncertainty in diffusion-weighted MR imaging. Magnetic Resonance in Medicine. 2003;50:1077–1088. doi: 10.1002/mrm.10609. al. e. [DOI] [PubMed] [Google Scholar]
- 17.Eickhoff SB, Jbabdi S, Caspers S, Laird AR, Fox PT, Zilles K, Behrens TE. Anatomical and functional connectivity of cytoarchitectonic areas within the human parietal operculum. J Neurosci. 2010;30:6409–6421. doi: 10.1523/JNEUROSCI.5664-09.2010. [DOI] [PMC free article] [PubMed] [Google Scholar]
- 18.Iturria-Medina Y, Sotero RC, Canales-Rodriguez EJ. Studying the human brain anatomical network via diffusion-weighted MRI and graph theory. Neuroimage. 2008;40:1064–1076. doi: 10.1016/j.neuroimage.2007.10.060. al. e. [DOI] [PubMed] [Google Scholar]
- 19.Heidemann RM, Porter DA, Anwander A, Feiweier T, Heberlein K, Knosche TR, Turner R. Diffusion imaging in humans at 7T using readout-segmented EPI and GRAPPA. Magn Reson Med. 2007;64:9–14. doi: 10.1002/mrm.22480. [DOI] [PubMed] [Google Scholar]
- 20.Feinberg D, Moeller S, Smith S, Auerbach E, Ramanna S. Multiplexed echo planar imaging for sub-second whole brain fMRI and fast diffusion imaging. PloS ONE. 2010;5:1–11. doi: 10.1371/journal.pone.0015710. al. e. [DOI] [PMC free article] [PubMed] [Google Scholar]
- 21.Alexander D, Hubbard P, Hall M, Moore E, Ptito M. Orientationally invariant indices of axon diameter and density from diffusion MRI. Neuroimage. 2010;52:1374–1389. doi: 10.1016/j.neuroimage.2010.05.043. al. e. * Novel techniques in diffusion imaging allow measurement of biophysically quantitative measurements, such as axon diameter. Here the technique is applied to humans for the first time.
- 22.Zhang H, Hubbard PL, Parker GJ, Alexander DC. Axon diameter mapping in the presence of orientation dispersion with diffusion MRI. Neuroimage. 2011;56:1301–1315. doi: 10.1016/j.neuroimage.2011.01.084. [DOI] [PubMed] [Google Scholar]
- 23.Sherbondy AJ, Rowe MC, Alexander DC. MicroTrack: An algorithm for concurrent projectome and microstructure estimation. Medical Image Computing and Computer-Assisted Intervention. 2010;13:183–190. doi: 10.1007/978-3-642-15705-9_23. [DOI] [PubMed] [Google Scholar]
- 24.Biswal B, Yetkin FZ, Haughton VM, Hyde JS. Functional connectivity in the motor cortex of resting human brain using echo-planar MRI. Magn Reson Med. 1995;34:537–541. doi: 10.1002/mrm.1910340409. * Resting fMRI connectomes measured in over 1000 individuals and 35 laboratories reveal consistent connectional architecture. Nevertheless, in this exemplar study, variability in quantitative connectivity scores correlate with age and gender. Notably, this is the first of a number of expected projects to make large quantities of connectome data freely available online.
- 25.Scholvinck ML, Maier A, Ye FQ, Duyn JH, Leopold DA. Neural basis of global resting-state fMRI activity. Proc Natl Acad Sci U S A. 2009;107:10238–10243. doi: 10.1073/pnas.0913110107. ** FMRI oscillations exhibit substantial and widespread correlations with invasive measurements of local field potentials.
- 26.Beckmann CF, DeLuca M, Delvin JT, Smith SM. Investigations into resting-state connectivity using independent component analysis. Philosophical Transactions of the Royal Society. 2005;360:1001–1013. doi: 10.1098/rstb.2005.1634. [DOI] [PMC free article] [PubMed] [Google Scholar]
- 27.DeLuca M, Beckmann CF, Stefano ND, Matthews P, Smith S. fMRI resting state networks define distinct modes of long-distance interactions in the human brain. Neuroimage. 2006;29:1359–1367. doi: 10.1016/j.neuroimage.2005.08.035. [DOI] [PubMed] [Google Scholar]
- 28.Damoiseaux JS, Rombouts SA, Barkhof F, Scheltens P, Stam CJ, Smith SM, Beckmann CF. Consistent resting-state networks across healthy subjects. Proc Natl Acad Sci U S A. 2006;103:13848–13853. doi: 10.1073/pnas.0601417103. [DOI] [PMC free article] [PubMed] [Google Scholar]
- 29.Yeo BT, Krienen FM, Sepulcre J, Sabuncu MR, Lashkari D. The organization of the human cerebral cortex estimated by functional connectivity. Journal of Neurophysiology. 2011 doi: 10.1152/jn.00338.2011. [DOI] [PMC free article] [PubMed] [Google Scholar]
- 30.Biswal BB, Mennes M, Zuo XN, Gohel S, Kelly C, Smith SM, Beckmann CF, Adelstein JS, Buckner RL, Colcombe S, et al. Toward discovery science of human brain function. Proc Natl Acad Sci U S A. 2010;107:4734–4739. doi: 10.1073/pnas.0911855107. [DOI] [PMC free article] [PubMed] [Google Scholar]
- 31.Filippini N, MacIntosh BJ, Hough MG, Goodwin GM, Frisoni GB, Smith SM, Matthews PM, Beckmann CF, Mackay CE. Distinct patterns of brain activity in young carriers of the APOE-epsilon4 allele. Proc Natl Acad Sci U S A. 2009;106:7209–7214. doi: 10.1073/pnas.0811879106. [DOI] [PMC free article] [PubMed] [Google Scholar]
- 32.Sperling RA, Laviolette PS, O’Keefe K, O’Brien J, Rentz DM, Pihlajamaki M, Marshall G, Hyman BT, Selkoe DJ, Hedden T, et al. Amyloid deposition is associated with impaired default network function in older persons without dementia. Neuron. 2009;63:178–188. doi: 10.1016/j.neuron.2009.07.003. [DOI] [PMC free article] [PubMed] [Google Scholar]
- 33.Seeley WW, Menon V, Schatzberg AF, Keller J, Glover GH, Kenna H, Reiss AL, Greicius MD. Dissociable intrinsic connectivity networks for salience processing and executive control. J Neurosci. 2007;27:2349–2356. doi: 10.1523/JNEUROSCI.5587-06.2007. [DOI] [PMC free article] [PubMed] [Google Scholar]
- 34.Smith SM, Fox P, Miller K, Glahn D, Fox P. Correspondence of the brain’s functional architecture during activation and rest. PNAS. 2009;106:13040–13045. doi: 10.1073/pnas.0905267106. al. e. ** Resting connectivity shows remarkable patterns of similarity with patterns of co-activated regions measured during thousands of task-related activation studies.
- 35.Fransson P, Marrelec G. The precuneus/posterior cingulate cortex plays a pivotal role in the default mode network: Evidence from a partial correlation network analysis. Neuroimage. 2008;42:1178–1184. doi: 10.1016/j.neuroimage.2008.05.059. [DOI] [PubMed] [Google Scholar]
- 36.Friston KJ, Li B, Daunizeau J, Stephan KE. Network discovery with DCM. Neuroimage. 2011;56:1202–1221. doi: 10.1016/j.neuroimage.2010.12.039. [DOI] [PMC free article] [PubMed] [Google Scholar]
- 37.Kötter R. Online retrieval, processing, and visualization of primate connectivity data from the CoCoMac database. Neuroinformatics. 2004;2:127–144. doi: 10.1385/NI:2:2:127. [DOI] [PubMed] [Google Scholar]
- 38.Passingham R, Stephan K, Kötter R. The anatomical basis of functional localization in the cortex. Nature Review Neuroscience. 2002;3:606–616. doi: 10.1038/nrn893. [DOI] [PubMed] [Google Scholar]
- 39.Behrens TE, Johansen-Berg H. Relating connectional architecture to grey matter function using diffusion imaging. Philos Trans R Soc Lond B Biol Sci. 2005;360:903–911. doi: 10.1098/rstb.2005.1640. [DOI] [PMC free article] [PubMed] [Google Scholar]
- 40.Behrens T, Johansen-Berg H, Woolrich M. Non-invasive mapping of connections between human thalamus and cortex using diffusion imaging. Nature Neuroscience. 2003;6:750–757. doi: 10.1038/nn1075. al. e. [DOI] [PubMed] [Google Scholar]
- 41.Johansen-Berg H, Behrens TE, Sillery E, Ciccarelli O, Thompson AJ, Smith SM, Matthews PM. Functional-anatomical validation and individual variation of diffusion tractography-based segmentation of the human thalamus. Cereb Cortex. 2005;15:31–39. doi: 10.1093/cercor/bhh105. [DOI] [PubMed] [Google Scholar]
- 42.Rushworth MF, Behrens TE, Johansen-Berg H. Connection patterns distinguish 3 regions of human parietal cortex. Cereb Cortex. 2006;16:1418–1430. doi: 10.1093/cercor/bhj079. [DOI] [PubMed] [Google Scholar]
- 43.Johansen-Berg H, Behrens TE, Robson MD. Changes inconnectivity profiles define functionally distinct regions in human medial frontal cortex. PNAS. 2004;101:13335–13340. doi: 10.1073/pnas.0403743101. al. e. [DOI] [PMC free article] [PubMed] [Google Scholar]
- 44.Anwander A, Tittgemeyer M, Cramon Dv, Friederici A, Knösche T. Connectivity-based parcellation of Broca’s area. Cerebral Cortex. 2007;17:816–825. doi: 10.1093/cercor/bhk034. [DOI] [PubMed] [Google Scholar]
- 45.Tomassini V, Jbabdi S, Klein J, Behrens T, Pozzilli C. Diffusion-weighted imaging tractography-based parcellation of the human lateral premotor cortex identifies dorsal and ventral subregions with anatomical and functional specializations. Journal of Neuroscience. 2007;27:10259–10269. doi: 10.1523/JNEUROSCI.2144-07.2007. al. e. [DOI] [PMC free article] [PubMed] [Google Scholar]
- 46.Mars R, Jbabdi S, Sallet J, O’Reilly J, Croxson P. Diffusion-weighted imaging tractography-based parcellation of the human parietal cortex and comparison with human and macaque resting-state functional connectivity. Journal of Neuroscience. 2011;31 doi: 10.1523/JNEUROSCI.5102-10.2011. al. e. [DOI] [PMC free article] [PubMed] [Google Scholar]
- 47.Beckmann M, Johansen-Berg H, Rushworth MF. Connectivity-based parcellation of human cingulate cortex and its relation to functional specialization. J Neurosci. 2009;29:1175–1190. doi: 10.1523/JNEUROSCI.3328-08.2009. * The human parietal cortex is partitioned into 10 connectionally-defined sub-regions that show a high degree of similarity with cytoarchitectonic divisions. Functional connections of parietal sub-regions are compared between humans and macaque monkeys, showing a large degree of overlap but intriguing differences within prefrontal connections.
- 48.Kim JH, Lee JM, Jo HJ, Kim SH, Lee JH, Kim ST, Seo SW, Cox RW, Na DL, Kim SI, et al. Defining functional SMA and pre-SMA subregions in human MFC using resting state fMRI: functional connectivity-based parcellation method. Neuroimage. 2010;49:2375–2386. doi: 10.1016/j.neuroimage.2009.10.016. [DOI] [PMC free article] [PubMed] [Google Scholar]
- 49.Cohen AL, Fair DA, Dosenbach NUF. Defining functional areas in individual human brains using resting state functional connectivity MRI. Neuroimage. 2008;41:45–57. doi: 10.1016/j.neuroimage.2008.01.066. al. e. [DOI] [PMC free article] [PubMed] [Google Scholar]
- 50.Nelson SM, Cohen AL, Power JD. A parcellation scheme for human left lateral parietal cortex. Neuron. 2010;67:156–170. doi: 10.1016/j.neuron.2010.05.025. al. e. [DOI] [PMC free article] [PubMed] [Google Scholar]
- 51.Van den Heuvel MP, Stam CJ, Boersma M, HE HP. Small-world and scale-free organization of voxel based resting-state functional connectivity in the human brain. Neuroimage. 2008b;43:528–539. doi: 10.1016/j.neuroimage.2008.08.010. [DOI] [PubMed] [Google Scholar]
- 52.Greicius M, Supekar K, Menon V, Dougherty R. Resting state functional connectivity reflects structural connectivity in the default mode network. Cerebral Cortex. 2009;19:72–78. doi: 10.1093/cercor/bhn059. [DOI] [PMC free article] [PubMed] [Google Scholar]
- 53.Vincent J, Patel G, Fox M, Snyder A, Baker J. Intrinsic functional architecture in the anaesthetized monkey brain. Nature. 2007;447 doi: 10.1038/nature05758. al. e. [DOI] [PubMed] [Google Scholar]
- 54.Margulies D, Vincent J, Kelly C, Lohmann G, Uddin L. Precuneus shares intrinsic functional architecture in humans and monkeys. PNAS. 2009;106:20069–20074. doi: 10.1073/pnas.0905314106. al. e. * An analysis of subdivisions in monkey and human precuneus on the basis of tract tracing and resting-state fMRI data.
- 55.Honey CJ, Sporns O, Cammoun L. Predicting human resting-state functional connectivity from structural connectivity. PNAS. 2009;106:2035–2040. doi: 10.1073/pnas.0811168106. al. e. ** One of the first systematic analyses of the relationship between structural and functional connectivity in the human brain
- 56.Hagmann P, Cammoun L, Gigandet X, Meuli R, Honey CJ, Wedeen VJ, Sporns O. Mapping the structural core of human cerebral cortex. PLoS Biol. 2008;6:e159. doi: 10.1371/journal.pbio.0060159. [DOI] [PMC free article] [PubMed] [Google Scholar]
- 57.Skulanski P, Jagannathan K, Calhoun VD. Measuring brain connectivity: diffusion tensor imaging validates resting state temporal correlations. Neuroimage. 2008;43:554–561. doi: 10.1016/j.neuroimage.2008.07.063. al. e. [DOI] [PMC free article] [PubMed] [Google Scholar]
- 58.Van den Heuvel M, et al. Microstructural organization of the cingulum tract and the level of default mode functional connectivity. Journal of Neuroscience. 2008;28:10844–10851. doi: 10.1523/JNEUROSCI.2964-08.2008. [DOI] [PMC free article] [PubMed] [Google Scholar]
- 59.Johnston J, Vaishnavi S, Smyth M, Zhang D, He B. Loss of resting interhemispheric functional connectivity after complete section of the corpus callosum. Journal of Neuroscience. 2008;28:6453–6458. doi: 10.1523/JNEUROSCI.0573-08.2008. [DOI] [PMC free article] [PubMed] [Google Scholar]
- 60.Kanai R, Bahrami B, Rees G. Human parietal cortex structure predicts individual differences in perceptual rivalry. Current Biology. 2010;20:1626–1630. doi: 10.1016/j.cub.2010.07.027. * Individual differences in the timing of spontaneous alterations in perception are shown to be partially predicted by variations in brain structure as indexed by both gray matter and white matter anatomical measures.
- 61.Scholz J, Klein MC, Behrens T, Johansen-Berg H. Training induces changes in white-matter architecture. Nature Neuroscience. 2009;12:1370–1371. doi: 10.1038/nn.2412. * One of the first reports to demonstrate changes in white matter structure following behavioral training of a complex visuo-motor skill.
- 62.Chang C, Glover G. Time-frequency dynamics of resting-state brain connectivity measured with fMRI. Neuroimage. 2010;50:81–98. doi: 10.1016/j.neuroimage.2009.12.011. * This report reveals resting-state functional connectivity measured with fMRI to be highly variable across time
- 63.Van De Ville V, Britz J, Michel C. EEG microstate sequences in healthy humans at rest reveal scale-free dynamics. PNAS. 2010;107:18179–18184. doi: 10.1073/pnas.1007841107. [DOI] [PMC free article] [PubMed] [Google Scholar]
- 64.Rubinov M, Sporns O. Complex network measures of brain connectivity: uses and interpretations. Neuroimage. 2010;52:1059–1069. doi: 10.1016/j.neuroimage.2009.10.003. Neuroimage. * An introductory survey to commonly used network measures together with a critical discussion of their meaning and interpretation
- 65.Bullmore E, Sporns O. Complex brain networks: graph theoretical analysis of structural and functional systems. Nature Review Neuroscience. 2009;10:186–198. doi: 10.1038/nrn2575. [DOI] [PubMed] [Google Scholar]
- 66.Hagmann P, Cammoun L, Gigandet X. Mapping the structural core of human cerebral cortex. PloS Biology. 2008;6 doi: 10.1371/journal.pbio.0060159. al. e. [DOI] [PMC free article] [PubMed] [Google Scholar]
- 67.Gong G, He Y, Concha L. Mapping anatomical connectivity patterns of human cerebral cortex using in vivo diffusion tensor imaging tractography. Cerebral Cortex. 2009;19:524–536. doi: 10.1093/cercor/bhn102. al. e. [DOI] [PMC free article] [PubMed] [Google Scholar]
- 68.Joyce KE, Laurienti PJ, Burdette JH, Hayasaka S. A new measure of centrality for brain networks. PLoS One. 2010;5:e12200. doi: 10.1371/journal.pone.0012200. [DOI] [PMC free article] [PubMed] [Google Scholar]
- 69.Lohmann G, Margulies DS, Horstmann A, Pleger B, Lepsien J, Goldhahn D, Schloegl H, Stumvoll M, Villringer A, Turner R. Eigenvector centrality mapping for analyzing connectivity patterns in FMRI data of the human brain. PLoS One. 2010;5:e10232. doi: 10.1371/journal.pone.0010232. [DOI] [PMC free article] [PubMed] [Google Scholar]
- 70.Rubinov M, Sporns O. Weight-conserving characterization of complex functional brain networks. Neuroimage. 2011;56:2068–2079. doi: 10.1016/j.neuroimage.2011.03.069. [DOI] [PubMed] [Google Scholar]
- 71.Zalesky A, Fornito A, Harding IH. Whole-brain anatomical networks: does the choice of nodes matter? Neuroimage. 2009;50:970–983. doi: 10.1016/j.neuroimage.2009.12.027. ea. [DOI] [PubMed] [Google Scholar]
- 72.Zalesky A, Fornito A, Bullmore ET. Network-based statistic: identifying differences in brain networks. Neuroimage. 2010;53:1197–1207. doi: 10.1016/j.neuroimage.2010.06.041. [DOI] [PubMed] [Google Scholar]
- 73.Deuker L, Bullmore ET, Smith M, Christensen S. Reproducibility of graph metrics of human brain functional networks. Neuroimage. 2009;47:1460–1468. doi: 10.1016/j.neuroimage.2009.05.035. al. NPe. [DOI] [PubMed] [Google Scholar]
- 74.Meunier D, Lambiotte R, Fornito A, et al. Hierarchical modularity in human brain functional networks. Front. Neuroinf. 2009;3 doi: 10.3389/neuro.11.037.2009. [DOI] [PMC free article] [PubMed] [Google Scholar]
- 75.Bassett DS, Greenfield DL, Meyer-Lindenberg A, et al. Efficient physical embedding of topologically complex information processing networks in brains and computer circuits. PloS Computational Biology. 2010;6 doi: 10.1371/journal.pcbi.1000748. ** This paper demonstrates the existence of hierarchical modularity in human brain, as well as commonalities in spatial embedding across a broad range of information-processing networks
- 76.Fornito A, Zalesky A, Bassett DS, Meunier D, I. E-W. Genetic influences on cost-efficient organization of human cortical functional networks. Journal of Neuroscience. 2011;31:3261–3270. doi: 10.1523/JNEUROSCI.4858-10.2011. al. e. [DOI] [PMC free article] [PubMed] [Google Scholar]
- 77.Akil H, Martone ME, Van Essen DC. Challenges and opportunities in mining neuroscience data. Science. 2011;331:708–712. doi: 10.1126/science.1199305. [DOI] [PMC free article] [PubMed] [Google Scholar]
- 78.Fox MD, Snyder AZ, Vincent JL, Corbetta M, Van Essen DC, Raichle ME. The human brain is intrinsically organized into dynamic, anticorrelated functional networks. Proc Natl Acad Sci U S A. 2005;102:9673–9678. doi: 10.1073/pnas.0504136102. [DOI] [PMC free article] [PubMed] [Google Scholar]
- 79.Caspers S, Eickhoff SB, Geyer S, Scheperjans F, Mohlberg H, Zilles K, Amunts K. The human inferior parietal lobule in stereotaxic space. Brain Struct Funct. 2008;212:481–495. doi: 10.1007/s00429-008-0195-z. [DOI] [PubMed] [Google Scholar]