

Abstract
Functional near-infrared spectroscopy (fNIRS) is a portable, non-invasive, brain imaging technology that uses low levels of non-ionizing light to record changes in cerebral blood flow in the brain through optical sensors placed on the surface of the scalp. These signals are recorded via flexible fiber optic cables, which allow neuroimaging experiments to be conducted on participants while performing tasks such as standing or walking. FNIRS has the potential to provide new insights into the evolution of brain activation during ambulatory motor learning tasks and standing tasks to probe balance and vestibular function. In this study, a 32 channel fNIRS system was used to record blood flow changes in the frontal, motor, sensory, and temporal cortices during active balancing associated with playing a video game simulating downhill skiing (Nintendo Wii™; Wii-fit™). Using fNIRS, we found activation of superior temporal gyrus, which was modulated by the difficulty of the balance task. This region had been previously implicated in vestibular function from other animal and human studies.
Keywords: Brain imaging, Brain Function, Neuroimaging, Balance, Near-infrared spectroscopy, Vestibular cortex
Introduction
Although vestibular function is known to involve sub-cortical and basal structures of the brain, there is increasing evidence of the role of cortical structures in the processing of vestibular related information (reviewed in [1]). In particular, cortical projections of the vestibular network into the temporal-parietal junction and superior temporal gyrus have been implicated in vestibular-ocular control from clinical case studies of individuals with vestibular function affected by lesions in the brain [2]. In addition, research studies utilizing functional magnetic resonance imaging (fMRI) and positron emission tomography (PET) methods have been used to study healthy brain function and have confirmed the existence of several additional cortical regions in the human brain [3]. Most notably, fMRI has been used to show involvement of the parieto-insular vestibular cortex (PIVC), the visual temporal sylvian area (VTS) in the insular cortex, the superior temporal gyrus (STG), the inferior parietal lobe (IPL), the anterior cingulum, and Broadman area 6a (premotor cortex). Many of the analogues to these regions had been previously found in tracer and electrophysiological studies in monkeys (reviewed in [3]). However, with the exception of some PET contrast agents (specifically fluorodeoxyglucose; FDG), MRI and PET studies of vestibular function have been very limited largely due to the requirement that the subject lay motionless and in a supine position. Previous studies in humans have been limited to external stimulation of the vestibular system by way of direct stimulation of the inner ear by galvanic [4, 5] or caloric irrigation [6, 7]. These methods can be preformed inside of an MRI or PET scanner, but only allow probes of specific subsets of the vestibular system.
Functional near-infrared spectroscopy (fNIRS) is a non-invasive brain imaging technique that measures blood oxygenation changes similar to fMRI. The technique is based upon the changes in absorption of light emitted by sources onto the surface of the head and measured by detectors. This technique, unlike fMRI and PET, is relatively inexpensive, small, and portable. FNIRS uses fiber optics to carry the signal from a head cap worn by participants to the recording instrument. Thus, fNIRS can be used to record brain activations from tasks such as walking [8] and balance perturbations [9].
In this study, fNIRS was used to record brain activation during a simple balance task which involved simulated skiing using a video game that prompted participants to use shifts in their center-of-mass to steer a character down a simulated slalom ski slope. Previously, similar video game-based exercises had been proposed for the potential of rehabilitation in individuals with motor or vestibular disorders following stroke or other brain injury [10-13]. The goal of this current work was to investigate the hypothesis that brain activation in the vestibular cortex (e.g. PIVC, STG, and IPL regions) could be measured using fNIRS during a simple balance task.
Functional NIRS
In 1977, F.F. Jöbsis [14] first demonstrated the ability to make non-invasive optical measurements of blood flow to the brain. Over the last several decades since his publication, functional near-infrared spectroscopy (fNIRS) has been applied to study a variety of brain regions including the frontal, visual, motor, auditory, and somatosensory cortices (reviewed in [15]). FNIRS is a non-invasive brain imaging modality, which uses near-infrared and visible (red) light to image changes in oxy- and deoxy-hemoglobin through sensors placed on the surface of the head [16, 17]. The fNIRS signal is based on changes in the optical absorption of the oxygenated and deoxygenated forms of hemoglobin in the tissue. This provides functional contrast similar to the functional MRI BOLD (blood oxygen level dependent) signal; reflecting changes in regional blood flow to areas of the brain involved in processing functional tasks. Several previous studies (reviewed in [18]) have shown close correspondence between fNIRS and fMRI signals with temporal and spatial (linear) correlations of up to R=0.98 [19] and R=0.86 [20] respectively. Thus, fNIRS can provide functional brain information that is directly relatable to fMRI.
During fNIRS recordings, flexible fiber optic cables are used to deliver low levels of light (<0.4W/cm2) to an arrangement of source positions on the head (see figure 1A). Each position contains two (or more) colors of light, which is used to separate absorption changes differentially due to oxy- and deoxy-hemoglobin. Light entering at a source position in the fNIRS head cap will diffuse throughout the tissue. This light will reach down to approximately the outer 5-8mm of the cortex of the brain based on previous modeling studies (see figure 1B). Light is then collected as it exits the head beneath a discrete set of fiber optics that carry light back to photon detectors on the fNIRS instrument (see figure 1B). Thus, the amount of light traveling from a light source to reach a detector position is proportional to the absorption of the underlying tissue between that measurement pair. Biological tissue is highly scattering. On average, light in the region of 650-900nm travels through brain tissue approximately 1/10 mm before scattering (see figure 1C). During evoked brain activity, regional changes in blood flow in the active region alter the concentration of oxy- and deoxy-hemoglobin in the brain, which in turn differentially changes the absorption of light at different wavelengths because the two forms of hemoglobin have different optical absorption profiles. Changes in hemoglobin can be recovered from fNIRS measurements at multiple wavelengths via the modified Beer-Lambert law [21]. By spatially arranging the optical sensors on the head, the location of the brain signal can be approximated as reviewed in Boas et al [22].
Figure 1.
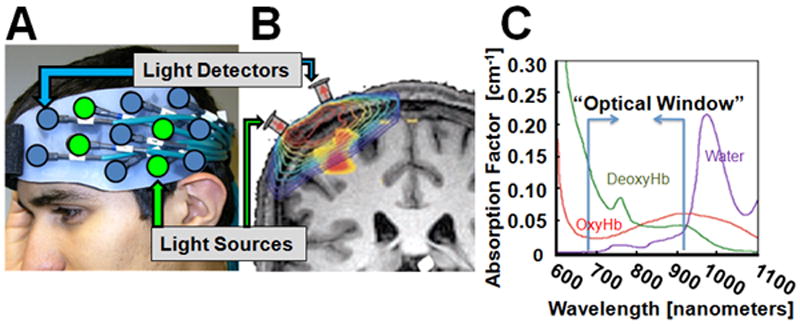
Functional near-infrared spectroscopy (fNIRS) is used to non-invasively measure changes in oxy- and deoxy-hemoglobin in the brain. In panel A), a grid of fiber optic-based light sources and detectors is shown mounted on flexible head cap worn by the participant. Each of these source-detector pairs measures light from a diffuse volume of tissue beneath the pair as shown in the model of light propagation (in log-scale) in panel B (described in [19]). This light can reach approximately 5-8mm into the brain cortex at a source-detector spacing of 3.2cm. Light at two wavelengths (690nm and 830nm) is used to reconstruct changes in oxy- and deoxy-hemoglobin from the intrinsic absorption properties of hemoglobin (panel C) and the modified Beer-Lambert relationship [16].
Methods
Subjects
Nine right-handed volunteers with no self-reported balance or mobility disorders (age 18 to 42; 5 male/ 4 female) participated in the study. All participants gave written informed consent as approved by the local intuitional review board at the University of Pittsburgh.
Balance task
In this study, fNIRS signals were measured during repeated trials of a commercial video game simulating downhill slalom skiing (Nintendo Wii™ ; Wii-Fit™ video game). Aside from being a readily accessible platform to initiate a simple balance task, the Wii-Fit™ program has been used in recent research studies investigating the use of video games in physical therapy and rehabilitation following stroke or brain injury [10-13]. The attractiveness of this system is that participants also enjoy doing the task, which is believed to increase adherence to the therapy.
In this game, participants stand on an instrumented balance board that records center-of-mass information, which is used to control the character avatar in the video game. The subjects are first given instructions on how to play the game, which involves the subject to stand on the Wii balance board and move his or her body to go in between gates while going down a virtual ski slope (see figure 2A). The subject can control the avatar on the screen by either bringing one’s center of balance to the right or left, causing the avatar to go right or left, respectively. The subject can increase the avatar’s speed by bringing their center of balance forward on the balance board as well as decrease their speed by bringing their center of balance backwards. Subjects were told that to receive the highest possible score, one would need to go as fast as possible and miss as few gates as possible. In three of the subjects, an additional control task was performed in which the subject watched the video game but was told to stand still during the task. This was done to rule out that the brain response was due to the visual stimulus of the game as opposed to the actual balance task.
Figure 2.
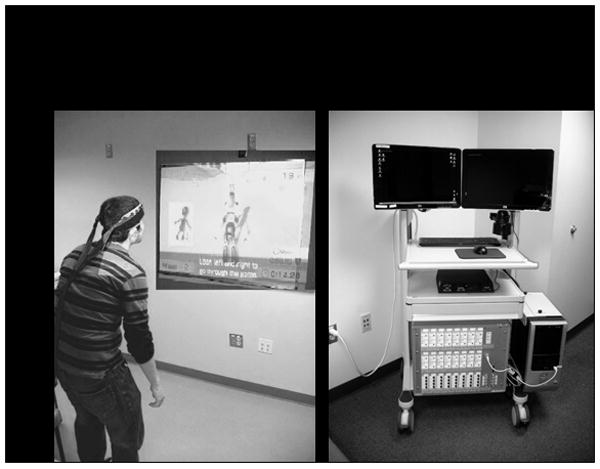
FNIRS signals were recorded from subjects during upright performance of the balance task (panel A). A 32-channel fNIRS system (shown in panel B) was used to collect the data. Ten (10) meter long fiber optics were used to transmit and receive the signal from the bilateral head cap worn by the participant and the fNIRS instrument.
The difficulties that were utilized in this study were advanced and beginner. These differ in the amount of time it takes to get down the hill (longer course) as well as the number and distance between slalom gates. For functional scans, the subject was told to stand still for 30 seconds (standing rest) after which the game was started. A second 30s standing rest period was added after the subject reached the bottom of the virtual ski slope. The balance task (skiing down the hill) was self-paced depending on the skill and speed of the subject, but generally lasted 37.6±4.7 seconds at the beginner level and 63.1±6.6s seconds at advanced. Each subject preformed 6 trials on the beginner level and 8 trials at the advanced level, where each scan contained two trials separated by at least 30 seconds.
NIRS Instrumentation
All subjects were recorded using a 32-channel continuous wave fNIRS instrument (CW6 Real-time system; TechEn Inc; Milford, MA) (see figure 2B). The NIRS instrument uses two different wavelengths of light at 690 nm and 830 nm which allowing recording of both oxy- and deoxy- hemoglobin changes.
The fNIRS head cap is constructed from plastic materials and Velcro™. A total of 32 source-detector combinations were collected using a nearest-neighbor geometry (see figure 1) with 3.2cm source-detector spacing. The measurements are made at a sample rate of 4 Hz. The data was collected using a custom acquisition software that allowed the operator to visualize the brain activity in real-time [23]. Stimulus events were manually marked in the data by the scan technologist using a feature built into the acquisition software.
Anatomical registration of fNIRS data
Prior to recording brain signals, the position of the fNIRS probe was registered on the head of each subject for the purpose of inter-subject data registration and image reconstruction [24, 25]. A handheld three-dimensional, FastSCAN stylus (Polhemus; Colchester, VT) was used to mark the location of each of the fNIRS detector optodes and additional landmark points on the subject’s head (ears, nasion, inion and top of head). A custom-written navigation software program allowed immediate visualization of the location of the fNIRS probe relative to an atlas MRI and verification that the probe was correctly positioned over the regions-of-interest (bilateral prefrontal cortex, frontal cortex, and superior temporal gyrus). The location of the fNIRS probe was verified with respect to the atlas locations and repositioned if necessary in order to center the probe over the expected brain regions.
Registration information was used to register the location of the optical sensors to an anatomical MRI head using a custom registration algorithm [25]. In this study, the Colin27 MRI atlas [26] was used based on previous work by Custo et al [27] which demonstrated that atlas based registration was sufficient for modeling light paths through the head of healthy, normal, subjects. Based on that work, we believe that the atlas-based models are appropriate for our current subject population, but we recognize that this approach would not work for extension of these methods across distinct populations (e.g. comparison of brain activation elderly and younger participants) where systematic differences in the structure and anatomy of the brain may introduce additional errors. Based on the registration of the optical sensors to the atlas head, a finite-element model of light diffusion [28] was used to generate the model of where light travels in the head (sensitivity model) as described in [29]. An image reconstruction model based on restricted maximum likelihood was used as described in [29].
Statistical analysis of brain activity
Analysis of fNIRS data was based on a boxcar general linear model [30]. This approach is similar to the standard model used for the analysis of fMRI data [31]. A custom MATLAB (Mathworks, Natick MA) script was used to process the fNIRS data. In brief, based on the onset times and identity of the stimulus events, a design matrix was constructed using a boxcar function as a model of the expected hemodynamic response. In addition, a series of discrete cosine transform terms (0-1/120 Hz) were used as nuisance regressors to remove slow drift. Ye et al [30] had previously proposed a similar model based on the fMRI software SPM (statistical parametric mapping [31]). Restricted maximum likelihood with a second-order autoregressive noise term was used to estimate the noise statistics (pre-whitening) and to invert the linear model using the Gauss-Markov equation. Temporal analysis was performed on a per subject basis and the estimated weight coefficients and error models were then used for group-level statistics [29].
Group-level analysis across the subjects was done using a random-effects model of brain activity as described in [29]. The image reconstruction model was based on the cortical-surface model described in Abdelnour and Huppert [25], which used wavelets to model the surface of the cortex of the brain. In brief, a group-level image is estimated which is simultaneously consistent (in a Bayesian sense using maximum likelihood [24]) with all of the data from every subject. Random effects terms model the perturbation of each subject’s brain activation from the group-level image. We have previously shown that this group-level analysis increases the statistical power of the fNIRS data in comparison with a more conventional two-step group analysis procedure (e.g. an ill-posed image reconstruction of each individual subject followed by averaging of the images together). A Swaittewaite correction is applied to estimate the effective degrees of freedom of the model [31].
Results
The fNIRS signals showed a robust hyperemic (increased blood flow) response in the superior temporal gyrus (STG) and supramarginal gyrus in both the left and right hemispheres. The right STG was modulated by the difficulty of the task; with 2-3 fold increase in the response during the more difficult task. The control task in which the subjects watched the video game but did not move did not give any detected brain responses, suggesting that the hemodynamic change observed during the game was due to the balance/movement task and not the visual stimulus of the game itself. Representative data (oxy- and deoxy-hemoglobin changes) from one of the nine subjects is shown in figure 3. Figure 3A and 3B shows a map of the response magnitude of oxy- and deoxy-hemoglobin changes respectively for each of the 30 optical channels, or source-detector pairs, (y-axis) across time (x-axis). The time onsets and durations of the two skiing events of “advanced” difficulty are highlighted with dotted lines in both images. Channels near the temporal-parietal junction showed more activation. The red/blue color indicates that the signal increased/decreased relative to the rest period (0-30s). In figure 3C, the time course of a channel from above the STG (showing changes in hemoglobin) and a channel from the frontal region (showing no changes in hemoglobin) is shown. As typical of fNIRS, the task induced increase in blood flow causing an increase in oxy-hemoglobin and decrease in deoxy-hemoglobin relative to baseline. The location of the fNIRS probe and optical channels is shown in figure 3D with approximate relation to the international 10-20 system based on a map created by the University of Münster T2T-convertor (http://wwwneuro03.uni-muenster.de/ger/t2tconv/).
Figure 3.
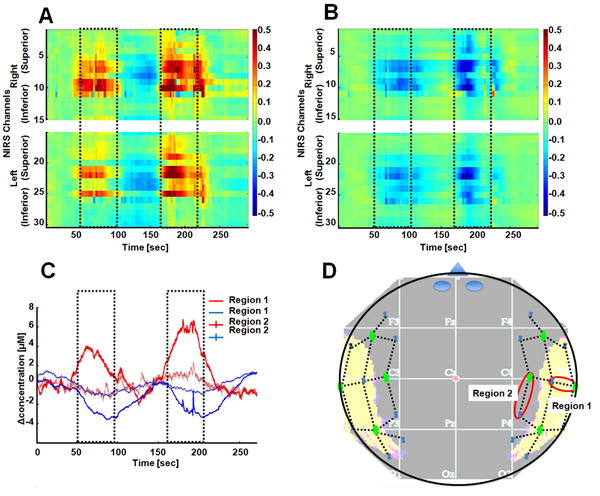
This figure shows the fNIRS data from a single 5-minute functional scan (two trials) from a single subject. Panels A and B show the changes in oxy- and deoxy-hemoglobin per optical channel (y-axis) over time (x-axis) respectively. The timing of the two trials is outlined in each plot. Only the channels in the temporal-parietal region show activation related changes. In panel C, the time courses for two of the channels (indicated in panel D) are shown for this same data. The channel from above the STG shows activation, while a channel from an anterior region (thinner line) shows no activation. The approximate location of the fNIRS sensors is shown in panel D relative to the 10-20 coordinate system. For reference, the location of the temporal cortex is shown in the under-lain image.
Figure 4 shows the group-level reconstructions of oxy-hemoglobin changes for the beginner and advanced trials. Brain activation (p<0.05 corrected) was seen in both the left and right STG and supramarginal gyrus. The activation in the right STG was statistically higher during the advanced level of difficulty.
Figure 4.
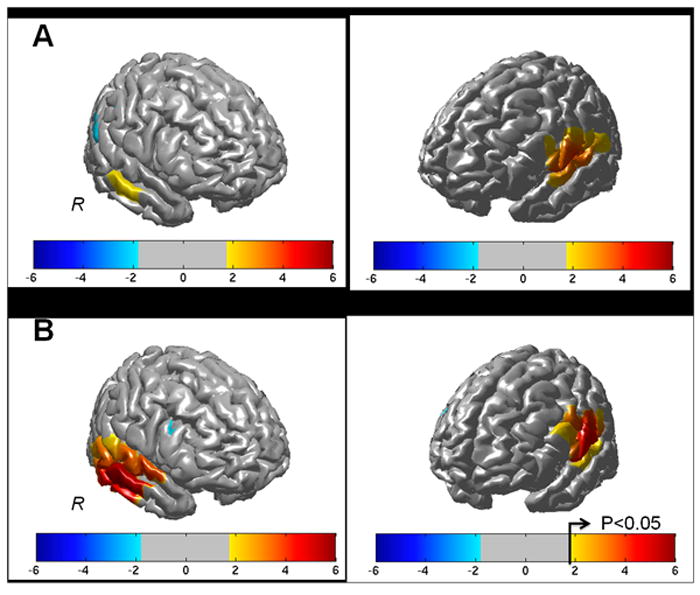
The effects maps (T-statistic) for the reconstructed group-level (N=9) oxy-hemoglobin changes are shown above for the beginner (panel A) and advanced (panel B) trial conditions. Regions near the left and right superior temporal gyrus were significantly activated (p<0.05 corrected) in both tasks.
Discussion
To our knowledge, this is the first use of fNIRS to measure brain activation during a standing vestibular task. The regions found in this study (superior temporal gyrus and supramarginal gyrus at the temporal-parietal junction) are consistent with previous fMRI and PET studies [3]. This confirms that these areas are involved in normal balance and are not simply artifacts of galvanic or caloric stimulation in the fMRI. This finding is also consistent with previous observations from brain lesion patients [32]. Noting that all of our subjects were right-handed, we found that the right superior temporal gyrus was modulated by the difficulty of the task. The more difficult level involves a more sustained (63s compared to 37s) task although the general linear model used in the analysis accounts for this difference in task duration, which suggests that this is not a linear effect. Also the advanced level involves a higher number of gates in closer distances, thus involving a higher level of action. Right hemispheric dominance was also previously reported by Dieterich et al. in caloric stimulation during H2O15 PET [33]. When caloric stimulation was performed on the right ear of six right-handed participants they found that there was significantly greater activation on the side ipsilateral to the dominant hand, but when caloric stimulation was done on the left ear this dominance was no longer present [33]. In the design of this study, participants always preformed the beginner level task first to avoid practice effects from the harder task. However, it is possible that fatigue or habituation effects may be a confound of the comparison between the beginner and advanced level task responses.
In our data (e.g. figure 3), the time course of the hemodynamic response was noted to be a bit longer then the typically observed fNIRS or fMRI response. Namely, for a typical fMRI response, the hemodynamic impulse response peaks at around 6-8 seconds and then returns to baseline around 12 seconds after the end of the task. This is typically modeled by a gamma function or similar curve [31]. However, in our data, the response was sustained 20-30 seconds longer then what would typically be expected based on this canonic model of the hemodynamic response. Because the response was so localized and reproducible, we don’t think that this is due to a change in systemic physiology. This elongated brain response may reflect an adaptation of the vestibular network in response to the balance task, rather than a direct response to the task itself. Similar time-elongated responses are seen, for example, in the eye nystagmus recordings following balance or caloric stimulations of the vestibular system. This would be consistent with the suggestion by Leigh and Zee that the vestibular cortex plays a role in vestibular adaptation rather than direct coordination of balance [34].
In conclusion, we have demonstrated the efficacy of using fNIRS to study vestibular function. While this technology is limited to only the cortex of the brain, this can be used to complement other fMRI and PET studies and can provide better insights into multi-sensory integration and vestibular adaptation.
Acknowledgments
This work was funded by startup funding by the University of Pittsburgh Department of Radiology and the National Institutes of Health (NIH-NIA P30AG024827)
Footnotes
Conflicts of Interest: The authors declare no conflicts of interest.
Publisher's Disclaimer: This is a PDF file of an unedited manuscript that has been accepted for publication. As a service to our customers we are providing this early version of the manuscript. The manuscript will undergo copyediting, typesetting, and review of the resulting proof before it is published in its final citable form. Please note that during the production process errors may be discovered which could affect the content, and all legal disclaimers that apply to the journal pertain.
References
- 1.Brandt T. Cortical matching of visual and vestibular 3D coordinate maps. Ann Neurol. 1997;42(6):983–4. doi: 10.1002/ana.410420624. [DOI] [PubMed] [Google Scholar]
- 2.Ventre-Dominey J, Nighoghossian N, Denise P. Evidence for interacting cortical control of vestibular function and spatial representation in man. Neuropsychologia. 2003;41(14):1884–98. doi: 10.1016/s0028-3932(03)00126-x. [DOI] [PubMed] [Google Scholar]
- 3.Dieterich M, Brandt T. Functional brain imaging of peripheral and central vestibular disorders. Brain. 2008;131(Pt 10):2538–52. doi: 10.1093/brain/awn042. [DOI] [PubMed] [Google Scholar]
- 4.Bense S, Stephan T, Yousry TA, Brandt T, Dieterich M. Multisensory cortical signal increases and decreases during vestibular galvanic stimulation (fMRI) J Neurophysiol. 2001;85(2):886–99. doi: 10.1152/jn.2001.85.2.886. [DOI] [PubMed] [Google Scholar]
- 5.Bucher SF, Dieterich M, Wiesmann M, Weiss A, Zink R, Yousry TA, Brandt T. Cerebral functional magnetic resonance imaging of vestibular, auditory, and nociceptive areas during galvanic stimulation. Ann Neurol. 1998;44(1):120–5. doi: 10.1002/ana.410440118. [DOI] [PubMed] [Google Scholar]
- 6.Fasold O, von Brevern M, Kuhberg M, Ploner CJ, Villringer A, Lempert T, Wenzel R. Human vestibular cortex as identified with caloric stimulation in functional magnetic resonance imaging. Neuroimage. 2002;17(3):1384–93. doi: 10.1006/nimg.2002.1241. [DOI] [PubMed] [Google Scholar]
- 7.Suzuki M, Kitano H, Ito R, Kitanishi T, Yazawa Y, Ogawa T, Shiino A, Kitajima K. Cortical and subcortical vestibular response to caloric stimulation detected by functional magnetic resonance imaging. Brain Res Cogn Brain Res. 2001;12(3):441–9. doi: 10.1016/s0926-6410(01)00080-5. [DOI] [PubMed] [Google Scholar]
- 8.Miyai I, Tanabe HC, Sase I, Eda H, Oda I, Konishi I, Tsunazawa Y, Suzuki T, Yanagida T, Kubota K. Cortical mapping of gait in humans: a near-infrared spectroscopic topography study. Neuroimage. 2001;14(5):1186–92. doi: 10.1006/nimg.2001.0905. [DOI] [PubMed] [Google Scholar]
- 9.Mihara M, Miyai I, Hatakenaka M, Kubota K, Sakoda S. Role of the prefrontal cortex in human balance control. Neuroimage. 2008;43(2):329–36. doi: 10.1016/j.neuroimage.2008.07.029. [DOI] [PubMed] [Google Scholar]
- 10.Acosta AM, Dewald HA, Dewald JP. Pilot study to test effectiveness of video game on reaching performance in stroke. Journal of rehabilitation research and development. 2011;48(4):431–44. doi: 10.1682/jrrd.2010.04.0052. [DOI] [PMC free article] [PubMed] [Google Scholar]
- 11.Hurkmans HL, Ribbers GM, Streur-Kranenburg MF, Stam HJ, van den Berg-Emons RJ. Energy expenditure in chronic stroke patients playing Wii Sports: a pilot study. Journal of neuroengineering and rehabilitation. 2011;8:38. doi: 10.1186/1743-0003-8-38. PMCID: 3148966. [DOI] [PMC free article] [PubMed] [Google Scholar]
- 12.Gil-Gomez JA, Llorens R, Alcaniz M, Colomer C. Effectiveness of a Wii balance board-based system (eBaViR) for balance rehabilitation: a pilot randomized clinical trial in patients with acquired brain injury. Journal of neuroengineering and rehabilitation. 2011;8:30. doi: 10.1186/1743-0003-8-30. PMCID: 3120756. [DOI] [PMC free article] [PubMed] [Google Scholar]
- 13.Mouawad MR, Doust CG, Max MD, McNulty PA. Wii-based movement therapy to promote improved upper extremity function post-stroke: a pilot study. Journal of rehabilitation medicine : official journal of the UEMS European Board of Physical and Rehabilitation Medicine. 2011;43(6):527–33. doi: 10.2340/16501977-0816. [DOI] [PubMed] [Google Scholar]
- 14.Jobsis FF. Noninvasive, infrared monitoring of cerebral and myocardial oxygen sufficiency and circulatory parameters. Science. 1977;198(4323):1264–7. doi: 10.1126/science.929199. [DOI] [PubMed] [Google Scholar]
- 15.Huppert T, Franceschini M, Boas D. Noninvasive Imaging of Cerebral Activation with Diffuse Optical Tomography. In: Frostig R, editor. In Vivo Optical Imaging of Brain Function. CRC Press; Boca Raton: 2008. In press. [PubMed] [Google Scholar]
- 16.Cope M, Delpy DT, Reynolds EO, Wray S, Wyatt J, van der Zee P. Methods of quantitating cerebral near infrared spectroscopy data. Adv Exp Med Biol. 1988;222:183–9. doi: 10.1007/978-1-4615-9510-6_21. [DOI] [PubMed] [Google Scholar]
- 17.Chance B, Leigh JS, Miyake H, Smith DS, Nioka S, Greenfeld R, Finander M, Kaufmann K, Levy W, Young M, et al. Comparison of time-resolved and -unresolved measurements of deoxyhemoglobin in brain. Proc Natl Acad Sci U S A. 1988;85(14):4971–5. doi: 10.1073/pnas.85.14.4971. [DOI] [PMC free article] [PubMed] [Google Scholar]
- 18.Steinbrink J, Villringer A, Kempf F, Haux D, Boden S, Obrig H. Illuminating the BOLD signal: combined fMRI-fNIRS studies. Magn Reson Imaging. 2006;24(4):495–505. doi: 10.1016/j.mri.2005.12.034. [DOI] [PubMed] [Google Scholar]
- 19.Huppert TJ, Hoge RD, Diamond SG, Franceschini MA, Boas DA. A temporal comparison of BOLD, ASL, and NIRS hemodynamic responses to motor stimuli in adult humans. Neuroimage. 2006;29(2):368–82. doi: 10.1016/j.neuroimage.2005.08.065. PMCID: 2692693. [DOI] [PMC free article] [PubMed] [Google Scholar]
- 20.Huppert T, Hoge RD, Dale AM, Franceschini MA, Boas DA. A Quantitative Spatial Comparison of Diffuse Optical Imaging with BOLD- and ASL-Based fMRI. J Biomed Opt. 2006;11(6):064018. doi: 10.1117/1.2400910. [DOI] [PMC free article] [PubMed] [Google Scholar]
- 21.Huppert TJ, Diamond SG, Franceschini MA, Boas DA. HomER: a review of time-series analysis methods for near-infrared spectroscopy of the brain. Appl Opt. 2009;48(10):D280–98. doi: 10.1364/ao.48.00d280. PMCID: 2761652. [DOI] [PMC free article] [PubMed] [Google Scholar]
- 22.Boas DA, Dale AM, Franceschini MA. Diffuse optical imaging of brain activation: approaches to optimizing image sensitivity, resolution, and accuracy. Neuroimage. 2004;23(Suppl 1):S275–88. doi: 10.1016/j.neuroimage.2004.07.011. [DOI] [PubMed] [Google Scholar]
- 23.Abdelnour AF, Huppert T. Real-time imaging of human brain function by near-infrared spectroscopy using an adaptive general linear model. Neuroimage. 2009;46(1):133–43. doi: 10.1016/j.neuroimage.2009.01.033. PMCID: 2758631. [DOI] [PMC free article] [PubMed] [Google Scholar]
- 24.Abdelnour AF, Genovese C, Huppert TJ. Hierarchical Bayesian regularization of reconstructions for diffuse optical tomography using multiple priors. Biomedical Optics Expres. 2010;1(4):1084–1103. doi: 10.1364/BOE.1.001084. [DOI] [PMC free article] [PubMed] [Google Scholar]
- 25.Abdelnour F, Schmidt B, Huppert TJ. Topographic localization of brain activation in diffuse optical imaging using spherical wavelets. Phys Med Biol. 2009;54(20):6383–413. doi: 10.1088/0031-9155/54/20/023. PMCID: 2806654. [DOI] [PMC free article] [PubMed] [Google Scholar]
- 26.Holmes C, Hoge R, Collins L, Woods R, Toga A, Evans A. Enhancement of MR images using registration for signal averaging. J Comput Assist Tomogr. 1998;22(2):324–333. doi: 10.1097/00004728-199803000-00032. [DOI] [PubMed] [Google Scholar]
- 27.Custo A, Wells WM, 3rd, Barnett AH, Hillman EM, Boas DA. Effective scattering coefficient of the cerebral spinal fluid in adult head models for diffuse optical imaging. Appl Opt. 2006;45(19):4747–55. doi: 10.1364/ao.45.004747. [DOI] [PubMed] [Google Scholar]
- 28.Dehghani H, Eames ME, Yalavarthy PK, Davis SC, Srinivasan S, Carpenter CM, Pogue BW, Paulsen KD. Near infrared optical tomography using NIRFAST: Algorithm for numerical model and image reconstruction. Commun Numer Methods Eng. 2008;25(6):711–732. doi: 10.1002/cnm.1162. PMCID: 2826796. [DOI] [PMC free article] [PubMed] [Google Scholar]
- 29.Abdelnour AF, Huppert TJ. A random-effects model for group-level analysis of diffuse optical brain imaging. Biomedical Optics Expres. 2011;2(1):1–25. doi: 10.1364/BOE.2.000001. [DOI] [PMC free article] [PubMed] [Google Scholar]
- 30.Ye JC, Tak S, Jang KE, Jung J, Jang J. NIRS-SPM: statistical parametric mapping for near-infrared spectroscopy. Neuroimage. 2009;44(2):428–47. doi: 10.1016/j.neuroimage.2008.08.036. [DOI] [PubMed] [Google Scholar]
- 31.Friston KJ. Statistical parametric mapping : the analysis of functional brain images. London: Academic; 2007. p. 647. [Google Scholar]
- 32.Dieterich M, Bartenstein P, Spiegel S, Bense S, Schwaiger M, Brandt T. Thalamic infarctions cause side-specific suppression of vestibular cortex activations. Brain. 2005;128(Pt 9):2052–67. doi: 10.1093/brain/awh551. [DOI] [PubMed] [Google Scholar]
- 33.Dieterich M, Bense S, Lutz S, Drzezga A, Stephan T, Bartenstein P, Brandt T. Dominance for vestibular cortical function in the non-dominant hemisphere. Cereb Cortex. 2003;13(9):994–1007. doi: 10.1093/cercor/13.9.994. [DOI] [PubMed] [Google Scholar]
- 34.Leigh RJ, Zee DS. The neurology of eye movements. 4. 2006. p. 763. x. [Google Scholar]