Abstract
Purpose
To estimate errors in soft tissue-based image guidance due to relative changes between primary tumor (PT) and affected lymph node (LN) position and volume, and to compare the results to bony anatomy-based displacements of PTs and LNs during radiotherapy of lung cancer.
Materials and Methods
Weekly repeated breath hold CT scans were acquired in 17 lung cancer patients undergoing radiotherapy. PTs and affected LNs were manually contoured on all scans after rigid registration. Inter- and intrafraction displacements in the centers of mass of PTs and LNs relative to bone, and LNs relative to PTs (LN-PT) were calculated.
Results
The mean volume after 5 weeks was 65% for PTs and 63% for LNs. Systematic/random interfraction displacements were 2.6 – 4.6 mm/2.7 – 2.9 mm for PTs, 2.4 – 3.8 mm/1.4 – 2.7 mm for LNs, and 2.3 – 3.9 mm/1.9 – 2.8 mm for LN-PT. Systematic/random intrafraction displacements were < 1 mm except in superior-inferior direction. Interfraction LN-PT displacements > 3 mm were observed in 67% of fractions and require a safety margin of 12 mm in lateral, 11 mm in anteroposterior and 9 mm in superior-inferior direction. LN-PT displacements displayed significant time trends (p<0.0001) and depended on the presence of pathoanatomical conditions of the ipsilateral lung, such as atelectasis.
Conclusion
Interfraction LN-PT displacements were mostly systematic and comparable to bony anatomy-based displacements of PTs or LNs alone. Time trends, large volume changes and the influence of pathoanatomical conditions underline the importance of soft tissue-based image guidance and the potential of plan adaptation.
Keywords: lung cancer, active breathing control, interfraction motion, intrafraction motion, image-guided radiotherapy
Introduction
Radiotherapy of lung cancer is associated with a variety of geometrical uncertainties caused by respiratory motion and volume changes. More recently, mediastinal lymph node motion has been studied showing lymph node motion of 7 mm and above depending on the lymph node location (1–5). Repeated imaging identified interfractional lymph node displacements of approximately 5 mm and volume changes of more than 30 % (5–7). Lymph nodes are usually not considered for cone beam computed tomography (CBCT)-based image guidance due to low soft tissue contrast in the mediastinum. Considering the above observations on positional and volumetric lymph node variability, primary tumor based image guidance might result in geometric misses of mediastinal lymph nodes (8). Although evidence exists that primary tumor and lymph node displacements are different during respiration (1, 8), at present the positional variability of lymph nodes relative to their associated primary tumors over a radiotherapy series is not known.
This study analyzes inter- and intrafraction motion of primary lung tumors and mediastinal lymph nodes relative to bony anatomy, as well as volume changes of both target structures during radiotherapy. The major focus of this study is to estimate errors arising from relative positional changes between primary tumor and affected lymph nodes in the setting of primary lung tumor-based image-guidance, using repeated weekly CT imaging. In addition, the influence of existing pathoanatomical conditions of the ipsilateral lung on primary tumor and lymph node displacements are assessed.
Material and Methods
Patient information
In a prospective study that was approved by the local ethics committee, 17 patients with locally advanced lung cancer were imaged repeatedly during radiotherapy to investigate the positional stability of tumor and lymph nodes. Tumor stages ranged between IIA and IV. All patients underwent radiotherapy with conventional fractionation schemes over several weeks. A platinum-based chemotherapy was applied in 12/17 patients. Table 1 shows patient-specific clinical and radiotherapy information.
Table 1.
Number of imaging procedures, therapy dose, tumor/lymph node location and initial volume
| Patient # | # weekly scans | Total dose/dose per fraction (Gy) | Primary tumor location | Primary tumor volume (cm3) | Lymph node location | Lymph node volume (cm3) | PA of the ipsilateral lung |
|---|---|---|---|---|---|---|---|
| 1 | 6 | 63/1.8 | L upper lobe | 23.8 | 1) 4R 2) 4L |
1) 0.5 2) 1.2 |
|
| 2 | 7 | 70.2/1.8 | R lower lobe | 43.3 | 4R | 0.8 | AT resolving wk 6 |
| 3 | 6 | 60/2 | R + L upper lobes | 100.3 | 4R | 3.6 | |
| 4 | 7 | 73.8/1.8 | L lower lobe | 65 | AT resolving wk 3 | ||
| 5 | 6 | 54/1.8 | R upper lobe | 0.6 | 4R | 5.9 | |
| 6 | 6 | 64/2 | R lower lobe | 241.9 | |||
| 7 | 6 | 66/2 | R upper lobe | 5.7 | 4R | 9.1 | PE increasing |
| 8 | 4 | 73.8/1.8 | R upper lobe | 11.3 | |||
| 9 | 5 | 60/2 | R upper lobe | 40.1 | 1) 4R 2) 3A |
1) 13.5 2) 10.4 |
|
| 10 | 5 | 64.8/1.8 | L lower lobe | 47.9 | 4R | 0.9 | AT resolving |
| 11 | 7 | 41.4/1.8 | L lower lobe | 81.1 | 1) 4R 2) 4L |
1) 0.9 2) 0.4 |
PE resolving |
| 12 | 5 | 66/2 | R middle lobe | 33.7 | 4R | 2.2 | |
| 13 | 5 | 64.8/1.8 | L upper lobe | 377.3 | 4R | 0.4 | AT partially resolving |
| 14 | 6 | 66/2 | L upper lobe | 74.2 | |||
| 15 | 7 | 66/2 | R upper lobe | 216.2 | 1) 4R 2) 7 |
1) 20.9 2) 7.1 |
|
| 16 | 4 | 54/2 | R lower lobe | 58.3 | 1) 1R 2) 2R 3) 4R |
1) 2.1 2) 14.4 3) 1.5 |
AT resolving wk 3 |
| 17 | 7 | 66/2 | L lower lobe | 46.6 | 4R | 1.9 |
number; R: right; L: left; lymph node locations are classified according to Mountain and Dresler (9), wk: week; PA: pathoanatomical condition, AT: atelectasis; PE: pleural effusion.
Image acquisition
Patients underwent weekly CT imaging sessions using active breathing control (ABC, Elekta Active Breathing Coordinator, version 2.0, Stockholm, Sweden). CT imaging was performed on a 16-slice helical CT scanner (Brilliance Big Bore, Philips Medical Systems, Andover, MA) obtaining images with 2 mm slice thickness. No intravenous contrast was applied. Each CT scan was obtained using a single breath hold at normal end inspiration using the same level of inspiration for all scans. The level of inspiration breath hold was determined individually for each patient during an initial coaching session at about 80% of normal end inspiration, see ref. 10. The minimum duration of each breath hold was 8 seconds which could be achieved by all patients without problems. Per weekly session, 3 CT scans were acquired successively without repositioning to simulate interbreath-hold reproducibility of the patient anatomy.
Contouring
To simulate online bony anatomy-based image guidance, all CT scans were rigidly registered to the bony anatomy of the first CT scan of week one (planning CT). Subsequently, physicians manually contoured the primary lung tumors on all repeat scans (289 scans in total) using commercial treatment planning software (Pinnacle 8.1, Phillips, Fitchburg, WI). In addition, in 13 patients 19 affected lymph nodes were delineated, see table 1. Since hilar lymph nodes could not be reliably identified without contrast, only mediastinal lymph nodes were contoured. Only lymph nodes with easy boundary identification were delineated to improve contouring consistency. Contouring variation was further reduced by copying and manually editing contours between subsequent scans.
Data analysis
-
Interfractional volume changes and inter-/intrafractional primary tumor (PT) and lymph node (LN) positional variability in the bony anatomy reference system:
To investigate interfractional positional variability of PTs (17 patients) and LNs (13 patients with 19 lymph nodes) relative to bony anatomy, for each patient the difference of the centroid position between the first weekly scans of week 2 to 5 and the reference scan of week 1 were calculated for lateral (LR), anteroposterior (AP), superior-inferior (SI) direction. Differences were averaged over all weeks for each patient, and standard deviations were calculated. The overall variability was calculated by averaging over all patients’ means for PT and LN. In patients with more than one contoured LN, variability per patient was calculated by averaging over the variabilities of all LNs. To assess intrafractional positional variability during repeated breath holds, relative differences in the PT and LN positions of CT scans 2 and 3 relative to scan 1 of each week were measured and averaged over all weeks and patients. Systematic 121 and random displacements were calculated according to van Herk (11).
-
Inter- and intrafractional positional variability between PT and LN in the soft tissue reference system:
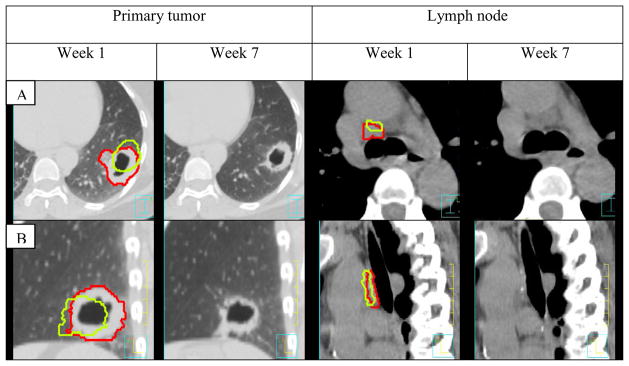
Assuming a setting of PT-based soft tissue set up, relative position changes between the two components of the GTV (PT and LN) were assessed for the 13 patients with contoured LNs (see figure 1 for an example). Analysis was done in analogy to 1. by measuring lymph node-to-primary tumor (LN-PT) centroid differences. Setup margins were calculated for a PT-based image guidance setting using van Herk’s margin recipe corrected for penumbra in lung tissue (12).
-
Association of PT and LN displacements with related pathoanatomical conditions:
Patients were visually scored for the presence or absence of pathological conditions of the ipsilateral lung, such as atelectasis and pleural effusion, and stratified into two subgroups. PT and LN displacements relative to bone and LN-PT displacements were compared between subgroups.
Figure 1.
Example of primary tumor and lymph node shrinkage and change in position between week 1 and 7 in patient 17. Week 1 contours are shown in red, week 7 in green. Week 7 contours are superimposed on week 1 images for better comparison.
Statistics
Associations between PT- and LN-specific parameters, such as volume reduction, PT and LN position changes, LN-PT displacements were analyzed using a linear regression model. Significance was assumed for p<0.05 based on T-distribution. A repeated measures mixed model with compound symmetric covariance matrix was used to model primary tumor and lymph node displacement over the weeks. To compare the effects of pathoanatomical conditions on ipsilateral lung volume and displacements Bayesian modeling was used. All analyses were performed using statistical software R v2.11.1. Due to the limited sample size, statistical results observed in this study need to be confirmed with larger data bases.
Results
-
PT and LN displacements in the bony anatomy reference system:
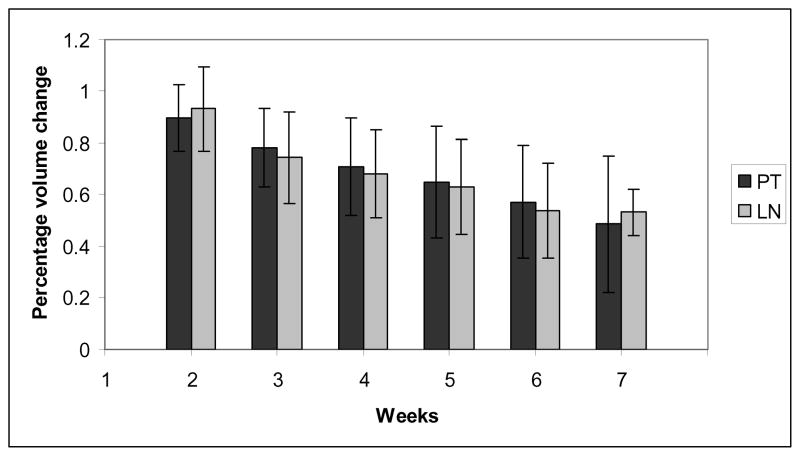
The average volume on week 1 scan was 86.3 cm3 (SD 100.2 cm3) for the primary tumor and 5.2 cm3 (SD 5.9 cm3) for lymph nodes. The mean remaining volume after 5 weeks relative to the reference image set in week 1 was 65% ± 22% for the primary tumor and 63% ± 19% for lymph nodes, see figure 2
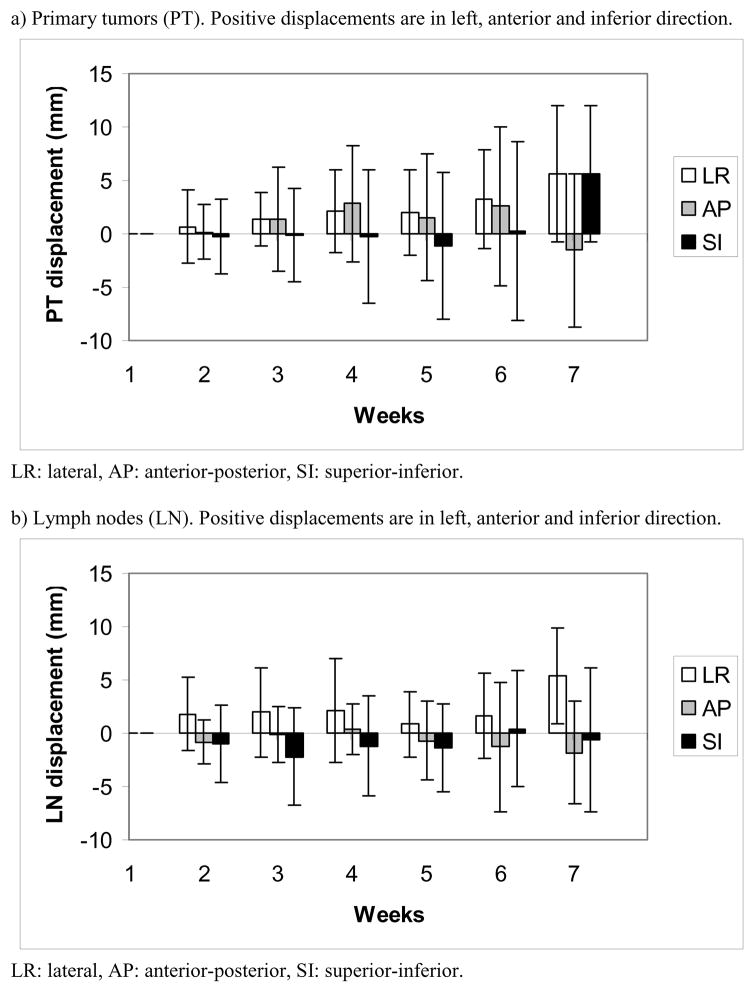
Systematic/random inter- and intrafractional displacements of PT and LN are shown in table 2. Figure 3a) and b) show average interfractional displacements of PT and LN over time. The 3D vector lengths of interfractional displacement of PTs and LNs were significantly correlated (p=0.003). PT/LN displacement was not significantly associated with PT/LN volume reduction (p=0.1/0.08).
-
LN-PT displacements in the soft tissue reference system:
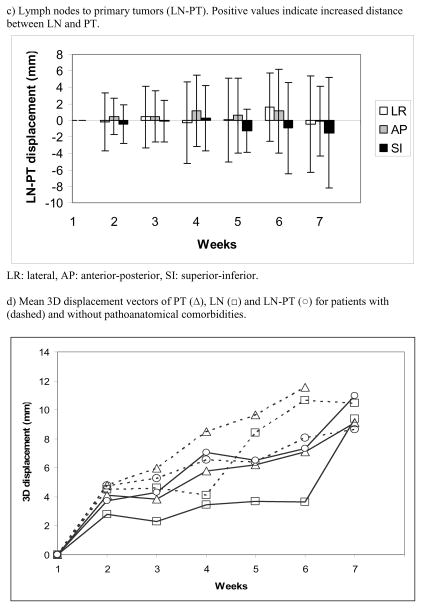
Systematic/random inter- and intrafractional LN-PT displacements are shown in table 2. Figure 3c) shows average interfractional LN-PT displacements over time. Interfraction LN-PT displacements > 3 mm were observed in 12/13 patients in 67% of all imaging sessions and require a safety margin of 12 mm (LR), 11 mm (AP) and 9 mm (SI) to cover affected lymph nodes. This margin does not consider additional uncertainties 167 (e.g., delineation variability). Intrafraction displacements > 3 mm were seen in 13%.
LN-PT displacement was not significantly associated with the volume reduction of PT (p=0.7) and LN (p=0.17). A patient-specific analysis showed significant variations in the LN-PT displacement over time (p<0.0001) with the absolute LN-PT distance becoming either larger or smaller in about half of the patients each.
-
Association of tumor and lymph node displacements with related pathoanatomical conditions:
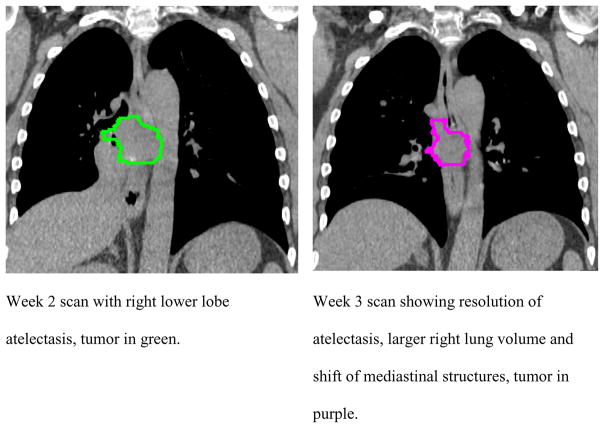
Seven of 17 patients overall and 6 of 13 patients with contoured lymph nodes had pathoanatomical conditions in the ipsilateral lung. Commonly, change in the pathoanatomical condition resulted in an increase in the ipsilateral lung volume of 17 % at the end of treatment compared to 5 % in patients without pathoanatomical conditions (not significant (n.s.)). Patients with pathoanatomical conditions have, on average, larger PT and LN displacements than patients without such conditions. Differences with and without pathoanatomical conditions for LN-PT displacement were smaller indicating that LN and PT move in the same direction in the presence of changes in pathoanatomical conditions (Figure 3d, n.s.). The systematic/random PT and LN displacements relative to bone as well as relative to each other are shown in table 2 for patients with and without pathoanatomical conditions. Margins for PT/LN coverage based on bony anatomy-set up were 7 – 10/3 – 5 mm without and 10 – 16 mm/6 – 13 mm with pathoanatomical conditions. For PT-based set up margins of 5 – 9 mm without and 2 – 14 mm with pathoanatomical conditions were calculated to ensure lymph node coverage. Figure 4 shows an example of tumor shift between week 2 and 3 after resolution of a tumor- associated atelectasis.
Figure 2.
Percentage volume change of primary tumor (PT) and lymph nodes (LN) relative to week 1 scan (=100%) with standard deviations.
Table 2.
Systematic and random displacements
| PT-bone | LN-bone | LN-PT | |||||||
|---|---|---|---|---|---|---|---|---|---|
| Displacements (mm) | Lat | AP | SI | Lat | AP | SI | Lat | AP | SI |
| Systematic | |||||||||
| Interfractional | 3.0 | 4.1 | 4.6 | 2.9 | 2.1 | 3.4 | 3.2 | 3.6 | 1.5 |
| - Without PA | 2.5 | 2.6 | 3.7 | 1.0 | 1.7 | 1.3 | 3.2 | 1.6 | 1.9 |
| - With PA | 3.7 | 5.9 | 5.9 | 1.8 | 2.7 | 5.0 | 2.9 | 5.2 | 0.7 |
| Intrafractional | 0.2 | 0.3 | 0.8 | 0.6 | 0.7 | 1.3 | 0.6 | 0.4 | 1.2 |
| Random | |||||||||
| Interfractional | 2.6 | 2.8 | 2.9 | 2.6 | 1.7 | 1.9 | 2.5 | 2.0 | 2.1 |
| - Without PA | 2.3 | 2.2 | 2.4 | 1.6 | 1.3 | 1.9 | 2.8 | 2.1 | 2.2 |
| - With PA | 3.0 | 3.6 | 3.6 | 3.4 | 2.0 | 1.7 | 2.0 | 2.0 | 1.9 |
| Intrafractional | 0.5 | 0.8 | 2.0 | 0.9 | 0.7 | 1.5 | 1.0 | 0.8 | 1.7 |
PT: Primary tumor; LN: Lymphnode; Lat: lateral; AP: anteroposterior; SI: superior inferior; PA: Pathoanatomical condition
Figure 3.
Average displacements during radiotherapy. Error bars show standard deviations.
Figure 4.
Example of ipsilateral lung volume and anatomy change after resolution of atelectasis in patient 16.
Discussion
Tumor and lymph node displacement relative to bony anatomy
A approximately 35 % tumor volume reduction in the present study is in good agreement with other reports that observed tumor shrinkage at a rate of 0.6–2.3 % per day resulting in 40 % and more total volume reduction at the end of radiotherapy (13). Our results are in agreement with other breath hold studies reporting systematic and random tumor displacements of 2 – 6 mm and 2–5 mm relative to bone with not much difference along the three major axes (14–16). The association of the 3D displacement vector lengths of PTs and LNs was statistically significant indicating that large PT displacement during a radiotherapy series is associated with large LN displacement.
Only limited data are available on interfraction LN position variability and volume change over a conventional radiotherapy series. Juhler-Nøttrup et al. (7) investigated interfractional PT and LN positional variation using end-inhale gated CT scans after 30 and 60 Gy in 10 patients. They observed a volume shrinkage of 34 % for LNs which is similar to the 37% LN volume reduction in our series. The 3D displacement over 6 weeks was 0.51 cm for PTs and 0.55 cm for LNs compared to 0.84 and 0.55 cm after 5 weeks in our study. Differences in the primary tumor displacements are likely due to the tumor location which was in the upper lobe for all patients in Juhler-Nøttrup’s study compared to both upper and lower lobes in our study. Thomas et al. (5) while mostly investigating positional variations of LN regions, not LNs per se, found up to 4.1 mm average interfraction displacement in exhale compared to approximately 2 to 3 mm for inhale in our study with large interpatient variations.
Soft tissue-based image guidance
Of interest for soft-tissue based image-guidance strategies is the question whether set up to the PT means also adequate coverage of involved LN. The magnitude of LN-PT displacements was comparable with PT displacements, although it was smaller in the superior-inferior direction indicating that despite superior-inferior direction being the major direction of displacement relative to bone, breath hold technique can control for this predominately respiration-influenced motion both in PTs and LNs. The observed intrafraction LN-PT displacement was small (approximately 1 mm).
While the calculated margins to account for interfraction LN-PT displacement were quite impressive (9 – 12 mm), large patient-to-patient displacement variations of up to 15 mm were observed. A similar magnitude of margins between 8 and 14 mm was reported by other authors for bony anatomy-based guidance for the PT only (14, 15). Several reports observed significantly reduced set up errors using soft tissue guidance and breath hold technique compared to bony anatomy guidance with systematic and random displacements of up to 1.2 and 1.5 mm resulting in margins of up to 4 mm (15, 16). These data are based on selected patients, mostly with limited tumor stages treated with stereotactic radiotherapy over a short time course, whereas in our study locally advanced tumors were analyzed over a longer period of time with larger volume regression. The use of megavoltage and kilovoltage CBCTs in other studies using soft tissue guidance (13,15–17) prevented the analysis of LN and LN-PT displacements which as could be shown in the present study using low artifact (reduced motion with ABC) fan beam CTs results in displacements that are of a magnitude similar to bony anatomy-based displacements.
The rate of atelectasis and pleural effusion with 6/17 patients is similar to 9/27 described by Lim at al. (13). As has been observed by other authors, large tumor volume regression and the presence of atelectasis with resolution during treatment results in an increase in interfraction displacements (14, 17, 18). High regression rates of PT and LNs and the presence of pleural effusions and atelectasis are responsible for large displacements in our study. To our knowledge, this study is the first to quantitatively evaluate differences in interfraction variability due to the presence of pathoanatomical conditions.
The usefulness of image guidance and plan adaptation for lung cancer treatment was evaluated by different groups. With soft tissue-guidance margin reductions of 50% and more were described compared to bony anatomy-set up in selected patients with and without ABC (15–17, 19, 20). The observed time-trends of LN-PT displacements, the large volume shrinkages seen in this study and the presence of tumor-related pathoanatomical conditions underline the importance of soft tissue-based image guidance and the potential for plan adaptation.
Conclusion
Interfraction variations of PT and LNs relative to bony anatomy and relative to each other were mostly systematic and of a comparable magnitude. Sufficiently large safety margins are required to cover LN-PT displacements. Soft-tissue based image guidance is particularly important in the presence of atelectasis and pleural effusions.
Acknowledgments
The authors thank Dr. Matthew Orton for help with contouring.
This work has been supported by NIH grants R01CA116249, P01CA116602 and P30CA016059.
Footnotes
Conflicts of interest:
None of the authors has any actual or potential conflicts of interest.
Publisher's Disclaimer: This is a PDF file of an unedited manuscript that has been accepted for publication. As a service to our customers we are providing this early version of the manuscript. The manuscript will undergo copyediting, typesetting, and review of the resulting proof before it is published in its final citable form. Please note that during the production process errors may be discovered which could affect the content, and all legal disclaimers that apply to the journal pertain.
References
- 1.Donnelly ED, Parikh PJ, Lu W, et al. Assessment of intrafraction mediastinal and hilar lymph node movement and comparison to lung tumor motion using four-dimensional CT. Int J Radiat Oncol Biol Phys. 2007;69:580–588. doi: 10.1016/j.ijrobp.2007.05.083. [DOI] [PMC free article] [PubMed] [Google Scholar]
- 2.Jenkins P, Salmon C, Mannion C. Analysis of the movement of calcified lymph nodes during breathing. Int J Radiat Oncol Biol Phys. 2005;61:329–334. doi: 10.1016/j.ijrobp.2004.05.063. [DOI] [PubMed] [Google Scholar]
- 3.Piet AH, Lagerwaard FJ, Kunst PW, et al. Can mediastinal nodal mobility explain the low yield rates for transbronchial needle aspiration without real-time imaging? Chest. 2007;131:1783–1787. doi: 10.1378/chest.06-2964. [DOI] [PubMed] [Google Scholar]
- 4.Sher DJ, Wolfgang JA, Niemierko A, et al. Quantification of mediastinal and hilar lymph node movement using four-dimensional computed tomography scan: implications for radiation treatment planning. Int J Radiat Oncol Biol Phys. 2007;69:1402–1408. doi: 10.1016/j.ijrobp.2007.05.022. [DOI] [PubMed] [Google Scholar]
- 5.Thomas JG, Kashani R, Balter JM, et al. Intra and interfraction mediastinal nodal region motion: implications for internal target volume expansions. Medical Dosimetry. 2009;34:133–139. doi: 10.1016/j.meddos.2008.07.003. [DOI] [PMC free article] [PubMed] [Google Scholar]
- 6.Bosmans G, Van Baardwijk A, Dekker A, et al. Time trends in nodal volumes and motion during radiotherapy for patients with stage III non-small-cell lung cancer. Int J Radiat Oncol Biol Phys. 2008;71:139–144. doi: 10.1016/j.ijrobp.2007.08.071. [DOI] [PubMed] [Google Scholar]
- 7.Juhler-Nøttrup T, Korreman SS, Pedersen AN, et al. Interfractional change in tumour volume and position during entire radiotherapy courses for lung cancer with respiratory gating and image guidance. Acta Oncologica. 2008;47:1406–1413. doi: 10.1080/02841860802258778. [DOI] [PubMed] [Google Scholar]
- 8.Pantarotto JR, Piet AH, Vincent A, et al. Motion analysis of 100 mediastinal lymph nodes: potential pitfalls in treatment planning and adaptive strategies. Int J Radiat Oncol Biol Phys. 2009;74:1092–1099. doi: 10.1016/j.ijrobp.2008.09.031. [DOI] [PubMed] [Google Scholar]
- 9.Mountain CF, Dresler CM. Regional lymph node classification for lung cancer staging. Chest. 1997;111:1718–1723. doi: 10.1378/chest.111.6.1718. [DOI] [PubMed] [Google Scholar]
- 10.Glide-Hurst CK, Gopan E, Hugo GD. Anatomical and pathological variability during radiation therapy for a hybrid active breath hold gating technique. Int J Radiat Oncol Biol Phys. 2010;77:910–917. doi: 10.1016/j.ijrobp.2009.09.080. [DOI] [PMC free article] [PubMed] [Google Scholar]
- 11.van Herk M. Errors and margins in radiotherapy. Semin Radiat Oncol. 2004;14:52–64. doi: 10.1053/j.semradonc.2003.10.003. [DOI] [PubMed] [Google Scholar]
- 12.van Herk M, Remeijer P, Rasch C, et al. The probability of correct target dosage: Dose-population histograms for deriving treatment margins in radiotherapy. Int J Radiat Oncol Biol Phys. 2000;47:1121–1135. doi: 10.1016/s0360-3016(00)00518-6. [DOI] [PubMed] [Google Scholar]
- 13.Lim G, Bezjak A, Higgins J, et al. Tumor regression and positional changes in non-small cell lung cancer during radical radiotherapy. J Thorac Oncol. 2011;6:531–536. doi: 10.1097/JTO.0b013e31820b8a52. [DOI] [PubMed] [Google Scholar]
- 14.Panakis N, McNair HA, Christian JA, et al. Defining the margins in the radical radiotherapy of non-small cell lung cancer (NSCLC) with active breathing control (ABC) and the effect on physical lung parameters. Radiother Oncol. 2008;87:65–73. doi: 10.1016/j.radonc.2007.12.012. [DOI] [PubMed] [Google Scholar]
- 15.Shen Y, Zhang H, Wang J, et al. Hypofractionated radiotherapy for lung tumors with online cone beam CT guidance and active breathing control. Radiat Oncol. 2010;5:19. doi: 10.1186/1748-717X-5-19. [DOI] [PMC free article] [PubMed] [Google Scholar]
- 16.Wang J, Zhong R, Bai S, et al. Evaluation of positioning accuracy of four different immobilizations using cone-beam CT in radiotherapy of non-small-cell lung cancer. Int J Radiat Oncol Biol Phys. 2010;77:1274–1281. doi: 10.1016/j.ijrobp.2009.09.049. [DOI] [PubMed] [Google Scholar]
- 17.Sonke JJ, Lebesque J, van Herk M. Variability of four-dimensional computed tomography patient models. Int J Radiat Oncol Biol Phys. 2008;70:590–598. doi: 10.1016/j.ijrobp.2007.08.067. [DOI] [PubMed] [Google Scholar]
- 18.Sarrut D, Boldea V, Ayadi M, et al. Nonrigid registration method to assess reproducibility of breath-holding with ABC in lung cancer. Int J Radiat Oncol Biol Phys. 2005;61:594–607. doi: 10.1016/j.ijrobp.2004.08.007. [DOI] [PubMed] [Google Scholar]
- 19.Nelson C, Blater P, Morice RC, et al. Evaluation of tumor position and PTV margin using image guidance and respiration gating. Int J Radiat Oncol Biol Phys. 2010;76:1578–1585. doi: 10.1016/j.ijrobp.2009.08.002. [DOI] [PubMed] [Google Scholar]
- 20.Spoelstra FO, Pantarotto JR, Van Sörnsen de Koste JR, et al. Role of adaptive radiotherapy during concomitant chemoradiotherapy for lung cancer: analysis of data from a prospective clinical trial. Int J Radiat Oncol Biol Phys. 2009;75:1092–1097. doi: 10.1016/j.ijrobp.2008.12.027. [DOI] [PubMed] [Google Scholar]


