

Abstract
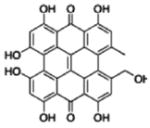
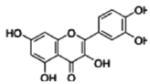
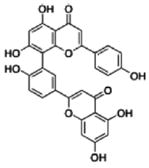
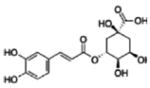
Our previous studies found that 4 compounds, namely pseudohypericin, amentoflavone, quercetin, and chlorogenic acid in Hypericum perforatum ethanol extract synergistically inhibited lipopolysaccharide (LPS)-induced macrophage production of prostaglandin E2 (PGE2). Microarray studies led us to hypothesize that these compounds inhibited PGE2 production by activating suppressor of cytokine signaling 3 (SOCS3). In the current study we used siRNA to knockdown the expression of SOCS3 in RAW 264.7 macrophages and investigated the impact of H. perforatum extract and the 4 compounds on inflammatory mediators and cytokines. We found SOCS3 knockdown significantly compromised the inhibition of PGE2 and nitric oxide (NO) by the 4 compounds, but not by the extract. The 4 compounds, but not the extract decreased interleukin-6 (IL-6) and tumor necrosis factor-α (TNF-α), while both of them lowered interleukine-1β. SOCS3 knockdown further decreased IL-6 and TNF-α. Pseudohypericin was the major contributor to the PGE2 and NO inhibition in cells treated with the 4 compounds and its activity was lost with SOCS3 knockdown. Cyclooxygenase-2 (COX-2) and inducible NO synthase protein expression were not altered by the treatments, while COX-2 activity was decreased by the extract and the 4 compounds and increased by SOCS3 knockdown. In summary, we demonstrated that the 4 compounds inhibited LPS-induced PGE2 and NO through SOCS3 activation. The reduction of PGE2 can be partially attributed to COX-2 enzyme activity, which was significantly elevated with SOCS3 knockdown. At the same time, our results also suggest that constituents in H. perforatum extract were alleviating LPS-induced macrophage response through SOCS3 independent mechanisms.
Keywords: Hypericum perforatum, Inflammation, Lipopolysaccharide, Macrophage, Nitric oxide, Prostaglandin E2, St. John’s wort, Suppressor of cytokine signaling 3
1. Introduction
Macrophages are not only critical components of innate immunity, but they also play an important role in regulating adaptive immunity and maintaining the balance of overall immune function (Hu et al., 2007). Toll-like receptors (TLRs) are major receptors found in macrophages that recognize exogenous and endogenous stimuli and mediate subsequent cellular responses. Among TLRs, TLR-4 binds to lipopolysaccharide (LPS) on the cell walls of Gram negative bacteria (Ohmori and Hamilton, 2001). LPS stimulation of macrophages leads to activation of nuclear factor-kappa B (NF-κB) and mitogen-activated protein kinase (MAPK) pathways, which will promote the secretion of inflammatory mediators, reactive oxygen species, cytokines and chemokines (Libby, 2007). The magnitude and essence of inflammatory responses induced in macrophages are determined by crosstalk among different cell signaling pathways such as Janus kinase-signal transducer and activator of transcription (JAK-STAT) that respond to extracellular microenvironment (Bjorkbacka et al., 2004; Hu et al., 2007; Ohmori and Hamilton, 2001). While being a pivotal defense against pathogens, inflammation is also the culprit of many pathological processes such as arthritis, bronchitis, and atherosclerosis (Bjorkbacka et al., 2004; Libby, 2007).
Hypericum perforatum, more commonly known as ‘St. John’s wort’, has been found to possess anti-inflammatory activities (Hu et al., 2006; Raso et al., 2002). Using an LPS-stimulated RAW 264.7 mouse macrophage model, our laboratory studied the inhibition of the inflammatory mediator prostaglandin E2 (PGE2) by H. perforatum ethanol extract and using bioactivity guided fractionation identified a group of 4 compounds that accounted for the anti-inflammatory effect of the most active fraction from the extract (Hammer et al., 2008; Hammer et al., 2007). Psuedohypericin, amentoflavone, quercetin, and chlorogenic, together referred to as “the four component system”, acted synergistically inhibiting LPS-induced PGE2 production by RAW 264.7 macrophages (Hammer et al., 2008). Further study by Hammer et al. using microarray to measure changes in transcriptome in these cells suggested that genes involved in the JAK-STAT pathway may explain the observed activity of H. perforatum fraction and the 4 compounds (Hammer et al., 2010). Specifically, the elevated expression of suppressor of cytokine signaling 3 (SOCS3) was of particular interest due to the fact that SOCS3 is a negative regulator of JAK-STAT pathway during TLR4 activation (Liu et al., 2008b; Qin et al., 2008; Yoshimura et al., 2007). SOCS3 was also shown to connect signaling between JAK-STAT and MAPK pathways, therefore could be a candidate target of the anti-inflammatory activity (Hu et al., 2007).
The current study set out to test the hypothesis that SOCS3 activation is critical for the inhibition of macrophage inflammatory response by the 4 compounds, and is also important for the overall activity of non-fractionated H. perforatum extract. We established SOCS3 knockdown RAW 264.7 macrophages using SOCS3 specific short interfering RNA (siRNA) and used these cells to extensively study the influence of H. perforatum extract and the 4 compounds on LPS-induced inflammation.
2. Results
2.1. Knockdown of LPS-induced SOCS3 expression
In order to validate the knockdown of SOCS3 in RAW 264.7 macrophages transfected with SOCS3 siRNA, cells that were not transfected, transfected with scrambled siRNA, or transfected with SOCS3 siRNA were incubated with or without 1 μg/mL LPS for 18 h before harvest followed by RNA and protein extraction. As shown in Figure 1, LPS increased the expression of SOCS3 mRNA to 100-fold and SOCS3 protein to 1.5 fold of base level in non-transfected and scrambled siRNA-transfected RAW 264.7 macrophages. While not affecting the expression of GAPDH mRNA and β-actin protein, SOCS3 specific siRNA transfection significantly negated the LPS-stimulated SOCS3 expression, thus confirmed the specific knockdown of SOCS3 gene using siRNA. The overall transfection rate was estimated to be 62% based on the qRT-PCR results. Although the background level of SOCS3 expression was not affected by the knockdown, the reduced LPS-induced SOCS3 was sufficient for the purpose of this research because all subsequent experiments focused on the role of SOCS3 in the effect of H. perforatum on the LPS-stimulated inflammatory response.
Figure 1. Expression of SOCS3 mRNA and protein.

RAW 264.7 mouse macrophages were either treated with the transfection reagent alone (non-transfected), transfected with scrambled siRNA, or SOCS3 specific siRNA. Expression of SOCS3 in terms of mRNA and protein were assayed with or without 18 h of stimulation with 1 μg/mL LPS. Transcription of SOCS3 and GAPDH mRNA are shown in panel A as log transcription quantity, while protein quantity of SOCS3 and β-actin are shown in panel B as percentage of non-transfected control without LPS induction (Mean ± SEM, n=3). A representative Western-blot image is provided to show the expression level of SOCS3 protein. # and ## indicate significant (p<0.05 and p<0.01) change with LPS stimulation, while * and ** indicate significant (p<0.05 and p<0.01) difference compared to non-transfected cells with the same LPS induction.
2.2. Quantification of the 4 compounds in H. perforatum extract
Because we used extract made from the 2008 H. perforatum harvest, instead of the extract previously characterized by Hammer et al. (Hammer et al., 2007), the abundance of the 4 compounds was analyzed using LC-MS-UV to allow us to quantify the 4 compounds within this extract. Table 1 shows that in the extract that were composed of 30 μg of dried mass per mL, the concentration of chlorogenic acid was the highest among the four at 0.58 μM, followed in decreasing concentrations by quercetin at 0.38 μM, pseudohypericin at 0.08 μM, and amentoflavone at 0.03 μM.
Table 1.
Quantification of the 4 compounds in H. perforatum extract.
| Compound | Concentration (μM)* | Original 4 component system (μM)** | |
|---|---|---|---|
| Pseudohypericin |
|
0.08 ± 0.02 | 0.03 |
| Quercetin |
|
0.38 ± 0.17 | 0.07 |
| Amentoflavone |
|
0.03 ± 0.01 | 0.08 |
| Chlorogenic acid |
|
0.58 ± 0.16 | 0.2 |
Compounds quantified by LC-MS-UV analysis. Amount of each of the 4 compounds is shown as mean concentration in 30 μg/mL extract ± SEM.
Detected in 30 μg/mL H. perforatum ethanol extract.
Used in Hammer et al (2008 and 2010).
2.3. Cytotoxicity of H. perforatum extract, and the 4 compounds with SOCS3 knockdown
Although we controlled the treatment condition by limiting light-activation to 30 min, H. perforatum extract contains potentially cytotoxic compounds such as hypericin and pseudohypericin which have light-dependent toxicity (Schmitt et al., 2006a). Due to the broad spectrum of biological processes that SOCS3 gene was associated with, the viability of RAW 264.7 could be affected by knocking down this gene. Therefore, we conducted cytotoxicity assays. The results suggested no change in the number of viable cells when cells were treated with the extract or the 4 compounds, with and without SOCS3 knockdown (data shown in Supplemental Figure 1).
2.4. Inhibition of LPS-induced PGE2 and NO production by H. perforatum extract and the 4 compounds with SOCS3 knockdown
After successfully establishing the SOCS3 knockdown macrophage model, we applied H. perforatum extract and the 4 compounds at the concentrations as in the extract (Table 1) to non-transfected, scrambled siRNA transfected, and SOCS3 siRNA transfected RAW 264.7 macrophages with and without LPS.
Figure 2A reveals that LPS-induced PGE2 production by macrophages without SOCS3 knockdown was significantly reduced by H. perforatum extract to approximately 50% of that of DMSO vehicle control, and by the 4 compounds to 82% of control. The inhibition by the 4 compounds was negated in SOCS3 knockdown cells, whereas the inhibition by H. perforatum extract remained the same with SOCS3 knockdown. Quercetin positive control at 10 μM was able to significantly decrease LPS-induced PGE2 in cells with and without SOCS3 siRNA transfection.
Figure 2. LPS-induced macrophage production of PGE2 and NO.

Non-transfected, scrambled siRNA transfected, and SOCS3 siRNA transfected RAW264.7 macrophages were treated with DMSO vehicle control, H. perforatum extract at 30 μg/mL, the 4 compounds (P: pseudohypericin at 0.08 μM, Q: quercetin at 0.38 μM, A: amentoflavone at 0.03 μM, C: chlorogenic acid at 0.58 μM as in 30 μg/mL extract), and quercetin positive control at 10 μM. LPS-induced PGE2 (panel A) and NO (panel B) production are shown as percentage of non-transfected control with LPS induction (Mean ± SEM, n=3). The levels for PGE2 and NO were 0.04 ± 0.01 ng/mL and 0.01 ± 0.23 μM without LPS-stimulation and 4.54 ± 0.56 ng/mL and 24.1 ± 0.98 μM with LPS induction in non-transfected cells. * and ** highlight significant (p<0.05 and p<0.01) difference compared to non-transfected cells treated with DMSO vehicle control. # and ## indicate significant (p<0.05 and p<0.01) difference between SOCS3 knockdown cells and those without knockdown but receiving the same treatment.
As shown in Figure 2B, NO production induced by LPS was significantly inhibited by the extract and the 4 compounds to ~60% and ~70% of DMSO vehicle control respectively in non-transfected and control siRNA transfected cells. SOCS3 knockdown slightly but significantly decreased NO release with vehicle control treatment by 15%. The inhibition of NO production by the 4 compounds was compromised by SOCS3 knockdown from ~30% to ~10%, while the inhibition by the extract and quercetin positive control was not affected.
PGE2 and NO production without LPS induction averaged 0.04 ng/mL and ~0 μM, respectively, for DMSO vehicle control, with no difference observed among either treatments or transfection conditions.
2.5. Different effects on LPS-induced inflammatory cytokine production by H. perforatum extract and the 4 compounds with SOCS3 knockdown
We also assessed the impact of SOCS3 siRNA on cytokines secreted by RAW 264.7 macrophage cells. LPS-induced inflammatory cytokines IL-1β, IL-6 and TNF-α were quantified in cell culture supernatants collected after 24 h treatment with H. perforatum extract and the 4 compounds. Both the extract and the 4 compounds significantly inhibited IL-1β by ~30% compared to DMSO vehicle control in RAW 264.7 macrophages with and without SOCS3 knockdown (Figure 3A). Only the 4 compounds, but not H. perforatum extract, decreased LPS-induced IL-6 and TNF-α production by cells without SOCS3 knockdown by ~20% and 30%, respectively (Figure 3B and 3C). SOCS3 knockdown significantly reduced IL-6 and TNF-α in vehicle control and extract treated cells, and further inhibited both cytokines when treated with the 4 compounds.
Figure 3. LPS-stimulated macrophage inflammatory cytokine production.

Non-transfected, scrambled siRNA transfected, and SOCS3 siRNA transfected RAW264.7 macrophages were treated with DMSO vehicle control, H. perforatum extract at 30 μg/mL, and the 4 compounds (P: pseudohypericin at 0.08 μM, Q: quercetin at 0.38 μM, A: amentoflavone at 0.03 μM, C: chlorogenic acid at 0.58 μM). LPS-induced cytokines IL-1β (panel A), IL-6 (panel B), and TNF-α (panel C) production are shown as percentage of non-transfected control with LPS induction (Mean ± SEM, n=3). The levels for IL-1β, IL-6, and TNF-α without LPS induction were 83.2 ± 10 pg/mL, 0.04 ± 0.03 ng/mL, and 0.2 ± 0.3 ng/mL, as well as 488 ± 13 pg/mL, 12.6 ± 4.8 ng/mL, and 9.0 ± 0.2 ng/mL with LPS induction. * and ** highlight significant (p<0.05 and p<0.01) difference compared to non-transfected cells treated with DMSO vehicle control. ## indicates significant (p<0.01) difference between SOCS3 knockdown cells and those without knockdown but receiving the same treatment.
2.6. Inhibition of LPS-induced inflammatory response by combinations of the compounds with SOCS3 knockdown
In order to investigate whether the dependence on SOCS3 activation could be attributed to individual compound(s), we applied three of the 4 compounds individually and in combination: pseudohypericin (P), amentoflavone (A), P+A, P+quercetin (Q), Q+A, and P+Q+A to non-transfected, scrambled siRNA transfected, and SOCS3 siRNA transfected RAW 264.7 macrophages with LPS. Quercetin was not used by itself because we found it not able to inhibit either PGE2 or NO at a concentration of 0.38 μM (data not shown). Chlorogenic acid was excluded because Hammer et al. found it was the least important among the four (Hammer et al., 2008).
Figure 4A shows that besides the 4 compounds together, pseudohypericin, amentoflavone, and the combinations involving either or both of them significantly reduced PGE2 production by the macrophages without SOCS3 knockdown. SOCS3 knockdown compromised the inhibitory effect of treatments that contained pseudohypericin, but not those with amentoflavone or amentoflavone and quercetin. LPS-induced NO production by cells without SOCS3 knockdown was decreased by the 4 compounds, pseudohypericin alone, and all combinations that included pseudohypericin (Figure 4B). When SOCS3 was knocked down, quercetin plus amentoflavone was the only treatment that slightly, yet significantly reduced NO production. All treatments except for pseudohypericin alone inhibited IL-1β production by cells with and without SOCS3 knockdown (Figure 4C). The production of TNF-α was lowered by the 4 compounds, and combinations of individual compounds, but not by pseudohypericin or amentoflavone alone. When the SOCS3 gene was knocked down, TNF-α was significantly lowered within each treatment in comparison to their counterparts without knockdown (Figure 4D).
Figure 4. LPS-induced PGE2, NO, IL-1β, and TNF-α production by macrophages.

Non-transfected, scrambled siRNA transfected, and SOCS3 siRNA transfected RAW264.7 macrophages were treated with DMSO vehicle control and different combinations of the 4 compounds (P: pseudohypericin at 0.08 μM, Q: quercetin at 0.38 μM, A: amentoflavone at 0.03 μM, C: chlorogenic acid at 0.58 μM). LPS-induced PGE2 (panel A), NO (panel B), IL-1β (panel C), and TNF-α (panel D) production are shown as percentage of non-transfected control with LPS induction (Mean ± SEM, n=3). The 100% levels for PGE2, NO, IL-1β, and TNF-α were 3.7 ± 0.08 ng/mL, 23.7 ± 1.04 μM, 395 ± 10 pg/mL, and 11.7 ± 0.4 ng/mL, respectively. * and ^ highlight significant (p<0.05 and p<0.01) difference compared to non-transfected cells treated with DMSO vehicle control. # and ## indicate significant (p<0.05 and p<0.01) difference between SOCS3 knockdown cells and those without knockdown but receiving the same treatment.
2.7. Expression of COX-2, iNOS and SOCS3 proteins in SOCS3 knockdown macrophages after H. perforatum extract and 4 compounds treatments
Protein expression levels of COX-2 after 8 h treatment with H. perforatum extract or the 4 compounds, of iNOS after 24 h treatment, and of SOCS3 after 8 and 24 h treatment in macrophages with or without SOCS3 knockdown were assayed by Western blot.
After an 8 h induction with LPS stimulation, COX-2 protein abundance was significantly elevated, as shown in Figure 5A. Quercetin positive control at 100 μM was able to reduce the expression of COX-2. No effect was seen with either the plant material treatments or SOCS3 knockdown compared to the DMSO non-transfected control.
Figure 5. COX-2, iNOS, and SOCS3 protein expression.

Non-transfected, scrambled siRNA transfected, and SOCS3 siRNA transfected RAW264.7 macrophages were treated with DMSO vehicle control, H. perforatum extract at 30 μg/mL, and the 4 compounds (P: pseudohypericin at 0.08 μM, Q: quercetin at 0.38 μM, A: amentoflavone at 0.03 μM, C: chlorogenic acid at 0.58 μM) with 1 μg/mL LPS induction. Non-transfected cells were also treated with DMSO without LPS and quercetin positive control at 100 μM with LPS. COX-2 (panel A) and SOCS3 (panel B) protein abundance after an 8 h treatment, as well as iNOS (panel C) protein abundance after a 24 h treatment are shown as percentage of non-transfected DMSO vehicle control with LPS induction (Mean ± SEM, n=3). * and ** highlight significant (p<0.05 and p<0.01) difference compared to non-transfected DMSO control with LPS stimulation. Representative experiment gel images are provided showing the COX-2 (8h) and SOCS3 (8h), and iNOS (24h) expression levels identified with Western blotting in single cultures. (ND=not determined)
LPS treatment significantly raised SOCS3 expression at 8 h and 24 h post treatment, which was further elevated by approximately 20% at both time points with H. perforatum extract and the 4 compounds treatments, as indicated in Figure 5B (data at 8 h provided). SOCS3 specific siRNA knockdown negated the LPS-induced activation of SOCS3 expression. The increase of SOCS3 expression by the extract and 4 compounds were not seen in SOCS3 knockdown cells.
iNOS protein expression profiles after 24 h treatment are demonstrated in Figure 5C. LPS significantly increased iNOS expression, which was dampened by quercetin positive control. Neither H. perforatum extract nor the 4 compounds significantly affected LPS-induced iNOS expression. However, SOCS3 knockdown slightly, but significantly elevated the amount of iNOS enzyme compared to non-transfected vehicle control.
α-Tubulin protein expression was measured at both 8 h and 24 h time points and no difference in expression was observed with SOCS3 knockdown or plant material treatments (Supplemental Figure 2).
2.8. Enzyme activity of LPS-induced COX-2 and iNOS in SOCS3 knockdown macrophages after H. perforatum extract and the 4 compounds treatments
Activities of enzymes COX-2 and iNOS in LPS-stimulated RAW 264.7 macrophages were assessed as described in the methods, with results depicted in Figure 6. Figure 6A indicates that H. perforatum extract and the 4 compounds inhibited COX-2 enzyme activity in cells without SOCS3 knockdown by ~50% and ~40%, respectively. When SOCS3 gene was knocked down, COX-2 activity in DMSO vehicle control and 4 compounds treated cells were nearly doubled, however, this doubling was blocked in the extract treated cells. On the other hand, neither the treatments nor SOCS3 knockdown altered the activity of iNOS in the macrophages (Figure 6B).
Figure 6. Enzyme activities of COX-2 and iNOS.

Non-transfected, scrambled siRNA transfected, and SOCS3 siRNA transfected RAW264.7 macrophages were treated with DMSO vehicle control, H. perforatum extract at 30 μg/mL, and the 4 compounds (P: pseudohypericin at 0.08 μM, Q: quercetin at 0.38 μM, A: amentoflavone at 0.03 μM, C: chlorogenic acid at 0.58 μM) with 1 μg/mL LPS induction. Enzyme activity of LPS-induced COX-2 (panel A) and iNOS (panel B) an 8 h or 24 h treatment are shown as percentage of non-transfected DMSO vehicle control (Mean ± SEM, n=3). The 100% levels for LPS-stimulated COX-2 and iNOS enzyme activity were 22.1 ± 1.7 and 4.8 ± 0.4 nM/min/mL. Without LPS induction, COX-2 and iNOS activity were 3.7 ± 1.3 and 0.3 ± 0.2 nM/min/mL, respectively. * and ** highlight significant (p<0.05 and p<0.01) difference compared to non-transfected DMSO control.
3. Discussion
SOCS3 has been shown to be important for the regulation of signal transduction within innate and adaptive immune cells, including in macrophages during LPS stimulation (Baetz et al., 2004; Yoshimura et al., 2007). Berlato et al. (Berlato et al., 2002) and Qasimi et al. (Qasimi et al., 2006) found that the presumptive anti-inflammatory cytokine IL-10 inhibited TNF-α and NO production by activated macrophages through the activation of SOCS3. Nevertheless, certain microorganisms such as influenza A virus and probiotic Bifidobacterium are able to compromise host immune response or inhibit inflammation by increasing SOCS3 expression (Okada et al., 2009; Pauli et al., 2008).
Previous research by Hammer et al. identified a group of 4 compounds comprised of pseudohypericin, amentoflavone, quercetin and chlorogenic acid that synergistically accounted for the majority of the PGE2 inhibition by an active H. perforatum fraction (Hammer et al., 2008). Subsequent studies demonstrated that 8 h to 24 h after treatment, LPS-activated SOCS3 activation was further elevated by a fraction of H. perforatum ethanol extract and the 4 compounds (Hammer et al., 2010). This observation provided the foundation for studying the role of SOCS3 activation in the anti-inflammatory activity of H. perforatum extract and the 4 compounds. For this purpose, we employed SOCS3 specific siRNA transfection to transiently knockdown SOCS3 expression in RAW 264.7 macrophages. Figure 1 shows that LPS treatment increased SOCS3 mRNA transcription and protein expression, which were considerably dampened by siRNA transfection, thus confirming the knockdown. Although the knockdown did not reduce the SOCS3 expression below the background level without LPS-induction, it provided the foundation for the remainder of the current study since the effects of Hypericum on LPS induced activities were the main research interest of the current study.
The 4 compounds were originally identified by Hammer et al. as the major contributor to the anti-inflammatory activity of an active 3rd round fraction from a H. perforatum extract (Hammer et al., 2008). Due to the enrichment and potential optimization of the proportion of active compounds during activity-guided fractionation, fraction 3A at 10 μg/mL concentration was able to inhibit PGE2 by 78%, which was more than the extract at 30 μg/mL used in this study. In the current study, we associated the activity of the whole ethanol extract, a commonly consumed form of H. perforatum material, to that of the 4 compounds in the hope to better unveil the mechanism by which different constituents exert their anti-inflammatory potential. Table 1 provides the concentrations of the 4 compounds used to compare with the extract in the present investigation, as well as in the original four component system. It is apparent that the concentration and ratio of individual compounds in the extract was different from that of the four component system, and we assumed that there were many additional compounds in the extract that might interact with the 4 compounds.
In addition to PGE2, we included NO in the current study as another macrophage inflammation marker to allow us to have a more comprehensive insight on the studied anti-inflammatory extracts and components (Huang et al., 2009; Tedeschi et al., 2003). Consistent with our prior findings, both H. perforatum extract and the combinations of key constituents significantly decreased LPS-induced PGE2 and NO production in macrophages. As expected, due to the greater amount and variety of constituents in H. perforatum extract, the 4 compounds accounted for less of the overall activity of the extract than they did for the sub-fraction used previously by Hammer et al. (Hammer et al., 2008). One key observation in this study was that SOCS3 knockdown negated PGE2 inhibition and significantly compromised NO inhibition by the 4 compounds, but not by the extract. This partially supported the suggested pivotal role of SOCS3 activation in the inhibition of LPS-induced PGE2 and NO by the 4 compounds, but at the same time hinted at the existence of alternative, SOCS3 independent pathways that contributed to the activity of H. perforatum extract. This led us to the subsequent study in individual and combinations of compounds’ dependence on SOCS3 for their inhibition on LPS-induced inflammatory response.
Cytokine secretion is a fundamental part of macrophage inflammatory response to LPS stimulation. H. perforatum extract and the 4 compounds were able to inhibit IL-1β by ~30%, which was not affected by SOCS3 knock-down. IL-6 and TNF-α were attenuated only by the 4 compounds but not by the ethanol extract of H. perforatum. SOCS3 knockdown significantly lowered IL-6 and TNF-α compared to the cells receiving the same treatment but without knockdown, which was consistent with observations of Liu et al. (Liu et al., 2008a) and Liu et al. (Liu et al., 2008b). Our findings in general indicated that the inhibitory effects of H. perforatum extract and the 4 compounds on these cytokines were independent of SOCS3 activation. The fact that only the 4 compounds were able to inhibit IL-6 and TNF-α, while no significant reduction was noted in extract-treated cells suggested that a potential interaction between these constituents and other compounds in the extract may have compromised potential inhibition. This was also similar to our previous studies, in which Hammer et al. detected inhibition of TNF-α by the four component system but not by fraction 3A which was rich in the noted four compounds (Hammer et al., 2008).
As stated above, we were interested in identifying constituents that depend on SOCS3 activation to exert anti-inflammatory activity. Because chlorogenic acid, which only modestly enhanced the activity of the other constituents, was apparently the least important of the 4 compounds (Hammer et al., 2008), we only explored applying combinations of the other three compounds to macrophages with and without SOCS3 knockdown. The results indicated mechanistic similarities as well as differences between the inhibition on PGE2 and NO. Pseudohypericin was capable of reducing both PGE2 and NO by itself through a potential SOCS3 dependent mechanism, whereas amentoflavone alone significantly decreased LPS-induced PGE2 production without being affected by SOCS3 knockdown. Therefore, we not only confirmed our previous finding that pseudohypericin was the primary contributor among the four in inhibiting PGE2, but further identified it as the major player in inhibiting NO. In contrast to Hammer et al., our results found that amentoflavone and quercetin were able to inhibit the inflammatory mediators alone without the presence of pseudohypericin, although this could have been due to the higher concentration of amentoflavone in the extract used here. It also appeared that pseudohypericin was the only constituent necessary for the 4 compounds’ dependence on SOCS3 activation to exert anti-inflammatory potential. Aside from PGE2 and NO, we also measured the inhibition on IL-1β and TNF-α. In addition to 4 compounds together, combinations of two or three of pseudohypericin, amentoflavone, and quercetin also repressed IL-1β and TNF-α without requiring SOCS3 elevation. Amentoflavone alone was found to inhibit IL-1β by a similar magnitude as the 4 compounds, implying its key role in cytokine inhibition.
In order to further explore the mechanism through which the four compounds SOCS3-dependently inhibit PGE2 and NO production, we measured the protein expression levels of COX2, iNOS, and SOCS3, as well as activity of critical enzymes COX2 and iNOS at 8 h or 24 h time point after treatment.
SOCS3 protein was significantly elevated by LPS stimulation, and further magnified by treatments of extract and the 4 compounds. This was in accordance to what Hammer et al. reported in studies of mRNA transcription (Hammer et al., 2010). SOCS3 siRNA transfection dampened the activation of SOCS3 and leveled its expression among all treatments. Other than with 100 μM quercetin in the positive control, no change in LPS-induced COX-2 protein abundance was observed. SOCS3 knockdown did not affect COX-2 protein abundance. Neither did the extract or the 4 compounds decrease LPS-induced iNOS expression, which was found slightly increased by SOCS3 knockdown. Despite seeing the same change in cytokines in SOCS3 knockdown macrophages, our results on NO and iNOS were different from what Liu et al reported, where no change in iNOS and a decrease in NO production were found (Liu et al., 2008b). Our observation could relate to our use of a different cell line, but the reason for the discrepancy between iNOS and NO remains unclear. Based on what we have seen, the inhibition of PGE2 and NO by H. perforatum extract and the 4 compounds were not mediated through direct reduction of COX-2 and iNOS proteins.
We then assessed whether changes in enzyme activity, without altering enzyme abundance, could explain the reduced production of PGE2 and NO. COX-2 activity was inhibited by more than 40% when cells were treated with H. perforatum extract and the 4 compounds, which could account for the reduced PGE2 production. SOCS3 knockdown increased COX2 activity to almost two-fold in cells treated with vehicle control and 4 compounds, but not in cells treated with extract. As far as we know, this was the first time an increased COX2 activity has been reported in cells with SOCS3 knockdown. Our results suggested interference of the SOCS3-mediated negative regulation of COX2 activity by constituents in the extract other than the four compounds, in line with the observed SOCS3 independent inhibition of PGE2 by the extract. It is interesting to see that increased COX-2 activity in SOCS3 knockdown cells did not lead to elevated PGE2 production. Given that SOCS3 has been associated with both pro- and anti-inflammatory regulations, other enzymes in eicosanoid biosynthesis pathways, such as phospholipase A2 or prostaglandin reductase, may have been affected by its knockdown and contributed to the observations (Rawlings et al., 2004; Yoshimura et al., 2007). LPS-induced iNOS activity was not changed by either the treatments or SOCS3 knockdown in this study. These observations suggest possible mechanisms of NO inhibition by the extract and the 4 compounds related either to L-arginine supply restriction or direct NO scavenging (Mirkov et al., 2004). The interactions between SOCS3 and PGE2 or NO inhibition were not clarified by the current study and will require future investigation.
The evaluation of the role of SOCS3 in the anti-inflammatory activity of H. perforatum ethanol extract and compounds provides evidence of potential intracellular targets for select compounds in this extract. This could potentially be helpful in guiding the usage of related supplements. At the same time, as certain pathogens rely on SOCS3 activation to evade host defense, there may be underlying risks in using H. perforatum supplements that are rich in the noted 4 compounds during specific conditions that require an agile adaptive immune response (Kubo et al., 2003).
4. Conclusion
The current study demonstrated that the SOCS3 activation was critical for the inhibition of LPS-induced PGE2 and NO by the 4 compounds in H. perforatum ethanol extract, but not for the inhibition of these mediators by the extract itself. Among the 4 compounds, pseudohypericin was identified to rely on SOCS3 activation to exert anti-inflammatory potential. The connection between SOCS3 elevation and PGE2/NO inhibition by H. perforatum extract and the 4 compounds remains largely unknown, but the existence of alternative mechanisms besides SOCS3 elevation for mediating the 4 compounds’ and H. perforatum’s anti-inflammatory potential were suggested.
5. Methods and Materials
5.1. Plant materials
All plant material of H. perforatum (Accession PI 325351) was acquired in 2008 from the North Central Regional Plant Introduction Station (NCRPIS) (Ames, IA) of the U.S. Department of Agriculture, Agricultural Research Service (USDA/ARS), using methods described in Schimitt el al. (Schmitt et al., 2006a).
5.2. Extraction and Fractionation of H. perforatum
Six grams of dried and ground H. perforatum (Accession PI 325351) were extracted for 6 h via Soxhlet with 500 mL 95% ethanol. The extract was then filtered and subsequently dried by rotary evaporation at 40 °C followed by lyophilization. The dried extract was dissolved in dimethyl sulfoxide (DMSO) to 139.2 mg/mL stock concentration and stored without light exposure at −20 °C.
5.3. LC-ESI-MS-UV quantification of chemically-defined compounds
Specific compounds were quantified by subjecting extracts to analysis on an Agilent Technologies Ion Trap 1100 mass spectrometer, coupled with a UV absorption detector (LC-ESI-MS-UV). A Zorbax Eclipse Plus C8 3.5 μm, 2.1 × 150 mm column (Agilent, Santa Clara, CA) was used for separation. The mobile phase was a gradient formed between acetonitrile/methanol 9:1 v/v (solvent B) and 10 mM ammonium acetate (solvent A) maintained at 40 °C. The gradient was initially at 85% A/15% B and changed over a 10 min period to 80% A/20% B, then to 100% B over a 25 min period, and was held at 100% B for 5 min. The flow rate was 0.17 mL/min (Hillwig et al., 2008). All solvents were HPLC grade (Sigma, St. Louis, MO).
5.4. Chemicals
Pseudohypericin at 98% purity was purchased from Axxora (San Diego, CA). Quercetin, amentoflavone and chlorogenic acid at ≥ 98%, ≥ 99% and ≥ 95% purity (reported by manufacturer), respectively, were purchased from Sigma Aldrich (St. Louis, MO). Upon arrival, these chemicals were dissolved in DMSO to 100 μM stock concentration, protected from light exposure and stored in −20 °C.
5.5. Cell Culture and Treatment with Plant Materials
RAW 264.7 mouse macrophages (American Type Culture Collection, Manassas, VA) were cultured in high-glucose Dulbecco’s Modified Eagle’s medium supplemented with 100 IU/mL penicillin/streptomycin, 10% fetal bovine serum and 1% sodium bicarbonate (all from Invitrogen, Carlsbad, CA) as described by Hammer et al. (Hammer et al., 2007). Cells were incubated under 5% carbon dioxide at 37 °C. Treatments of extract and pure compounds were applied for PGE2, NO, and cytotoxicity assays, Western blotting, and quantitative real-time PCR (qRT-PCR) were done as previously described (Hammer et al., 2010; Huang et al., 2009). Due to the light-activation required for the inhibitory properties of naphthodianthrone compounds in H. perforatum on LPS-induced PGE2, all experiments were conducted in the dark except for exposure to 30 min standard fluorescent lamp light-activation at the beginning of incubation with treatments (Schmitt et al., 2006a).
5.6. SOCS3 Knockdown RAW264.7 Mouse Macrophages
Cells were plated in 6-well plates and incubated to 60% confluence before transfection. Mouse SOCS3 specific siRNA (sc-41001) and scrambled control siRNA (sc-44230) in transfection medium (sc-36868) at 5 μg/mL were mixed with equal volumes of medium containing 6.7% (v/v) transfection reagent (sc-29528) and incubated for 45 min at room temperature (Santa Cruz Biotechnology, Santa Cruz, CA). Cells were washed with transfection medium twice before application of 100 μL of the mixture of siRNA and transfection reagent followed by 800 μL of transfection medium. After the 6 h initial incubation, 1 mL fresh high-glucose DMEM medium supplemented with 20% serum, 20% sodium bicarbonate, and 200 IU/mL penicillin/streptomycin (all from Invitrogen, Carlsbad, CA) were added to each well. Supernatant was replaced with 2 mL normal medium as described in the cell culture methods 24 h from the beginning of transfection. Non-transfected cells were treated with transfection reagent alone without siRNA and used as a control in the assays. After an additional 24 h incubation, cells were resuspended and plated in 6/24/48-well plates or Petri dishes for treatment.
5.7. Cell Viability Measurement
The H. perforatum extract and pure compounds that were screened for bio-activity were also tested for cytotoxicity using the protocol described in Huang et al. (Huang et al., 2009) with the addition of 30 min light activation. In brief, RAW 264.7 macrophages with and without SOCS3 siRNA transfection, plated in 48-well plates, were treated with H. perforatum extract at 30 μg/mL and the four components at 10 times of their concentrations in the extract for 30 min light activation and 23.5 h incubation, followed by measurement of cell viability with Celltiter96 Aqueous One Solution Cell Proliferation Assay (Promega, Madison, WI).
5.8. Prostaglandin E2, Nitric Oxide and Inflammatory Cytokine Measurement
The supernatant in cell culture wells was collected after 8 h treatment for PGE2 assay, or after 24 h treatment for NO and cytokine assays, respectively. PGE2 was measured with Biotrek PGE2 enzyme immune assay (GE Healthcare, Piscataway, NJ) and NO levels with Griess reagent (Promega, Madison, WI) using protocols reported before (Schmitt et al., 2006b). Concentrations of interleukin (IL)-1β, IL-6, and tumor necrosis factor (TNF)-α in the supernatant were measured using enzyme-linked immunosorbent assay (ELISA) kits (BD Biosciences, Franklin Lakes, NJ) according to the manufacturer’s instructions.
5.9. RNA Extraction and qRT-PCR
After treatment with or without LPS in 6-well plates, cells were collected using a rubber policeman following PBS washes. RNA from the cells was extracted using the Trizol (Invitrogen) method (Hammer et al., 2010). To further purify the extracted RNA, an RNeasy purification kit was used with RNAse-free DNAse (Qiagen, Valencia, CA) (Lalone et al., 2010). RNA quality and quantity were then assessed using a NanoDrop 1000 spectrophotometer (NanoDrop Products, Wilmington, DE).
The purified RNA was reverse-transcripted to cDNA using an iScript cDNA synthesis kit as previously described (Hammer et al., 2010), followed by quantification using an iCycler coupled with a MyiQ optical module (all from BioRad, Hercules, CA) under the conditions: 95 °C for 5 min, 40 cycles of 95 °C for 30 s, 56 °C for 30 s, 72 °C for 30 s, followed by 95 °C for 1 min, and 55 °C for 1 min. Primers used were adopted from Hammer et al. with an annealing temperature of 55 °C and acquired from Integrated DNA Technologies, Inc. (Coralville, IA) (Hammer et al., 2010). The sequence of primers was: 5′-ATTCACCCAGGTGGCTACAG-3′ (sense) and 5′-GCCAATGTCTTCCCAGTGTT-3′ (anti-sense) for SOCS3; 5′-CAATGTGTCCGTCGTGGAT-3′ (sense) and 5′-AGCCCAAGATGCCCTTCAG-3′ (anti-sense) for the housekeeping gene glyceraldehydes 3-phosphate dehydrogenase (GAPDH).
5.10. Enzyme Expression and Activity Measurement
Cell lysate was collected after 8 h or 24 h treatment in Petri dishes with plant materials or pure compounds (Huang et al., 2009). The concentration of protein was determined with BCA assay and equal amount of protein from each treatment was separated in SDS-PAGE gel followed by blotting, antibody incubation and ECL detection (GE Healthcare, Piscataway, NJ) (Hammer et al., 2007). Primary antibodies were used against SOCS3 (sc-51699), COX-2 (sc-19999), iNOS (sc-7271), and α-tubulin (sc-8035) with dilutions of 1:1000, 1:1000, 1:600, and 1:2000, respectively (Huang et al., 2009). Relative protein amount was quantified using arbitrary densities reported by Quantity One program (Bio-Rad, Hercules, CA).
Enzyme activities of COX and iNOS were measured with a COX Fluorescent Activity Assay Kit and a NOS Activity Assay Kit (Cayman Chemicals, Ann Arbor, MI), respectively, according to manufacturer’s instructions (Lalone et al., 2010).
5.11. Statistical Analysis
Cell viability, PGE2, NO, enzyme protein amount, enzyme activity, and mRNA expression level were analyzed using a randomized complete block ANOVA with cell culture plates as a fixed block. PGE2 and mRNA expression levels were log-transformed before the analysis to achieve normal distribution. All treatments with or without LPS stimulation were compared to the media + DMSO vehicle control, and the percentage of vehicle control was reported in mean ± SEM for each treatment. Subsequent multiple comparisons between individual treatments and the vehicle control were made using pairwise student t test. Comparisons between different treatments were made using Tukey adjustment (SAS 9.0 SAS Institute, Cary, NC).
Supplementary Material
Acknowledgments
We give special thanks to members of the Center for Research on Botanical Dietary Supplements of Iowa State University for their continuous support. We also appreciate the analytical instrumentation support from the W. M. Keck Metabolomics Research Laboratory, at Iowa State University.
Footnotes
Publisher's Disclaimer: This is a PDF file of an unedited manuscript that has been accepted for publication. As a service to our customers we are providing this early version of the manuscript. The manuscript will undergo copyediting, typesetting, and review of the resulting proof before it is published in its final citable form. Please note that during the production process errors may be discovered which could affect the content, and all legal disclaimers that apply to the journal pertain.
Contributor Information
Nan Huang, Email: huangnan@iastate.edu.
Ludmila Rizshsky, Email: ludmilar@iastate.edu.
Catherine C. Hauck, Email: cchauck@iastate.edu.
Basil J. Nikolau, Email: dimmas@iastate.edu.
Patricia A. Murphy, Email: pmurphy@iastate.edu.
References
- Baetz A, Frey M, Heeg K, Dalpke AH. Suppressor of cytokine signaling (SOCS) proteins indirectly regulate toll-like receptor signaling in innate immune cells. J Biol Chem. 2004;279:54708–54715. doi: 10.1074/jbc.M410992200. [DOI] [PubMed] [Google Scholar]
- Berlato C, Cassatella MA, Kinjyo I, Gatto L, Yoshimura A, Bazzoni F. Involvement of suppressor of cytokine signaling-3 as a mediator of the inhibitory effects of IL-10 on lipopolysaccharide-induced macrophage activation. J Immunol. 2002;168:6404–6411. doi: 10.4049/jimmunol.168.12.6404. [DOI] [PubMed] [Google Scholar]
- Bjorkbacka H, Fitzgerald KA, Huet F, Li X, Gregory JA, Lee MA, Ordija CM, Dowley NE, Golenbock DT, Freeman MW. The induction of macrophage gene expression by LPS predominantly utilizes Myd88-independent signaling cascades. Physiol Genomics. 2004;19:319–330. doi: 10.1152/physiolgenomics.00128.2004. [DOI] [PubMed] [Google Scholar]
- Hammer KD, Hillwig ML, Neighbors JD, Sim YJ, Kohut ML, Wiemer DF, Wurtele ES, Birt DF. Pseudohypericin is necessary for the light-activated inhibition of prostaglandin E2 pathways by a 4 component system mimicking an Hypericum perforatum fraction. Phytochemistry. 2008;69:2354–2362. doi: 10.1016/j.phytochem.2008.06.010. [DOI] [PMC free article] [PubMed] [Google Scholar]
- Hammer KD, Hillwig ML, Solco AK, Dixon PM, Delate K, Murphy PA, Wurtele ES, Birt DF. Inhibition of prostaglandin E(2) production by anti-inflammatory hypericum perforatum extracts and constituents in RAW264.7 Mouse Macrophage Cells. J Agric Food Chem. 2007;55:7323–7331. doi: 10.1021/jf0710074. [DOI] [PMC free article] [PubMed] [Google Scholar]
- Hammer KD, Yum MY, Dixon PM, Birt DF. Identification of JAK-STAT pathways as important for the anti-inflammatory activity of a Hypericum perforatum fraction and bioactive constituents in RAW 264.7 mouse macrophages. Phytochemistry. 2010;71:716–725. doi: 10.1016/j.phytochem.2010.02.006. [DOI] [PMC free article] [PubMed] [Google Scholar]
- Hillwig ML, Hammer KD, Birt DF, Wurtele ES. Characterizing the metabolic fingerprint and anti-inflammatory activity of Hypericum gentianoides. J Agric Food Chem. 2008;56:4359–4366. doi: 10.1021/jf800411v. [DOI] [PMC free article] [PubMed] [Google Scholar]
- Hu X, Chen J, Wang L, Ivashkiv LB. Crosstalk among Jak-STAT, Toll-like receptor, and ITAM-dependent pathways in macrophage activation. J Leukoc Biol. 2007;82:237–243. doi: 10.1189/jlb.1206763. [DOI] [PubMed] [Google Scholar]
- Hu ZP, Yang XX, Chan SY, Xu AL, Duan W, Zhu YZ, Sheu FS, Boelsterli UA, Chan E, Zhang Q, Wang JC, Ee PL, Koh HL, Huang M, Zhou SF. St. John’s wort attenuates irinotecan-induced diarrhea via down-regulation of intestinal pro-inflammatory cytokines and inhibition of intestinal epithelial apoptosis. Toxicol Appl Pharmacol. 2006;216:225–237. doi: 10.1016/j.taap.2006.05.020. [DOI] [PubMed] [Google Scholar]
- Huang N, Hauck C, Yum MY, Rizshsky L, Widrlechner MP, McCoy JA, Murphy PA, Dixon PM, Nikolau BJ, Birt DF. Rosmarinic acid in Prunella vulgaris ethanol extract inhibits lipopolysaccharide-induced prostaglandin E2 and nitric oxide in RAW 264.7 mouse macrophages. J Agric Food Chem. 2009;57:10579–10589. doi: 10.1021/jf9023728. [DOI] [PMC free article] [PubMed] [Google Scholar]
- Kubo M, Hanada T, Yoshimura A. Suppressors of cytokine signaling and immunity. Nat Immunol. 2003;4:1169–1176. doi: 10.1038/ni1012. [DOI] [PubMed] [Google Scholar]
- Lalone CA, Huang N, Rizshsky L, Yum MY, Singh N, Hauck C, Nikolau BJ, Wurtele ES, Kohut ML, Murphy PA, Birt DF. Enrichment of Echinacea angustifolia with Bauer Alkylamide 11 and Bauer Ketone 23 Increased Anti-inflammatory Potential through Interference with COX-2 Enzyme Activity. J Agric Food Chem. 2010;58:8573–8584. doi: 10.1021/jf1014268. [DOI] [PMC free article] [PubMed] [Google Scholar]
- Libby P. Inflammatory mechanisms: the molecular basis of inflammation and disease. Nutr Rev. 2007;65:S140–146. doi: 10.1111/j.1753-4887.2007.tb00352.x. [DOI] [PubMed] [Google Scholar]
- Liu X, Zhang Y, Yu Y, Yang X, Cao X. SOCS3 promotes TLR4 response in macrophages by feedback inhibiting TGF-beta1/Smad3 signaling. Mol Immunol. 2008a;45:1405–1413. doi: 10.1016/j.molimm.2007.08.018. [DOI] [PubMed] [Google Scholar]
- Liu Y, Stewart KN, Bishop E, Marek CJ, Kluth DC, Rees AJ, Wilson HM. Unique expression of suppressor of cytokine signaling 3 is essential for classical macrophage activation in rodents in vitro and in vivo. J Immunol. 2008b;180:6270–6278. doi: 10.4049/jimmunol.180.9.6270. [DOI] [PubMed] [Google Scholar]
- Mirkov SM, Djordjevic AN, Andric NL, Andric SA, Kostic TS, Bogdanovic GM, Vojinovic-Miloradov MB, Kovacevic RZ. Nitric oxide-scavenging activity of polyhydroxylated fullerenol, C60(OH)24. Nitric Oxide. 2004;11:201–207. doi: 10.1016/j.niox.2004.08.003. [DOI] [PubMed] [Google Scholar]
- Ohmori Y, Hamilton TA. Requirement for STAT1 in LPS-induced gene expression in macrophages. J Leukoc Biol. 2001;69:598–604. [PubMed] [Google Scholar]
- Okada Y, Tsuzuki Y, Hokari R, Komoto S, Kurihara C, Kawaguchi A, Nagao S, Miura S. Anti-inflammatory effects of the genus Bifidobacterium on macrophages by modification of phospho-I kappaB and SOCS gene expression. Int J Exp Pathol. 2009;90:131–140. doi: 10.1111/j.1365-2613.2008.00632.x. [DOI] [PMC free article] [PubMed] [Google Scholar]
- Pauli EK, Schmolke M, Wolff T, Viemann D, Roth J, Bode JG, Ludwig S. Influenza A virus inhibits type I IFN signaling via NF-kappaB-dependent induction of SOCS-3 expression. PLoS Pathog. 2008;4:e1000196. doi: 10.1371/journal.ppat.1000196. [DOI] [PMC free article] [PubMed] [Google Scholar]
- Qasimi P, Ming-Lum A, Ghanipour A, Ong CJ, Cox ME, Ihle J, Cacalano N, Yoshimura A, Mui AL. Divergent mechanisms utilized by SOCS3 to mediate interleukin-10 inhibition of tumor necrosis factor alpha and nitric oxide production by macrophages. J Biol Chem. 2006;281:6316–6324. doi: 10.1074/jbc.M508608200. [DOI] [PubMed] [Google Scholar]
- Qin H, Niyongere SA, Lee SJ, Baker BJ, Benveniste EN. Expression and functional significance of SOCS-1 and SOCS-3 in astrocytes. J Immunol. 2008;181:3167–3176. doi: 10.4049/jimmunol.181.5.3167. [DOI] [PMC free article] [PubMed] [Google Scholar]
- Raso GM, Pacilio M, Di Carlo G, Esposito E, Pinto L, Meli R. In-vivo and in-vitro anti-inflammatory effect of Echinacea purpurea and Hypericum perforatum. J Pharm Pharmacol. 2002;54:1379–1383. doi: 10.1211/002235702760345464. [DOI] [PubMed] [Google Scholar]
- Rawlings JS, Rosler KM, Harrison DA. The JAK/STAT signaling pathway. J Cell Sci. 2004;117:1281–1283. doi: 10.1242/jcs.00963. [DOI] [PubMed] [Google Scholar]
- Schmitt LA, Liu Y, Murphy PA, Birt DF. Evaluation of the light-sensitive cytotoxicity of Hypericum perforatum extracts, fractions, and pure compounds. J Agric Food Chem. 2006a;54:2881–2890. doi: 10.1021/jf052344k. [DOI] [PMC free article] [PubMed] [Google Scholar]
- Schmitt LA, Liu Y, Murphy PA, Petrich JW, Dixon PM, Birt DF. Reduction in hypericin-induced phototoxicity by Hypericum perforatum extracts and pure compounds. J Photochem Photobiol B. 2006b;85:118–130. doi: 10.1016/j.jphotobiol.2006.06.001. [DOI] [PMC free article] [PubMed] [Google Scholar]
- Tedeschi E, Menegazzi M, Margotto D, Suzuki H, Forstermann U, Kleinert H. Anti-inflammatory actions of St. John’s wort: inhibition of human inducible nitric-oxide synthase expression by down-regulating signal transducer and activator of transcription-1alpha (STAT-1alpha) activation. J Pharmacol Exp Ther. 2003;307:254–261. doi: 10.1124/jpet.103.054460. [DOI] [PubMed] [Google Scholar]
- Yoshimura A, Naka T, Kubo M. SOCS proteins, cytokine signalling and immune regulation. Nat Rev Immunol. 2007;7:454–465. doi: 10.1038/nri2093. [DOI] [PubMed] [Google Scholar]
Associated Data
This section collects any data citations, data availability statements, or supplementary materials included in this article.