Abstract
The objective of present study was to evaluate the effect of oleic acid modified polymeric bilayered nanoparticles (NPS) on combined delivery of two anti-inflammatory drugs, spantide II (SP) and ketoprofen (KP) on the skin permeation. NPS were prepared using poly(lactic-co-glycolic acid) (PLGA) and chitosan. SP and KP were encapsulated in different layers alone or/and in combination (KP-NPS, SP-NPS and SP+KP-NPS). The surface of NPS was modified with oleic acid (OA) (`Nanoease' technology) using an established procedure in the laboratory (KP-NPS-OA, SP-NPS-OA and SP+KP-NPS-OA). Fluorescent dyes (DiO and DID) containing surface modified (DiO-NPS-OA and DID-NPS-OA) and unmodified NPS (DiO-NPS and DID-NPS) were visualized in lateral rat skin sections using confocal microscopy and Raman confocal spectroscopy after skin permeation. In vitro skin permeation was performed in dermatomed human skin and HPLC was used to analyze the drug levels in different skin layers. Further, allergic contact dermatitis (ACD) model was used to evaluate the response of KP-NPS, SP-NPS, SP+KP-NPS, KP-NPS-OA, SP-NPS-OA and SP+KP-NPS-OA treatment in C57BL/6 mice. The fluorescence from OA modified NPS was observed upto depth of 240 μm and was significantly higher as compared to non-modified NPS. The amount of SP and KP retained in skin layers from OA modified NPS increased by several folds compare to unmodified NPS and control solution. In addition, the combination index value calculated from ACD response for solution suggested additive effect and moderate synergism for NPS-OA. Our results strongly suggest that surface modification of bilayered nanoparticles with oleic acid improved drug delivery to the deeper skin layers.
Keywords: Topical skin delivery, Polymeric nanoparticles, Oleic acid, Allergic contact dermatitis, PLGA, chitosan
1. Introduction
Percutaneous delivery is advantageous for skin diseases where the target site is present in the deep epidermis (e.g. fungal, bacterial, viral- infections, psoriasis, dermatitis and skin cancers like melanoma). In addition, skin delivery offers several advantages over the conventional oral and intravenous dosage forms such as prevention of first pass metabolism, minimization of pain and possible controlled release of drugs [1]. However, foremost layer of the skin, stratum corneum (SC), acts as the main barrier between the body and the environment and limits the delivery of most drugs [1–2]. To deliver sufficient amount of drug into the deeper layers of skin, various attempts have been made by several approaches such as chemical enhancement including permeation enhancers [3], prodrug [4] and iontophoresis [5] along with microneedle pretreatment, ultrasound [6] and electroporation [7]. But each of these techniques has its respective problems in terms of toxicity and therapeutic feasibility.
Nanotechnology is one of the advanced and non-invasive technique adopted for improving skin permeation of various drugs [8]. Various biocompatible and biodegradable synthetic or semi-synthetic polymers, including polylactic acid (PLA) [9], poly(lactic-co-glycolic acid) (PLGA) [10], poly(ε-caprolactone) [11], chitosan [12] have shown promise in topical and transdermal drug delivery. Several studies have been reported on preparation and characterization of polymeric biodegradable nanoparticles as skin delivery systems due to their potential usefulness in increasing efficacy, reducing enzymatic degradation, controlling release rates and high encapsulation efficiency [9–11, 13–14]. The most commonly used polymer for the preparation of these carriers is PLGA that is well known to be safe, biocompatible, non-toxic and is restorable through natural pathways [15]. Further, chitosan is a promising and often used candidate for surface modification due to its biocompatibility [16] and positive charge [17]. Though the polymer based nanoparticles offer advantage of controlled and sustained drug release with greater stability [13–14, 18], they have not been explored to a greater extend for dermal delivery. The limitation of polymeric nanoparticles is that they do not penetrate to SC but accumulate in skin furrows and hair follicles and create high local concentrations of loaded drugs which can further diffuse to the viable layers of the skin [9]. Nanoparticle composition and surface charge of polymeric nanoparticles appear to have significant effect on improvement of drug delivery to the deeper skin layers. Therefore, strategies for surface modification of polymeric nanoparticles for improving skin delivery are important and worth investigating.
Oleic acid (OA) is FDA approved potent chemical permeation enhancer and is widely used in commercial formulations. OA interacts with and modifies the lipid domains of the SC [19–20]. Electron microscopic study has suggested that lipid domain is stimulated within the SC bilayer lipids upon exposure to OA [21]. The formation of such pools provides permeability defects within the lipid bilayer and thus facilitates the permeation of cargo molecules into the deeper epidermal layers. Therefore, to enhance the delivery of nanocarriers into deep epidermis, we have developed a `Nanoease' technology where a well known penetration enhancer, oleic acid is used for surface modification of poly(lactic-co-glycolic acid)-chitosan bilayered nanoparticles (NPS-OA).
Recently combination therapy is gaining importance in various disease conditions because the combination of disease modifying drugs can act through different pathways and offer possibility of synergistic or additive effects [22] thus minimizing drug induced toxicities associated with higher dose of individual drug. We have selected two anti-inflammatory drugs namely, spantide II (SP) and ketoprofen (KP) which can be useful for the treatment of inflammatory skin disorders. SP has been shown to antagonize the neurokinin-1 receptors and inhibits inflammatory response associated with substance-P [23]. KP is a potent non-steroidal anti-inflammatory drug (NSAID) which inhibits arachidonic acid metabolism by potent inhibitory action on cyclooxygenase and lipooxygenase [24].
The present study was performed to investigate the effect of Nanoease nanoparticles (NPS-OA) for delivering their payloads into the epidermis and dermis. The NPS comprise of PLGA inner core with chitosan as an outer coat. The surface of NPS was modified using succinimidyl glutarate ester of PEGylated oleic acid (Oleic acid-PEG-succinimidyl glutarate ester) where PEG-1000 was used as a spacer and linked to OA to enhance the transport of NPS through SC. These NPS were used for simultaneous delivery of SP and KP, where SP was incorporated into PLGA core and KP was incorporated into chitosan coat.
2. Materials and Methods
PLGA was purchased from PURAC biomaterials (Lincolnshire, IL). Polyvinyl alcohol (PVA), low molecular weight chitosan (molecular weight – 50kDa; 75–85% degree of deacetylation), dichloromethane, tween 80, sodium tripolyphosphate (TPP), polyethylene glycol 400 (PEG-400), phosphate buffer saline (PBS, pH 7.4), sodium bicarbonate (NaHCO3), bovine serum albumin (BSA), trifluoroacetic acid (TFA), dexamethasone, 2,4,6-trinitrobenzene sulfonic acid (TNBS) and 2,4-dinitrofluorobenzene (DNFB) were purchased from Sigma-Aldrich Co (St Louis, MO). HPLC grade of acetonitrile, dichloromethane, water and ethanol were purchased from Sigma-Aldrich Co (St Louis, MO). Oleic acid-PEG-succinimidyl glutarate ester (OA) was custom synthesized from Nanocs Inc (New York, NY). Ketoprofen (KP) was purchased from Spectrum chemical mfg corp. (Gardena, CA). Spantide II (SP) was purchased from American peptide company Inc, (Sunnyvale, CA). Hoechst 34580, DID and DiO dyes were purchased from Invitrogen (Eugene, OR).
2.1 Animals
Hairless rats (CD ®(SD) HrBi, Male) and C57BL/6 mice (6 weeks old, male) (Charles River Laboratories, Wilmington, MA) were grouped and housed (n = 6 per cage) in cages with bedding. The animals were kept under controlled conditions of 12:12 h light:dark cycle, 22 ± 2 °C and 50 ± 15% RH. The mice were fed (Harlan Teklad) and water ad libitum. The animals were housed at Florida A&M University which has AAALAC accredited facilities. The animals were acclimatized to laboratory conditions for one week prior to experiments. The protocol of animal study was approved by the Institutional Animal Care and Use Committee (IACUC), Florida A&M University, FL.
2.2 Preparation of nanoparticles
NPS were prepared by modified emulsion solvent evaporation method [25]. Briefly, 10 mg of PLGA was dissolved in 1.5 ml of dichloromethane. The organic phase was added to 20 ml of 0.1% w/v PVA solution comprising 4 ml of 0.5% w/v chitosan and 1.5 ml of tween 80 with constant stirring to form an emulsion. This emulsion was broken down into nanodroplets by homogenization for 15 min at 30,000 rpm. The formed NPS were stirred for 30 min to evaporate the organic phase. 5 ml of the NPS dispersion was transferred to a separate vial. The chitosan, present on the outer layer of NPS was then cross linked with 100 μl of 1% w/v TPP to promote the bilayered NPS formation. The resultant NPS dispersion was stirred at 300 rpm for 2 h for complete cross linking of chitosan.
To prepare SP nanoparticles (SP-NPS), 5 mg of SP was dissolved in 100 μl of ethanol and then mixed with organic phase containing PLGA. NPS were prepared by homogenization as described above. To this nanoparticle dispersion, 1% w/v TPP was added for cross linking of chitosan coat. To prepare SP and KP nanoparticles (SP+KP-NPS), KP was dispersed in1% w/v TPP and added drop wise to SP containing bilayered nanoparticles (SP-NPS). To prepare KP nanoparticles (KP-NPS), SP was excluded from the NPS preparation procedure.
Fluorescent nanoparticles (DiO/DID-NPS) were prepared by incorporating DiO/DID dye in PLGA core by dissolving it in dichloromethane keeping the rest of the procedure as explained earlier.
KP solution (KP-Solution), SP solution (SP-Solution) and a combination of SP + KP solution (SP+KP-Solution) were prepared by dissolving drugs in 100 μl ethanol. To this oleic acid was added and then the volume was adjusted with PEG-400.
2.3 Surface modification of nanoparticles (NPS-OA)
For surface modification, 1 ml of NPS was suspended in 500 μl of phosphate buffer pH 7.4. Then OA with succinimidyl glutamate ester side group (the mole ratio of chitosan to OA was varied as 1:2, 1:4 and 1:6), previously dissolved in 10 μl of DMSO, was incubated for different time intervals with constant stirring to complete the N-hydroxysuccinimide reaction. The chemistry involved in the surface modification of NPS is shown in Figure 1. The surface modified NPS were represented as KP-NPS-OA, SP-NPS-OA and SP+KP-NPS-OA for KP, SP and a combination of SP and KP, respectively.
Figure 1.
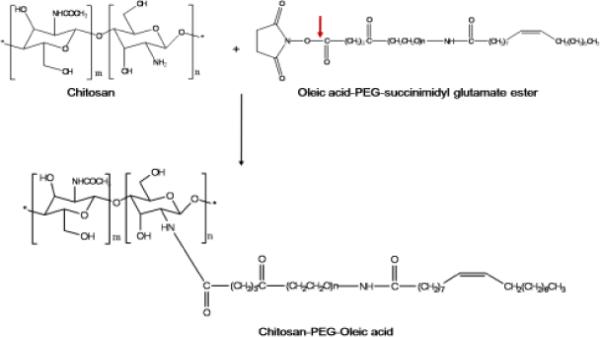
Chemistry involved in the surface modification of NPS where the outer layer of the NPS is composed of chitosan. In first step, the oleic acid-PEG-succinimidyl glutarate ester reacts with amine groups of the chitosan present on the surface of NPS. This involves hydrolysis of ester linkage by slightly increasing pH to 7.4 in phosphate buffer. In the second step a covalent amide bond forms between the chitosan and PEG derivative by releasing N-hydroxysuccinimide. At the end of the reaction the surface of NPS was modified with OA using PEG as a spacer.
2.4 TNBS method
TNBS method was performed to estimate the percent of surface accessible amino groups by colorimetric reaction. In brief, the NPS and NPS-OA were dispersed in distilled water and incubated with 4% w/v NaHCO3 and 0.1% w/v TNBS reagent at room temperature for 2 h with constant stirring. The reaction mixture was then centrifuged at 13,500 rpm for 10 min and the absorbance of the supernatant was measured at 420 nm using spectrophotometer (M200 Tecan, San Jose, CA). For control, the distilled water was used in place of NPS, following the same procedure as described above.
2.5 Characterization of nanoparticles
The particle size and zeta potential of NPS and NPS-OA were measured using Nicomp 380 ZLS (Particle Sizing Systems, Port Richey, FL). The Nicomp 380 ZLS analyzer uses dynamic light scattering to obtain the essential features of the particle size distribution. The assay of SP and KP was performed by dissolving 100 μl of NPS or NPS-OA in 900 μl of ethanol. The samples were then centrifuged at 13,000 rpm for 15 min and 100 μl of supernatant was injected into Waters high-performance liquid chromatography (HPLC). Entrapment efficiency was determined as reported earlier using vivaspin columns, molecular weight cut-off (MWCO) 10,000 Da [26]. The NPS and NPS-OA (0.5 ml) were placed on top of the vivaspin centrifuge filter membrane and centrifuged at 4,500 rpm for 15 min. The amount of SP and KP present in the aqueous phase was estimated using HPLC.
2.6 Confocal Laser Scanning Microscopy (CLSM)
For confocal laser scanning microscopy studies the skin permeation studies with DiO-NPS and DiO-NPS-OA was performed using rat skin as described by Patlolla et al [26]. Briefly, the DiO-NPS or DiO-NPS-OA were applied to the epidermal side in the donor compartment of Franz diffusion cell and the receiver compartment was filled with PBS (pH 7.4). The skin permeation studies were performed at 32 ± 0.5 °C. After 24 h, the entire dosing area (0.64 cm2) was collected using biopsy punch. To visualize the skin associated fluorescence, thin lateral serial skin sections of 40 μm were collected (upto 240 μm) using cryotome (Shandon Scientific Ltd, England). For nuclei staining, the skin sections were incubated with the Hoechst dye solution (1 μg/μl), prepared in PBS (pH 7.4) for 30 min in dark. The sections were then washed two times with PBS (pH 7.4). Then skin sections were visualized with a laser confocal microscope (Leica Microsystems Inc, Buffalo Grove, IL) using 10× objective. The instrument settings were kept constant for DiO-NPS-OA and DiO-NPS treated samples. Finally, the collected images were analyzed using Digital image software for the skin associated fluorescence.
2.7 Raman Confocal Spectroscopy
The lateral rat skin sections of the DID-NPS and DID-NPS-OA were collected as explained for CLSM and observed with HR800 Raman spectroscopy (Horiba Jobin Yvon, NJ) for fluorescence intensity by positioning the skin sections on microscope stage. Raman confocal spectroscopy was calibrated and set as reported by Patlolla et al [26]. Briefly, 10× objective and 200 mm confocal pin hole were used to acquire the fluorescence data. For control, the raman spectrum of untreated rat skin sections was collected as a function of depth upto 240 μm. Raman spectra of DID-NPS-OA and DID-NPS in skin permeation samples were acquired over a 200–1600 cm−1 range.
2.8 Selection of receiver fluid
To maintain the sink condition, SP and KP were dissolved by gentle shaking in various receiver fluids like 10% v/v ethanol in PBS (pH 7.4), 0.1–0.5% w/v Volpo 20 in PBS (pH 7.4), 5% w/v BSA in PBS (pH 7.4). The final concentration of SP and KP in receiver fluid was 1 mg/ml.
2.9 Human skin permeation studies
Dermatomed human skin was obtained from Allosource (Centennial, CO) in normal saline containing 10% glycerol with a thickness of 0.5 ± 0.1 mm. Skin was then stored at −80 °C until use. The dermatomed skin was thawed and washed with water for 30 min to remove excess of glycerol prior to use. Skin permeation studies were performed using established procedures. The human skin permeation studies were performed by mounting the dermatomed human skin on Franz diffusion cell set up (Permegear Inc., Riegelsville, PA). The surface area of the dermatomed human skin exposed to the formulation in the donor chamber was 0.64 cm2 and the receiver fluid volume was 5 ml. The NPS or NPS-OA was applied evenly on the surface of the human skin in the donor compartment. The skin permeation study was performed using 6 diffusion cells and represented as an average of 6 cells. The receiver compartment was filled with 0.5% w/v volpo 20 in PBS (pH 7.4) and stirred at 300 rpm. The temperature of receiver compartment was maintained at 32 ± 0.5 °C using a circulating water bath to simulate the skin temperature at physiological level. To simulate the clinical conditions, a non-occlusive method was followed and the surface of the skin was exposed to the surrounding air. After 24 h of skin permeation, the receiver fluid was collected and centrifuged at 13,500 rpm for 15 min and analyzed for drug content using HPLC.
2.10 Drug extraction from Skin
To detect the drug retention in dermatomed human skin layers, the entire dosing area (0.64 cm2) was collected with a biopsy punch. SC, epidermis and dermis were separated using cryotome. SC, epidermis and dermis were minced and boiled with 250 μl PBS (pH 7.4) separately for 10 min. To these samples 250 μl of The supernatant was collected and analyzed by HPLC for drug content.
2.11 In vitro drug release
In vitro drug release studies of KP-NPS, SP-NPS, SP+KP-NPS, KP-NPS-OA, SP-NPS-OA and SP+KP-NPS-OA were performed to investigate the amount of drug released from NPS or NPS-OA. A porous membrane of MWCO 50,000 Da (Sigma-Aldrich Co, MO) was used. The membrane was mounted between the donor and receiver compartments of Franz diffusion cells [27]. The NPS dispersion was then applied evenly on the surface of the membrane in the donor compartment. The receiver compartment was filled with 0.5% w/v volpo in PBS (pH 7.4), stirred at 300 rpm and maintained at 32 ± 0.5 °C. At predetermined time intervals (1, 2, 4, 6, 8, 12, 22, 24, 48 and 72 h). 0.5 ml samples were collected from the receiver compartment and replaced with fresh buffer solution. The samples collected from receiver compartment were analyzed for drug content using HPLC method.
2.12 HPLC analysis
HPLC system (Waters Corp, Milford, MA) along with a Vydac reverse phase C18 (300 Å pore size silica) analytical column (5 μm, 4.6 × 250 mm) (GraceVydac, Columbia, MD) were used for the analysis of SP. The mobile phases used for SP were 0.1% v/v TFA in water (solvent A) and 0.1% v/v TFA in acetonitrile (solvent B) and they were run at a gradient of 60:40 to 40:60 (solvent A:B, respectively) for 20 min, with a flow rate of 1.2 ml/min. SP content in the samples was determined at 230 nm.
Waters Symmetry C18 analytical column (5 μm, 4.6 × 250 mm) was used for analysis of KP. The mobile phases used was 0.025% v/v TFA in water (solvent A) and acetonitrile (solvent B) and they were run at a gradient of 70:30 for 5 min, then 10:90 for 8 min followed by 0:100 (solvent A:B, respectively) with a flow rate of 1 ml/min. KP content in the samples was determined at 255.5 nm.
2.13 In vivo model for allergic contact dermatitis (ACD)
DNFB induced edema (after secondary exposure) is widely used for investigating cutaneous inflammatory process [28]. Therefore the effect of NPS and NPS-OA on inflammation was investigated using DNFB induced ACD model. Briefly, C57BL/6 mice were sensitized on day zero by applying 25 μl of 0.5% v/v DNFB in acetone:olive oil (4:1) on the shaved abdomen. Mice were then challenged on day 5 by epicutaneous application of 25 μl of 0.2% DNFB in acetone:olive oil (4:1) on the right ear in order to induce an ACD response. The left ears were treated with vehicle alone (acetone:olive oil 4:1) and served as an internal control. The ACD response was determined by the degree of ear swelling compared with that of the vehicle treated contra-lateral ear before DNFB challenge. The increase in ear thickness was measured with a vernier caliper (Fraction+ Digital Fractional Caliper, General Tools & Instruments Co., LLC., New York, NY) at 0, 24, 48 and 72 h. Right ears of the mice were treated with topical application of KP-Solution, SP-Solution and SP+KP-Solution, KP-NPS, SP-NPS, SP+KP-NPS, KP-NPS-OA, SP-NPS-OA and SP+KP-NPS-OA, 2 h after antigen challenge and 3 times a day thereafter for 3 days. Dexamethasone, 0.5 mM solution in ethanol and PEG-400 mixture was used as a positive control. The ear swelling was measured before the application of drug solution and NPS or NPS-OA. This was considered as 0 h ear thickness. Then the drug solution, NPS or NPS-OA were applied and the ear thickness was measured at 24, 48, and 72 h. The ACD response was determined by taking a difference between 0 h and other time points.
Combination Index (CI) value [29] was used to evaluate the combined effect of SP and KP. The CI was calculated using following equation:
| Equation 1 |
The CI values were interpreted as follows: CI > 1.3: antagonism, CI =1.1–1.3: moderate antagonism, CI = 0.9–1.1: additive effect, CI = 0.8–0.9: slight synergism, if CI = 0.6–0.8: moderate synergism, CI = 0.4–0.6: synergism, CI = 0.2–0.4: strong synergism.
Histological sections of mice ears were observed after hematoxylin and eosin (H&E) staining with an optical microscope (Olympus America, Melville, NY) using 10× lens.
2.14 Statistical analysis
The SP and KP content of the skin tissue was expressed as mg per g of the tissue. Differences between the skin permeation and ACD response of SP+KP solution, SP+KP-NPS and SP+KP-NPS-OA were examined using ANOVA and Tukey multiple comparison test. Means were compared between two groups by student's t test and between three dose groups by one-way variance analysis (ANOVA). Mean differences with p<0.001 were considered to be significant.
3. Results
3.1 Nanoparticle characterization
The mean particle size of KP-NPS, SP-NPS and SP+KP-NPS was found to be 153, 173 and 169 nm, respectively with polydispersity indices (PI) from 0.12 to 0.18. The mean particle size of SP+KP-NPS-OA was increased from 183 to 217 nm because of increase in mole ratio of chitosan:OA (Table 1).
Table 1.
Effect of different amount of OA incubation with NPS. NPS were incubated with OA for 2 h. As the amount of OA increased on the surface of the NPS, the particle size also increased. In addition, as the amount of OA increased on the surface of the NPS, zeta potential decreased. This is due to the amino groups of the chitosan on the surface of NPS occupied in the formation of amide linkage.
| Nanoparticles | Particle Size (nm) | Polydispersity Index | Zeta Potential (mV) | Surface-accessible amine group of nanoparticles modified after 2h of incubation with OA (%) |
|---|---|---|---|---|
| SP+KP-NPS-OA (1:2) | 172 ± 16 | 0.19 | 10.43 ± 2.21 | 54.65 ± 4.68 |
| SP+KP-NPS-OA (1:4) | 176 ± 17 | 0.16 | 7.59 ± 1.74 | 66.83 ± 3.28 |
| SP+KP-NPS-OA (1:6) | 183 ± 19 | 0.21 | 5.34 ± 1.43 | 81.90 ± 3.43 |
The zeta potential of KP-NPS, SP-NPS and SP+KP-NPS in double distilled water was 11.17, 13.82 and 16.76 mV. The PLGA nanoparticles without chitosan coat had a negative zeta potential (Figure 2) and as the amount of PLGA was increased, zeta potential decreased. Zeta potential values of the chitosan shelled nanoparticles were positive owing to their cationic chitosan coat (Figure 3). The zeta potential of SP+KP-NPS-OA was decreased from 10.43 to 5.34 mV which possibly was because of reduction in free amine groups of chitosan, available on the surface of nanoparticles. The entrapment efficiency of SP and KP was 92.81 ± 2.17% and 81.27 ± 2.26%, respectively. The entrapment efficiency of SP and KP was unaffected by surface modification. According to TNBS method, 82% of surface accessible amino groups of chitosan were modified.
Figure 2.
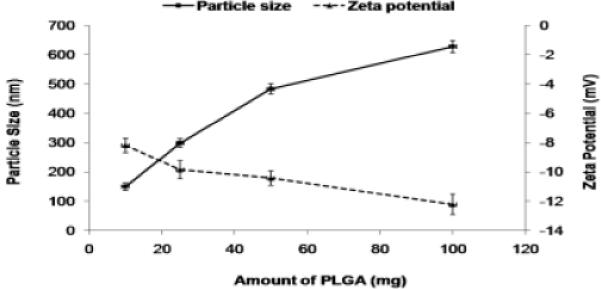
The effect of amount of PLGA on the particle size and zeta potential of the NPS. As the amount increases from 10 mg to 100 mg, the particle size increases and the zeta potential decreases.
Figure 3.
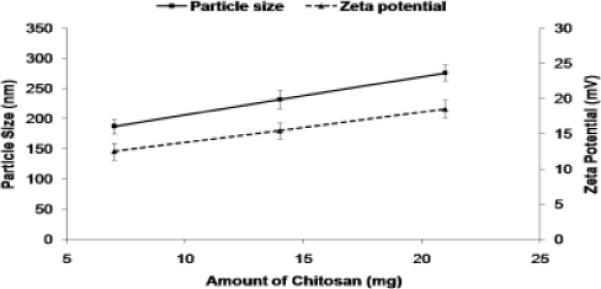
The effect of amount of chitosan on the particle size and zeta potential of the NPS. As the amount increases the particle size increases and the zeta potential also increases.
3.2 Confocal laser scanning microscopy (CLSM)
The fluorescence from the DiO-NPS decreased with increase in skin depth. Intense fluorescence for DiO-NPS was observed at upto 120 μm which was decreased at 160 μm and then diminished (Figure 4). However, the fluorescence from DiO-NPS-OA treated skin was detectable upto 240 μm skin depth. The difference between the percent intensities of confocal microscopic images for DiO-NPS and DiO-NPS-OA was evaluated using Digital image software (Figure 5). The percent intensity of DiO-NPS-OA was approximately 4 times higher than DiO-NPS at various depths.
Figure 4.
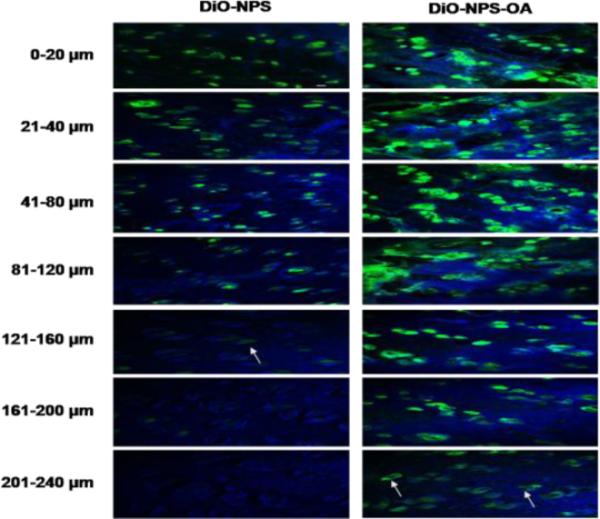
In vitro rat skin permeation of lipophilic DiO fluorescent dye encapsulated with and without OA surface modified NPS, after 24 h of skin permeation of DiO-NPS and DiO-NPS-OA the lateral skin sections were made to a depth of 240 μm with cryotome and observed under confocal laser scanning microscope for skin associated fluorescence. Vertical row indicates the depth of skin sections. The left panel indicates the sections of DiO-NPS treated skin the fluorescence was observed upto 160 μm (white arrow). The right panel represents the DiO-NPS-OA permeated skin sections. The surface modification with OA resulted in increased permeation upto depth of 240 μm (white arrows).
Figure 5.
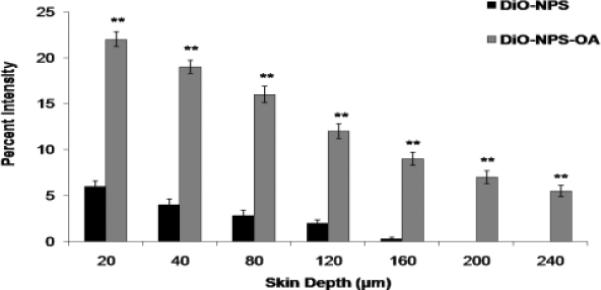
Comparison of the fluorescence percent intensity of the DiO-NPS and DiO-NPS-OA permeated skin sections. Fluorescence was calculated from confocal images using digital image software. The percent intensity of the images were plotted against the skin depth for both OA modified and un-modified DiO-NPS. Data represent mean ± SEM (n=6); significance DiO-NPS-OA against DiO-NPS, **p < 0.001. Here, A.U.: arbitrary units.
3.3 Raman confocal spectroscopy
The lateral skin sections from the in vitro skin permeation of DID-NPS and DID-NPS-OA were observed with Raman confocal spectroscope for skin associated fluorescence and the results are summarized in Figure 6. According to Figure 6, the fluorescence intensities of DID-NPS-OA were found to be higher than DID-NPS after 24 h. At 80 μm skin depth, the intensities of fluorescence were 1,923 and 13,455 counts for DID-NPS and DID-NPS-OA treated samples, respectively. At 120 μm skin depth, the intensities were reduced to 780 and 11,243 counts for DID-NPS and DID-NPS-OA treated samples, respectively. The fluorescence signal for DID-NPS from 160 to 240 μm was below detection limit and was not detectable. However an intense signal was observed for DID-NPS-OA treated samples at a skin depth of 240 μm.
Figure 6.
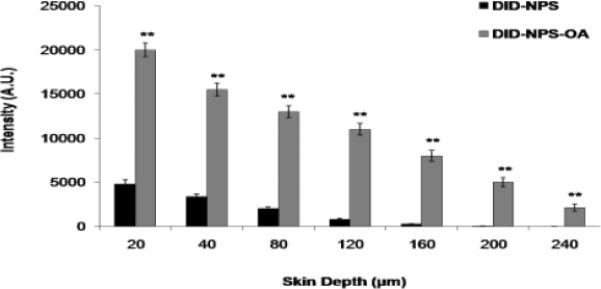
In vitro rat skin permeation of lipophilic DID fluorescent dye encapsulated with and without OA coated nanoparticles, after 24 h of skin permeation of DID-NPS. Shift in the fluorescence intensity of lateral rat skin sections of DID-NPS and surface modified DID-NPS (DID-NPS-OA) was observed using Raman confocal spectroscope. The fluorescence intensity (A.U.) of each section was plotted for different depths of the skin. Data represent mean ± SEM (n=6); significance DID-NPS-OA against DID-NPS, **p < 0.001.
3.4 Selection of receiver fluid
For permeation studies, the use of specific receptor fluid is very essential and therefore the solubility test was done in selected receiver fluids. KP was soluble in 0.1% w/v volpo 20 in PBS (pH 7.4) and SP was insoluble in it but SP was soluble in 0.5% w/v volpo 20 in PBS (pH 7.4). SP and KP were soluble in ethanol. However, when SP and KP were mixed together in PBS (pH 7.4) containing 10% w/v ethanol, precipitation was observed. SP and KP were soluble in 5% w/v BSA in PBS (pH 7.4). But BSA interfered with the retention peak of SP and KP in HPLC analysis. Also, excess amount of surfactant into the receiver fluid led to emulsification of skin, and thus resulted in oozing of skin components into the receiver fluid. These oozed components interfered with the retention peak of SP and KP. Therefore to avoid this interference 0.5% w/v volpo 20 in PBS (pH 7.4) was selected for skin permeation studies based on the solubility of SP and KP.
3.5 In vitro skin permeation
The detection of SP and KP levels in skin layers and in receiver compartment was determined separately using two different analytical columns. Figures 7, 8 and 9 shows the effect of surface modification on the nanoparticle skin permeation performed at the end of 24 h with dermatomed human skin. SP was below detection limits in the receiver compartment for any type of formulation. The SC, epidermal and dermal retention of SP for SP-NPS-OA was 6.30, 3.86 and 0.44 mg/g of skin, respectively. The skin retention of SP in various skin layers for SP-NPS-OA was approximately 5.7 and 3.7 times higher than SP-Solution and SPNPS, respectively (Figure 7). The SC, epidermal and dermal retention of KP for KP-NPS-OA was 0.68, 0.32 and 0.12 mg/g of skin, respectively. The retention of KP in various skin layers for KP-NPS-OA was approximately 6.8 and 4.1 times higher than KP-Solution and KP-NPS, respectively (Figure 8). KP was detectable in receiver compartment and 22.48 μg/cm2 permeated through the skin after 24 h for KP-NPS-OA. The permeated amount of KP was approximately 7 and 3.2 times higher than KP-Solution and KP-NPS, respectively (Figure 9). This skin retention of SP and KP for SP-NPS-OA and KP-NPS-OA was almost similar to SP+KP-NPS-OA for both the drugs. This indicates that loading of combination of drugs in NPS did not affect the skin permeation characteristics of the individual drugs.
Figure 7.
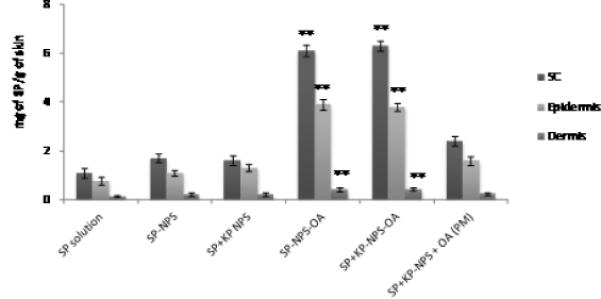
Effect of OA on the skin permeation of SP encapsulated NPS. In vitro skin permeation studies were carried out in dermatomed human using Franz diffusion cells and after 24 h of application, the skin was collected and processed as described in methods section. Data represent mean ± SEM, n=6; significance OA modified NPS against OA unmodified, physical mixture and solution, **p < 0.001.
Figure 8.
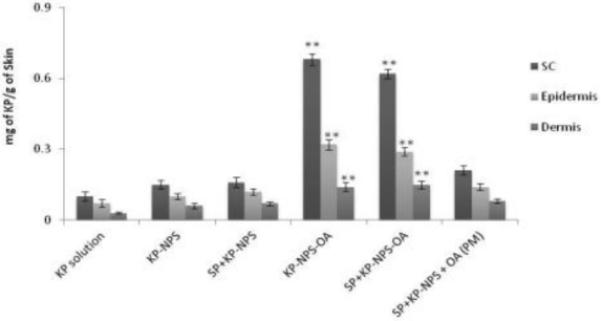
Skin retention of KP after 24 h in the different skin layers. The study was performed in vitro using Franz diffusion cells on dermatomed human skin. The skin biopsies were collected and processed further to detect the amount of KP permeated in each layers of skin. The data represent the amount of KP per g of skin for different formulations of KP. Data represent mean ± SEM, n=6; significance OA modified NPS against OA unmodified, physical mixture and solution, **p < 0.001.
Figure 9.
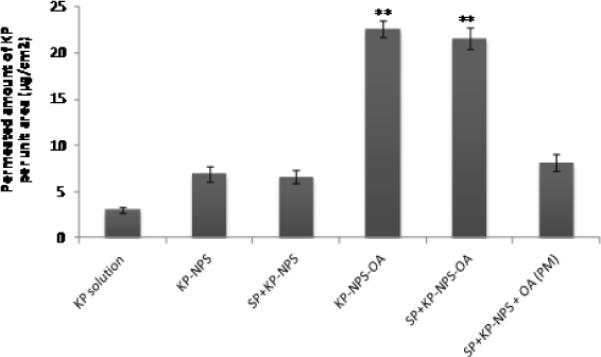
Permeated amount of KP through dermatomed human skin in vitro into receiver compartment after 24 h. The total amount of KP per unit area of skin was plotted for OA modified and un-modified KP- and SP+KP-NPS. Data represent mean ± SEM, n=6; significance OA modified NPS against OA unmodified, physical mixture and solution, **p < 0.001.
3.6 In vitro drug release
During in vitro drug release studies, the SP and KP release was in a controlled manner. SP showed 34% of release within 24 h from NPS (Figure 10a) while KP showed complete (>75%) release within 24 h (Figure 10b). Initial burst release of KP from NPS and NPS-OA was observed due to un-entrapped KP available in NPS dispersion. Further, the controlled release of SP from NPS and NPS-OA might be due to the long diffusion path length which SP has to initiate from PLGA matrix to cross-linked chitosan coat of the NPS or NPS-OA. There was no statistical difference between the drug released from NPS or NPS-OA. This might be because of use of porous membrane. In addition, drug release from NPS comprising single and combination drugs (KP-NPS or SP-NPS and SP+KP-NPS) was unaffected which confirmed that there was no interaction between KP and SP. Generally zero order, first order, Korsmeyer – peppas, Hixson-crowell and Higuchi equations are used in determining the release kinetics of polymeric nanoparticles. The release pattern of KP from NPS or NPS-OA follows Korsmeyer – peppas kinetics with a best fit r2 value of 0.98, where first order, Hixson-crowell and Higuchi equations yield or best fit r2 values of 0.89, 0.78 and 0.92, respectively. Similarly the release pattern of SP from NPS or NPS-OA follows Korsmeyer – peppas kinetics with a best fit r2 value of 0.9987, where first order, Hixson-crowell and Higuchi equations yield or best fit r2 values of 0.98, 0.9975 and 0.95, respectively.
Figure 10.

In vitro drug release of a) SP and b) KP from nanoparticles in PBS (pH 7.4) containing 0.5% w/v volpo. The surface modification and combination of both drugs NPS also studied. The cumulative amount released was plotted against time. Data represent mean ± SEM, n=6.
3.7 In vivo model for allergic contact dermatitis (ACD)
The reduction of ear swelling in mice was used to monitor the treatment of inflammation after application of various formulations. The effect of KP-, SP- and SP+KP-Solution, KP-NPS, SP-NPS, SP+KP-NPS, KP-NPSOA, SP-NPS-OA, and SP+KP-NPS-OA on the reduction of ear swelling is shown in Figure 11. The ear thickness increased from 122.48 to 143.42 μm with time for control animals. However, at 72 h the ear thickness was decreased to 98.74, 91.76 and 73.45 μm for KP-Solution, KP-NPS and KP-NPS-OA, respectively. Similarly it was 108.15, 98.56 and 80.23 μm for SP-Solution, SP-NPS and SP-NPS-OA, respectively. There was no statistical difference in ear thickness before and after application of dexamethasone. The ear thickness for SP+KP-Solution, SP+KP-NPS and SP+KP-NPS-OA was 66.78, 48.59 and 29.34 μm, respectively. In addition, the combination index value calculated using ACD model for SP+KP-Solution was 0.92 which suggests additive effect, while for SP+KP-NPS-OA it was 0.76 indicating moderate synergism. The response of ACD model was further characterized by histological examination and the results are presented in Figure 12. As illustrated in Figure 12, combination of SP+KP-NPS-OA was more effective in the treatment of ACD by reducing the ear swelling, compared to control, SP+KP-NPS and SP+KP solution.
Figure 11.
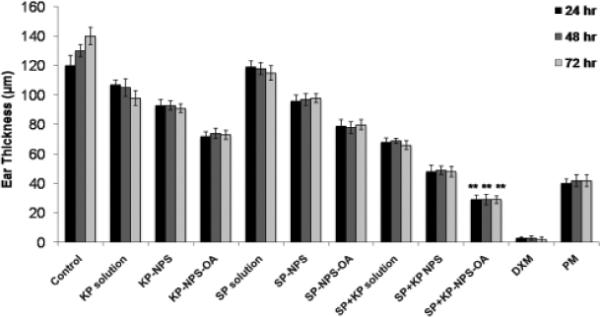
Effect of SP and KP solutions, surface modified and unmodified nanoparticles along with the physical mixture of oleic acid-PEG and unmodified nanoparticles containing SP and KP together on the reduction of allergic contact dermatitis in C57/BL mice. Data represent mean ± SEM, n=6; significance OA modified NPS against OA unmodified, physical mixture and solution, **p < 0.001.
Figure 12.
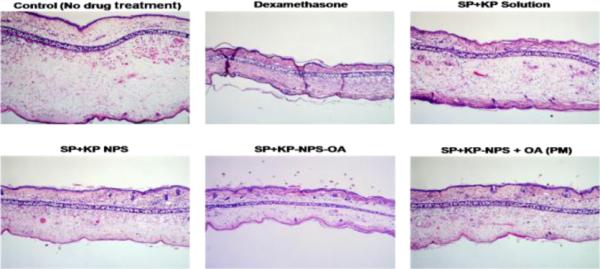
H&E histological staining of ACD induced C57/BL mice ears after treatment with a positive control dexamethasone and a combination of two drugs SP and KP. The stained sections of mice ears after 72 h of treatment with SP+KP solution, SP+KP-NPS, SP+KPNPS-OA and SP+KP-NPS + OA (PM) are summarized in the figure. The images were taken using 10× lens.
4. Discussion
For inflammatory skin diseases like allergic and irritant contact dermatitis, it is desirable to deliver the drug by percutaneous route into deeper skin layers to achieve targeted delivery. Many of the commercial formulations for the treatment of allergic and irritant contact dermatitis are available in gel, cream, lotion or ointment form but have limited success. To overcome this, nanoparticles have been used by many researchers to enhance skin permeation of active drugs. However, permeation studies with nanoparticles have demonstrated that they do not cross SC but possibly permeate into SC layers and release the encapsulated drug in a controlled manner into the upper epidermis and from there the released drug passively diffuses to skin layers. Although, recent investigations have demonstrated that nanoparticles can transport the loaded agents into open hair follicles but the total amount reaching the target site is very limited [26, 30–31]. This correlates to our studies with DiO-NPS, where the prominent fluorescence was observed upto a depth of 120 μm. This is mostly because of the positive charge present on the surface of NPS as the outer layer of NPS is composed of free amine groups containing chitosan. This observation is further supported by a recently published study which reported that chitosan and its derivatives interact with the negative charge of SC resulting in opening of tight junctions [32–34], thus acting as a permeation enhancer. Our laboratory has already shown that lipid nanoparticles modified with TAT, a cell penetrating peptide which is comprised of positively charged arginine and lysine groups, can translocate into deeper skin layers (160 μm) [26]. The current study is a continuation of our previous work and is the first report on the use of OA for surface modification of bilayered nanoparticles and their application for topical delivery. The combination of PLGA and chitosan nanoparticles has been studied to enhance transdermal delivery of DNA in deeper skin layers where mechanical enhancement procedures like gene gun bombardment was used [35] suggesting the need of aggressive approaches for their delivery.
The success of topical delivery depends on the ability of drug to permeate the skin in sufficient quantities to achieve its desired therapeutic effects. To enhance the delivery of NPS into the skin through paracellular or transcellular route (apart from the follicular pathway), the surface of NPS was modified with OA (Nanoease technology for improved skin permeation). The use of OA in nanoparticles has been explored previously, where iron oxide magnetic core was first coated with OA and then stabilized with different types of block co-polymers. However, the role of OA was not for permeation enhancement but to keep iron oxide magnetic core inside the co-polymer matrix [36]. In our study, the surface modification of NPS was achieved by succinimidyl glutarate (SG) ester of oleic acid-PEG. The selection was based on higher stability of the ester in aqueous medium and involvement of simple incubation reaction with free amine groups present on chitosan coat. Use of other reactions like alkylation for surface modification would not retain the desired particle size of nanoparticles. Therefore a simple incubation reaction is necessary for the surface modification of nanoparticles. Several studies have been reported on the use of such incubation reaction for surface modification (pegylation) of chitosan [37–38], gelatin [39–40] and BSA [41] nanoparticles using succinimidyl esters. On this basis, PEG-1000 was used as a linker. One end of PEG was modified with OA and other end was modified with succinimidyl glutarate ester. To understand the effect of surface modification of nanoparticles, particles size, zeta potential and surface accessible amino groups were further investigated. The particle size, zeta potential and surface accessible amino groups of surface modified nanoparticles (NPS-OA) were dependent on the mole ratio of chitosan:OA and incubation time used for the surface modification (data not shown). The percent of surface accessible amine groups of SP+KP-NPS, estimated using TNBS method, increased from 30 to 45 percent with increase in mole ratio at 1 h incubation and further increased to 82 percent after 2 h incubation. However, there was no difference noted in percent amine groups modified at 2 and 4 h incubation (data not shown). Therefore, for surface modification, NPS and OA were incubated for 2 h. Particle size and surface accessible amine groups modified for NPS-OA increased with increase in mole concentration of OA (Table 1). The positive charge of the NPS was mainly because of positive charge (free amino groups) of chitosan. The change in zeta potential from negative to positive for PLGA alone and chitosan coated PLGA nanoparticles confirmed that chitosan was present on the surface of PLGA core [25]. Further, Yuan et al has reported that the particle size of PLGA-Chitosan nanoparticles was increased from 203 to 543nm with increase in chitosan concentration from 0 to 0.25% w/v. This might be because of the use of the higher concentration of PLGA [25]. Nafee et al has reported that the particle size of PLGA-chitosan nanoparticle increased with increase in concentration of PLGA [42]. In addition, when NPS were made using high molecular weight chitosan (310–375 kDa), the particle size was in the range of 253 ± 16 nm (unpublished data). Therefore, we have used low molecular weight chitosan (50 kDa) for preparation of NPS.
Various studies have reported that OA creates permeability defects within the bilayer lipids of SC and thus facilitates permeation of drug through SC into the deeper layers of skin [19]. Scanning electron microscopic study of skin after application of 10% w/v OA in ethanol showed that OA created pores on the surface of the corneocytes [43]. Further, it was suggested that when OA comes in contact with the lipid domains of the SC, it results in disturbed intercellular lipids which was demonstrated by the reduction in the gel to liquid transition temperature of the lipid domains of the intact SC [44–45]. Also, OA has been suggested to exist as heterogeneously dispersed within the intercellular multilayers and induce phase separation. Thus, OA shows its permeation enhancement effects by reducing either the diffusional path length or by providing less resistant lipid routes [46]. Therefore the observed fluorescence in deeper skin layers after application of OA modified NPS containing fluorescent dye may follow these sequence of events: (a) during early time points the positive charge of NPS-OA would assist in binding to the SC (b) as the time progresses, water from the NPS-OA dispersion would evaporate and form a thin layer on the skin surface which would enable in the hydration of skin (c) OA would then disturb the lipid domains of SC facilitating the permeation of DiO-NPS into deeper skin layers.
Raman spectroscopy has been used in combination with confocal imaging and provides additional advantage of real time analysis of nanoparticles permeation into the skin [26]. Although confocal raman spectroscopy is a non destructive technique, we observed the lateral skin sections obtained with cryotomy to analyze the skin associated fluorescence. Complimentary results to the confocal microscope study were obtained where the fluorescence signal was observed at a depth of 240 μm for the OA modified NPS treated skin. The effect of OA modification was further studied for the combination of anti-inflammatory drugs, namely SP and KP. SP was not found in receiver compartment after 24 h of rat and human skin permeation using SP-Solution, SP-NPS and SP-NPS-OA. Similar results were reported for SP lotion and gel formulations from experiments performed in our laboratory using rat skin [28]. Our observations with rat skin permeation suggested that after 24 h, the amount of SP retained in dermis for SP-NPS-OA was approximately 4.1 and 3.1 folds higher than lotion or gel formulation containing penetration enhancer, respectively (unpublished data). Similarly when the skin permeation was performed using dermatomed human skin, the amount of SP retained in dermis for SP-NPS-OA was increased approximately 2.9 and 2.1 folds compared to SP-Solution and SP-NPS, respectively. Cevc et al reported that the amount of KP in receiver compartment for various commercial gels was found in the range of 0.08 to 1.40 μg/cm2 [47]. Similar results were observed with KP-Solution using human skin. Puglia et al reported that the amount of KP available, from hydrogel containing KP-lipid nanoparticles, in receiver compartment was approximately 2.4 folds higher compared to KP gel, respectively, after 24 h of human skin permeation [48]. Similar results were found for KP-NPS and KP-NPS-OA permeation. For KP-NPS-OA, the amount of KP available in receiver compartment was increased approximately 7 and 3.2 folds compared to KP-Solution and KP-NPS, respectively, after 24 h of skin permeation study. The amount of KP retained in dermis for KP-NPS-OA was increased approximately by 4.6 and 2.7 folds compared to KP-Solution and KP-NPS, respectively. Further KP retained in SC and epidermis after KP-NPS-OA application was significantly different (p<0.001) than the KP-Solution. Furthermore, a physical mixture of oleic acid-PEG (OA) and SP+KP-NPS did not show any significant increase in retention of SP and KP as compared to SP+KP-NPS-OA suggesting no interaction between nanoparticles and oleic acid-PEG. This further supports our hypothesis that the significant improvement in skin permeation and distribution of KP-NPS and SP-NPS in various skin layers was mainly because of the surface modification.
Further to investigate the effect of surface modification of NPS with OA in in vivo, allergic contact dermatitis (ACD) model was developed and the reduction in ear thickness was evaluated as a response. ACD is a cutaneous reaction involving various immunocompetent cells, including epidermal Langerhans cells, dermal dendritic cells, keratinocytes and T cells [49]. Many studies have revealed that multiple cytokines, chemokines, eicosanoids [50] and neuropeptides (substance P) [51] are also involved in the regulation of the process in ACD. SP blocks the inflammatory effects of substance P by competitively binding to neurokinin-1 receptors on cutaneous cells while KP inhibits prostaglandin (PG) biosynthesis. SP has been reported to inhibit capsaicin-induced [52] and DNFB-induced [23, 28] ear edema in mice. Atatashi et al reported that in vivo application of KP inhibits the maturation of Langerhans cells [53]. The anti ACD response for SP+KP-NPS-OA was significantly higher (p<0.001) than SP+KP-Solution and SP+KP-NPS. Further, SP+KP-NPS-OA topical treatment resulted in a reduction of both cutaneous edema and the number of leukocytes infiltrating into the skin compared with the ACD response in untreated control mice. In addition, the combination index value suggested moderate synergism for NPS-OA. This might be because of the enhanced permeation of SP+KP-NPS after surface modification with OA which was confirmed by skin permeation study and also due to impact of two different mechanisms working in cohort to minimize inflammation. Further, to validate the effect of OA on NPS, physical mixture of SP+KP-NPS and OA was investigated for ACD response. The physical mixture, SP+KP-NPS + OA-PEG, had slightly better ACD response than SP+KP-NPS but the reduction in the ear thickness was less than SP+KP-NPS-OA. This observation supports the hypothesis that the reduction of ACD response for NPS-OA was mainly because of enhanced delivery of both the drugs by surface modification of NPS with OA.
5. Conclusion
Our studies demonstrate that surface modification of NPS with OA enhanced skin permeation of fluorescent dye containing nanoparticles by translocating the nanoparticles across the deeper skin layers with higher intensities. Further, surface modification of KP and SP nanoparticles with OA showed significant increase in skin permeation which was further responsible for improved response in ACD model. There was no interaction between the KP and SP during in vitro skin permeation and drug release studies. Our future studies will be aimed to understand the surface modified nanoparticles translocation under in vivo conditions.
Acknowledgement
We thank Ms. Ruth Didier, College of Medicine, Florida State University, Tallahassee, FL for her kind help in confocal microscopy studies; Ms. Debra Channer, College of Pharmacy and Pharmaceutical Sciences and Dr. Kalayu Belay, Department of Physics, Florida A&M University, Tallahassee, FL for her technical help. The authors acknowledge the financial assistance provided by RCMI (NIH) grant number G12RR03020.
Footnotes
Publisher's Disclaimer: This is a PDF file of an unedited manuscript that has been accepted for publication. As a service to our customers we are providing this early version of the manuscript. The manuscript will undergo copyediting, typesetting, and review of the resulting proof before it is published in its final citable form. Please note that during the production process errors may be discovered which could affect the content, and all legal disclaimers that apply to the journal pertain.
References
- [1].Barry BW. Novel mechanisms and devices to enable successful transdermal drug delivery. Eur J Pharm Sci. 2001;14:101–114. doi: 10.1016/s0928-0987(01)00167-1. [DOI] [PubMed] [Google Scholar]
- [2].Moser K, Kriwet K, Naik A, Kalia YN, Guy RH. Passive skin penetration enhancement and its quantification in vitro. Eur J Pharm Biopharm. 2001;52:103–112. doi: 10.1016/s0939-6411(01)00166-7. [DOI] [PubMed] [Google Scholar]
- [3].Karande P, Jain A, Mitragotri S. Insights into synergistic interactions in binary mixtures of chemical permeation enhancers for transdermal drug delivery. J Control Release. 2006;115:85–93. doi: 10.1016/j.jconrel.2006.07.001. [DOI] [PubMed] [Google Scholar]
- [4].Milewski M, Yerramreddy TR, Ghosh P, Crooks PA, Stinchcomb A. In vitro permeation of a pegylated naltrexone prodrug across microneedle-treated skin. J Control Release. 2010;146:37–44. doi: 10.1016/j.jconrel.2010.05.034. [DOI] [PMC free article] [PubMed] [Google Scholar]
- [5].Wu XM, Todo H, Sugibayashi K. Enhancement of skin permeation of high molecular compounds by a combination of microneedle pretreatment and iontophoresis. J Control Release. 2007;118:189–195. doi: 10.1016/j.jconrel.2006.12.017. [DOI] [PubMed] [Google Scholar]
- [6].Polat BE, Hart D, Langer R, Blankschtein D. Ultrasound-mediated transdermal drug delivery: mechanisms, scope, and emerging trends. J Control Release. 2011;152:330–348. doi: 10.1016/j.jconrel.2011.01.006. [DOI] [PMC free article] [PubMed] [Google Scholar]
- [7].Sammeta SM, Vaka SR, Murthy S. Transcutaneous electroporation mediated delivery of doxepin-HPCD complex: a sustained release approach for treatment of postherpetic neuralgia. J Control Release. 2010;142:361–367. doi: 10.1016/j.jconrel.2009.10.036. [DOI] [PMC free article] [PubMed] [Google Scholar]
- [8].Cevc G, Vierl U. Nanotechnology and the transdermal route: A state of the art review and critical appraisal. J Control Release. 2010;141:277–299. doi: 10.1016/j.jconrel.2009.10.016. [DOI] [PubMed] [Google Scholar]
- [9].Rancan F, Papakostas D, Hadam S, Hackbarth S, Delair T, Primard C, Verrier B, Sterry W, Blume-Peytavi U, Vogt A. Investigation of polylactic acid (PLA) nanoparticles as drug delivery systems for local dermatotherapy. Pharm Res. 2009;26:2027–2036. doi: 10.1007/s11095-009-9919-x. [DOI] [PubMed] [Google Scholar]
- [10].Lademann J, Richter H, Teichmann A, Otberg N, Blume-Peytavi U, Luengo J, Weiss B, Schaefer UF, Lehr CM, Wepf R, Sterry W. Nanoparticles-an efficient carrier for drug delivery into the hair follicles. Eur J Pharm Biopharm. 2007;66:159–164. doi: 10.1016/j.ejpb.2006.10.019. [DOI] [PubMed] [Google Scholar]
- [11].Alvarez-Roman R, Barre G, Guy RH, Fessi H. Biodegradable polymer nanocapsules containing a sunscreen agent: preparation and photoprotection. Eur J Pharm Biopharm. 2001;52:191–195. doi: 10.1016/s0939-6411(01)00188-6. [DOI] [PubMed] [Google Scholar]
- [12].Cui Z, Mumper R. Chitosan-based nanoparticles for topical genetic immunization. J Control Release. 2001;75:409–419. doi: 10.1016/s0168-3659(01)00407-2. [DOI] [PubMed] [Google Scholar]
- [13].Alvarez-Roman R, Naik A, Kalia YN, Guy RH, Fessi H. Enhancement of topical delivery from biodegradable nanoparticles. Pharm Res. 2004;21:1818–1825. doi: 10.1023/b:pham.0000045235.86197.ef. [DOI] [PubMed] [Google Scholar]
- [14].Wu X, Price GJ, Guy RH. Disposition of nanoparticles and an associated lipophilic permeant following topical application to the skin. Mol Pharm. 2009;6:1441–1448. doi: 10.1021/mp9001188. [DOI] [PubMed] [Google Scholar]
- [15].Panyam J, Labhasetwar V. Biodegradable nanoparticles for drug and gene delivery to cells and tissue. Adv Drug Deliv Rev. 2003;55:329–347. doi: 10.1016/s0169-409x(02)00228-4. [DOI] [PubMed] [Google Scholar]
- [16].Shah PP, Mashru RC. Influence of chitosan crosslinking on bitterness of mefloquine hydrochloride microparticles using central composite design. J Pharm Sci. 2009;98:690–703. doi: 10.1002/jps.21456. [DOI] [PubMed] [Google Scholar]
- [17].Vllasaliu D, Exposito-Harris R, Heras A, Casettari L, Garnett M, Illum L, Stolnik S. Tight junction modulation by chitosan nanoparticles: comparison with chitosan solution. Int J Pharm. 2010;400:183–193. doi: 10.1016/j.ijpharm.2010.08.020. [DOI] [PubMed] [Google Scholar]
- [18].Kuchler S, Radowski MR, Blaschke T, Dathe M, Plendl J, Haag R, Schafer-Korting M, Kramer KD. Nanoparticles for skin penetration enhancement-a comparison of a dendritic core-multishellnanotransporter and solid lipid nanoparticles. Eur J Pharm Biopharm. 2009;71:243–250. doi: 10.1016/j.ejpb.2008.08.019. [DOI] [PubMed] [Google Scholar]
- [19].Barry BW. Mode of action of penetration enhancers in human skin. J Control Release. 1987;6:85–97. [Google Scholar]
- [20].Touitou E, Godin B, Karl Y, Bujanover S, Becker Y. Oleic acid, a skin penetration enhancer, affects Langerhans cells and corneocytes. J Control Release. 2002;80:1–7. doi: 10.1016/s0168-3659(02)00004-4. [DOI] [PubMed] [Google Scholar]
- [21].Tanojo H, Bos-van Geest A, Bouwstra JA, Junginger HE, Boodé HE. In vitro human skin barrier perturbation by oleic acid: Thermal analysis and freeze fracture electron microscopy studies. Thermochim Acta. 1997;293:77–85. [Google Scholar]
- [22].Zegpi C, Gonzalez C, Pinardi G, Miranda HF. The effect of opioid antagonists on synergism between dexketoprofen and tramadol. Pharmacol Res. 2009;60:291–295. doi: 10.1016/j.phrs.2009.04.005. [DOI] [PubMed] [Google Scholar]
- [23].Babu RJ, Kikwai L, Jaiani L, Kanikkannan N, Armstrong C, Ansel J, Singh M. Percutaneous absorption and anti-inflammatory effect of a Substance P receptor antagonist: spantide II. Pharm Res. 2004;21:108–113. doi: 10.1023/b:pham.0000012157.80716.73. [DOI] [PubMed] [Google Scholar]
- [24].Valenta C, Wanka M, Heidlas J. Evaluation of novel soya-lecithin formulations for dermal use containing ketoprofen as a model drug. J Control Release. 2000;63:165–173. doi: 10.1016/s0168-3659(99)00199-6. [DOI] [PubMed] [Google Scholar]
- [25].Yuan X, Shah BA, Kotadia NK, Li J, Gu H, Wu Z. The development and mechanism studies of cationic chitosan-modified biodegradable PLGA nanoparticles for efficient siRNA drug delivery. Pharm Res. 2010;27:1285–1295. doi: 10.1007/s11095-010-0103-0. [DOI] [PubMed] [Google Scholar]
- [26].Patlolla RR, Desai PR, Belay K, Singh MS. Translocation of cell penetrating peptide engrafted nanoparticles across skin layers. Biomaterials. 2010;31:5598–5607. doi: 10.1016/j.biomaterials.2010.03.010. [DOI] [PMC free article] [PubMed] [Google Scholar]
- [27].Ghouchi Eskandar N, Simovic S, Prestidge C. Nanoparticle coated submicron emulsions: sustained in vitro release and improved dermal delivery of All-trans-retinol. Pharm Res. 2009;26:1764–1775. doi: 10.1007/s11095-009-9888-0. [DOI] [PubMed] [Google Scholar]
- [28].Kikwai L, Babu RJ, Prado R, Kolot A, Armstrong CA, Ansel JC, Singh M. In vitro and in vivo evaluation of topical formulations of spantide II. AAPS PharmSciTech. 2005;6:E565–572. doi: 10.1208/pt060471. [DOI] [PMC free article] [PubMed] [Google Scholar]
- [29].Chougule M, Patel AR, Sachdeva P, Jackson T, Singh M. Anticancer activity of noscapine, an opioid alkaloid in combination with cisplatin in human non-small cell lung cancer. Lung Cancer. 2011;71:271–282. doi: 10.1016/j.lungcan.2010.06.002. [DOI] [PMC free article] [PubMed] [Google Scholar]
- [30].Vogt A, Combadiere B, Hadam S, Stieler KM, Lademann J, Schaefer H, Autran B, Sterry W, Blume-Peytavi U. 40nm, but not 750 or 1,500nm, nanoparticles enter epidermal CD1a+ cells after transcutaneous application on human skin. J Invest Dermatol. 2006;126:1316–1322. doi: 10.1038/sj.jid.5700226. [DOI] [PubMed] [Google Scholar]
- [31].Alvarez-Roman R, Naik A, Kalia YN, Guy RH, Fessi H. Skin penetration and distribution of polymeric nanoparticles. J Control Release. 2004;99:53–62. doi: 10.1016/j.jconrel.2004.06.015. [DOI] [PubMed] [Google Scholar]
- [32].Taveira SF, Nomizo A, Lopez RF. Effect of the iontophoresis of a chitosan gel on doxorubicin skin penetration and cytotoxicity. J Control Release. 2009;134:35–40. doi: 10.1016/j.jconrel.2008.11.002. [DOI] [PubMed] [Google Scholar]
- [33].He W, Guo X, Xiao L, Feng M. Study on the mechanisms of chitosan and its derivatives used as transdermal penetration enhancers. Int J Pharm. 2009;382:234–243. doi: 10.1016/j.ijpharm.2009.07.038. [DOI] [PubMed] [Google Scholar]
- [34].He W, Guo X, Zhang M. Transdermal permeation enhancement of N-trimethyl chitosan for testosterone. Int J Pharm. 2008;356:82–87. doi: 10.1016/j.ijpharm.2007.12.050. [DOI] [PubMed] [Google Scholar]
- [35].Lee PW, Peng SF, Su CJ, Mi FL, Chen HL, Wei MC, Lin HJ, Sung HW. The use of biodegradable polymeric nanoparticles in combination with a low-pressure gene gun for transdermal DNA delivery. Biomaterials. 2008;29:742–751. doi: 10.1016/j.biomaterials.2007.10.034. [DOI] [PubMed] [Google Scholar]
- [36].Jain TK, Foy SP, Erokwu B, Dimitrijevic S, Flask CA, Labhasetwar V. Magnetic resonance imaging of multifunctional pluronic stabilized iron-oxide nanoparticles in tumor-bearing mice. Biomaterials. 2009;30:6748–6756. doi: 10.1016/j.biomaterials.2009.08.042. [DOI] [PMC free article] [PubMed] [Google Scholar]
- [37].Hu FQ, Meng P, Dai YQ, Du YZ, You J, Wei XH, Yuan H. PEGylated chitosan-based polymer micelle as an intracellular delivery carrier for anti-tumor targeting therapy. Eur J Pharm Biopharm. 2008;70:749–757. doi: 10.1016/j.ejpb.2008.06.015. [DOI] [PubMed] [Google Scholar]
- [38].Mao S, Shuai X, Unger F, Wittmar M, Xie X, Kissel T. Synthesis, characterization and cytotoxicity of poly(ethylene glycol)-graft-trimethyl chitosan block copolymers. Biomaterials. 2005;26:6343–6356. doi: 10.1016/j.biomaterials.2005.03.036. [DOI] [PubMed] [Google Scholar]
- [39].Kommareddy S, Amiji M. Biodistribution and pharmacokinetic analysis of long-circulating thiolated gelatin nanoparticles following systemic administration in breast cancer-bearing mice. J Pharm Sci. 2007;96:397–407. doi: 10.1002/jps.20813. [DOI] [PubMed] [Google Scholar]
- [40].Kommareddy S, Amiji M. Poly(ethylene glycol)-modified thiolated gelatin nanoparticles for glutathione-responsive intracellular DNA delivery. Nanomedicine. 2007;3:32–42. doi: 10.1016/j.nano.2006.11.005. [DOI] [PMC free article] [PubMed] [Google Scholar]
- [41].Kouchakzadeh H, Shojaosadati S, Maghsoudi A, Vasheghani Farahani E. Optimization of PEGylation conditions for bsa nanoparticles using response surface methodology. AAPS PharmSciTech. 2010;11:1206–1211. doi: 10.1208/s12249-010-9487-8. [DOI] [PMC free article] [PubMed] [Google Scholar]
- [42].Nafee N, Taetz S, Schneider M, Schaefer UF, Lehr C-M. Chitosan-coated PLGA nanoparticles for DNA/RNA delivery: effect of the formulation parameters on complexation and transfection of antisense oligonucleotides. Nanomedicine. 2007;3:173–183. doi: 10.1016/j.nano.2007.03.006. [DOI] [PubMed] [Google Scholar]
- [43].Touitou E, Godin B, Karl Y, Bujanover S, Becker Y. Oleic acid, a skin penetration enhancer, affects Langerhans cells and corneocytes. J Control Release. 2002;80:1–7. doi: 10.1016/s0168-3659(02)00004-4. [DOI] [PubMed] [Google Scholar]
- [44].Francoeur ML, Golden GM, Potts RO. Oleic acid: its effects on stratum corneum in relation to (trans)dermal drug delivery. Pharm Res. 1990;7:621–627. doi: 10.1023/a:1015822312426. [DOI] [PubMed] [Google Scholar]
- [45].Naik A, Pechtold LARM, Potts RO, Guy RH. Mechanism of oleic acid-induced skin penetration enhancement in vivo in humans. J Control Release. 1995;37:299–306. [Google Scholar]
- [46].Marjukka Suhonen T, Bouwstra JA, Urtti A. Chemical enhancement of percutaneous absorption in relation to stratum corneum structural alterations. J Control Release. 1999;59:149–161. doi: 10.1016/s0168-3659(98)00187-4. [DOI] [PubMed] [Google Scholar]
- [47].Cevc G, Vierl U, Mazgareanu S. Functional characterisation of novel analgesic product based on self-regulating drug carriers. Int J Pharm. 2008;360:18–28. doi: 10.1016/j.ijpharm.2008.04.002. [DOI] [PubMed] [Google Scholar]
- [48].Puglia C, Blasi P, Rizza L, Schoubben A, Bonina F, Rossi C, Ricci M. Lipid nanoparticles for prolonged topical delivery: An in vitro and in vivo investigation. Int J Pharm. 2008;357:295–304. doi: 10.1016/j.ijpharm.2008.01.045. [DOI] [PubMed] [Google Scholar]
- [49].Kallish R, Wood J, Kydonies A, Wille J. Prevention of contact hypersensitivity to topically applied drugs by ethacrynic acid: potential application to transdermal drug delivery. J Control Release. 1997;48:79–87. [Google Scholar]
- [50].Choi SP, Kim SP, Kang MY, Nam SH, Friedman M. Protective Effects of Black Rice Bran against Chemically-Induced Inflammation of Mouse Skin. J Agric Food Chem. 2010;58:10007–10015. doi: 10.1021/jf102224b. [DOI] [PubMed] [Google Scholar]
- [51].Ansel JC, Kaynard AH, Armstrong CA, Olerud J, Bunnett N, Payan D. Skin-Nervous System Interactions. J Investig Dermatol. 1996;106:198–204. doi: 10.1111/1523-1747.ep12330326. [DOI] [PubMed] [Google Scholar]
- [52].Inoue H, Nagata N, Koshihara Y. Involvement of substance P as a mediator in capsaicin-induced mouse ear oedema. Inflamm Res. 1995;44:470–474. doi: 10.1007/BF01837912. [DOI] [PubMed] [Google Scholar]
- [53].Atarashi K, Kabashima K, Akiyama K, Tokura Y. Skin application of the nonsteroidal anti-inflammatory drug ketoprofen downmodulates the antigen-presenting ability of Langerhans cells in mice. Br J Dermatol. 2008;159:306–313. doi: 10.1111/j.1365-2133.2008.08683.x. [DOI] [PubMed] [Google Scholar]


