

Abstract
The Warburg effect describes a heightened propensity of tumor cells to produce lactic acid in the presence or absence of O 2. A generally held notion is that the Warburg effect is related to energy. Using whole‐genome, proteomic MALDI‐TOF‐MS and metabolite analysis, we investigated the Warburg effect in malignant neuroblastoma N2a cells. The findings show that the Warburg effect serves a functional role in regulating acidic pericellular pH (pHe), which is mediated by metabolic inversion or a fluctuating dominance between glycolytic‐rate substrate level phosphorylation (SLP) and mitochondrial (mt) oxidative phosphorylation (OXPHOS) to control lactic acid production. The results also show that an alkaline pHe caused an elevation in SLP/OXPHOS ratio (approximately 98% SLP/OXPHOS); while the ratio was approximately 56% at neutral pHe and approximately 93% in acidic pHe. Acidic pHe paralleled greater expression of mitochondrial biogenesis and OXPHOS genes, such as complex III–V (Uqcr10, Atp5 and Cox7c), mt Fmc1, Romo1, Tmem 173, Tomm6, aldehyde dehydrogenase, mt Sod2 mt biogenesis component PPAR‐γ co‐activator 1 adjunct to loss of mt fission (Mff). Moreover, acidic pHe corresponded to metabolic efficiency evidenced by a rise in mTOR nutrient sensor GβL, its downstream target (Eif4ebp1), insulin modulators (Trib3 and Fetub) and loss of catabolic (Hadhb, Bdh1 and Pygl)/glycolytic processes (aldolase C, pyruvate kinase, Nampt and aldose‐reductase). In contrast, alkaline pHe initiated loss of mitofusin 2, complex II–IV (Sdhaf1, Uqcrq, Cox4i2 and Aldh1l2), aconitase, mitochondrial carrier triple repeat 1 and mt biosynthetic (Coq2, Coq5 and Coq9). In conclusion, the Warburg effect might serve as a negative feedback loop that regulates the pHe toward a broad acidic range by altering lactic acid production through inversion of metabolic systems. These effects were independent of changes in O 2 concentration or glucose supply. (Cancer Sci, 2012; 103: 422–432)
Malignant tumor cells display an accelerated rate of glucose consumption with dominant reliance on substrate level phosphorylation (SLP) rather than oxidative phosphorylation (OXPHOS) to produce ATP. Heightened glycolytic activity is typically indicative of a metabolic response to lack of oxygen (O2). In cancer cells, this pattern occurs in the presence or absence of O2 with accumulation of lactic acid (Warburg effect). This aberrant metabolic pattern differs from normal tissue and, thereby, is useful for diagnostic purposes, as in the case of monitoring uptake of 18F‐fluorodeoxy‐glucose.1 Both accelerated rate of glycolysis and greater expression of lactic acid dehydrogenase (LDH) are characteristic of aggressive tumor cells;2 therefore, research aimed at unveiling the underlying purpose of the Warburg effect could be beneficial.
To date, the Warburg effect remains somewhat of a mystery. A review by Mentis and Kararizou3 suggests that diverse theories currently exist about its etiology, some of which include the involvement of oncogenes (Akt, Myc and Ras), mutations of the tricarboxylic acid cycle (TCA), alternative splicing of pyruvate kinase pre‐mRNA and epigenetic changes. Other studies suggest that the Warburg effect is involved with aberrant mitochondrial replication,4 post‐translational modification of glycolytic enzymes (i.e. 6‐phosphofructo‐1‐kinase),5 biomass or cell crowding,6, 7 mammalian target of rapamycin (RTK/PI3K/AKT/mTOR) signaling8 and lactate production as a potential utilizable substrate for adjacent cells.9 However, by and large, the general conclusion still remains that the Warburg effect is ultimately related to energy, an inefficient metabolic process,10 reliant on diverse ergogenic substrates to produce energy under hypoxia or glucose deprivation.11 While the Warburg effect might be related to energy, it is also clear that accumulation of lactate maintains a presiding influence over the acidic pericellular pH (pHe) circumscribing aggressive tumors. In turn, the presence of lactate is known to trigger aggressive forms of malignancy, to augment metastases, to increase chemoresistance and is correlated to low survival rates12, 13 Therefore, it is unclear if the Warburg effect plays a primary role in energy or maintaining an acidic pHe of the tumor microenvironment.
Physiological pH homeostasis is intricately related to processes involving both cellular metabolism and the ppO2/CO2.14 Therefore, rigid experimental controls should be set in place to eliminate interfering variables that indirectly alter pHe when studying the effect of hypoxia on tumor cells or the Warburg effect. Changes in pHe are introduced by factors such as the gas composition itself (O2, N2, CO2), metabolic response to the change in gas (lactate or CO2 released in a closed system), selected volume/depth of media, cell plating density, inherent metabolic rates or choice of buffering agents in the media, which could mask true effects.15 Studies should either utilize a means to control the pH to determine the true effect of gases, or should employ a means to hold the gases constant to study the effect of pH change.
The purpose of the present study is to investigate metabolic patterns in response to experimentally induced pHe shifts extending from acidic to basic under a uniform gas condition. The findings from this study show that the Warburg effect (heightened glycolysis and lactic acid production under adequate O2 concentration) appears to serve as a dynamic flexible negative feedback loop that regulates the pH of the microenvironment toward a broad acidic range in N2a cells. This effect is mediated by inversion of anaerobic–aerobic respiratory metabolic systems, which indirectly control lactic acid. Moreover, the findings in this study show that metabolic buffering by N2a cells involves molecular changes within the mitochondria, mTOR signaling and glycolysis.
Materials and Methods
Materials
Nitrocellulose/PVDF membranes, 10× Tris/glycine buffer, electrophoresis supplies (Biorad, Hercules, CA, USA), 1° antibodies raised in rabbit or mouse and 2° IgG HRP conjugated antibodies were purchased from Abcam (Cambridge, MA, USA) and Assay Biotech, (Sunnyvale, CA, USA). DMEM, l‐glutamine, FBS, heat‐inactivated, PBS, HBSS, penicillin/streptomycin and all other materials were purchased from Sigma Chemical (St. Louis, MO, USA).
Cell culture
CCL‐131 Neuro‐2a (N2a) malignant neuroblastoma cells were obtained from ATCC (Manassas, VA, USA). N2a cells were grown in DMEM containing phenol red, 10% FBS, 4 mM l‐glutamine, 20 μM sodium pyruvate and penicillin/streptomycin (100 U/0.1 mg/mL). The cells were maintained at 37°C in 5% CO2/atmosphere. Every 2–5 days, the medium was replaced and the cells were sub‐cultured. The experimental plating media consisted of DMEM, 1.8% FBS, penicillin/streptomycin (100 U/0.1 mg/mL, 2 mM sodium pyruvate and 3 mM l‐glutamine. For experiments, cells were plated in 96‐well plates or 75 cm3 flasks at a density of approximately 0.5 × 10⁶ cells/mL.
Experimental design
To evaluate cellular toxicity under either 100% N2 or 100% O2, gases were delivered into a closed system where media was pre‐equilibrated and pH was neutralized to 7.2, prior to addition of cells. Cells were then incubated in a closed chamber for 24 h at 37°C, with pH maintained at 7.2. To investigate the influence of pHe on N2a cells under uniform gas conditions (5% CO2/atmosphere), treatments were suited to accommodate 48 micro‐incremental pHe shifts using (0.0002–0.02 N HCl/0.004–0.08 N NaOH = final working concentrations) in 96 well plates. Media blanks were established for each concentration, and pHe plate readings were taken after addition of the cells and at 24 h to assess differences in pHe (initial) and pHe (final). Experiments requiring large amounts of mRNA or proteins for molecular analysis were carried out in 75‐cm3 flasks, where pHe was sustained to ensure cells were viable, pHe acidic (approximately 6.8), neutral (approximately 7.3) and alkaline (approximately 7.55).
Cell viability
Cell viability was assessed using resazurin oxidoreduction indicator dye. A working solution of resazurin was prepared in sterile HBSS minus phenol red (0.5 mg/mL).16 Reduction of the dye by viable cells reduces the amount of oxidized form and increases the amount of its bright red fluorescent intermediate. Quantitative analysis of dye conversion was measured on a microplate fluorometer: Model 7620‐version 5.02 (Cambridge Technologies, Watertown, MA, USA) set at 550/580 (excitation/emission). The data were expressed as % live control.
Determination of H+ concentration
Extra‐cellular pH was determined using a standard phenol red indicator dye and confirmed using a HANNA handheld portable pH checker (Sigma Chemical). The speed at which pH was determined was critical due to both composition of air and temperature affecting results; therefore, each plate was tested immediately upon exit of the incubator. Briefly, a phenol red stock solution (0.3 mg/mL water) was added (15% v/v) to the cell supernatants after 24 h. The change in pH was immediately assessed at 550 nm using a Spectra 190‐MAX UV spectrophotometric detector (Molecular devices, Sunnydale, CA, USA).
HPLC quantification of lactic acid and glucose
Determination of lactate and glucose concentrations were acquired using a Shimadzu HPLC system equipped with an SPD‐20A UV detector (set at 210 nm), a RID‐10A 120‐V refractive index detector, a workstation containing EZSTART version 7.4 software and an SS420X instrument interface docked to a Waters Autosampler Model 717 Plus (Shimadzu Scientific Instruments, Columbia, MD, USA; Waters, Milford, MA, USA). The flow rate was isocratic, being controlled by a Waters Model 510 pump at 0.6 mL/min. The mobile phase contained 5 mM sulfuric acid and the column used was an Aminex HPX‐87H 300 × 7.8 mm with 9 μm particle size (Bio‐Rad, Hercules, CA, USA). The run time was 16 min and injection volume was 25 μl. Samples were prepared by placing 35 μL cell supernatant into 200 μL of 5 mM sulfuric acid, immediately stored at −80°C. Prior to analysis, samples were thawed and 125 μL was added to 275 μL of 5 mM sulfuric acid. Glucose and lactate standard curves were established from preparations in distilled water and matrix blank controls, and spikes were run for every experimental treatment condition tested.
Whole genome expression profiling
Whole genome expression profiling was carried out on Agilent Mouse or 4 × 44‐k arrays (Beckman Coulter Genomics, Morrisville, NC, USA) from total RNA isolated from each sample. Briefly, the quantity of total RNA was determined by spectrophotometry (A260/280 ratio) and the size distribution was assessed by electropherogram using an Agilent Bioanalyzer. Using a Low Input Quick Amp Kit (Agilent Technologies, Palo Alto, CA, USA), following the manufacturer's protocol, 200 ng of total RNA was converted into labeled cRNA with nucleotides coupled to fluorescent Cy3 dye. Cy3‐labeled cRNA (1.65 μg) from each sample was hybridized to an Agilent Mouse Genome 4 × 44‐k array. The hybridized array was then washed and scanned, and data were extracted from the scanned image using Feature Extraction version 10.7 software (Agilent Technologies).
The data were analyzed by both Gene Sifter and manual analysis. Manual analysis was achieved by normalizing the raw data gProcessed signal to the average signal/sample hybridization for biological triplicates. Subsequently, a filtering of noise was established by omitting any gene below a threshold limit of gProcessed >500 to omit false positives that could arise from noise/low expression abundance. The ratios for each group were calculated, P‐values determined by Students t‐test and data analyzed by manual (i) examination of individual genes accounting for potential duplicates in the array using diverse primers for same gene, or by QC replicates (ii) sorting and analysis by greatest difference in intensity (expression dominance) with significance P < 0.05 and (iii) fold change. Next, the combined fold changes, P‐values for each set of hybridizations were classified manually by literature review and differential statistically relevant genes. Then, genes were entered into the “database for annotation, visualization and integrated discovery” (DAVID), where enrichment scores averaging less than 0.01 (P < 0.01) patterns were used in the discussion.17, 18
O 2 consumption: clark electrode
A Hanna HI 9142 O2 meter was used to measure dissolved oxygen as an indicator of cellular and mitochondrial respiration. The electrode was calibrated with both air saturated de‐ionized water and de‐ionized water with sodium dithionite. Briefly, 800 μL of cell supernatant versus blank controls were directly loaded into a small chamber. After rate equilibration, a 30‐s reading was taken for each sample. The temperature was maintained at 37°C.
Western blot
Briefly, after treatment, cells were washed, centrifuged and the supernatant discarded using ice‐cold sterile PBS at 4°C. The pellet was re‐suspended and homogenized/sonicated in a lysis buffer containing protease inhibitors. Samples were placed on ice for 30 min, and centrifuged at 10 000 g for 10 min at 4°C. The supernatant was assessed for protein concentration and added to 1:1 of Laemmli Sample Buffer (Biorad #161‐0737) + fresh β‐ME and boiled for 5 min. Approximately 50 μg of protein was loaded per lane and separated using 5–15% SDS‐PAGE gel, running buffer, 25 mM Tris, 192 mM glycine, pH 8.3 (Biorad #161‐0734) and applying 200 constant V constant for approximately 35 min. The proteins were transferred to polyvinylidene fluoride membranes (100 V for 30–60 min), in ice‐cold transfer buffer containing 25‐mM Tris, 192 mM glycine and 20% methanol. The membranes were placed in a blocking buffer consisting of 5% bovine serum albumin Fraction V (BSA) w/v in Tween/PBS buffer (TTBS) 0.01 M phosphate buffer, 0.0027 M KCl, 0.14 M NaCl, 0.05% Tween, pH 7.4. The membranes were washed and placed in 1° antibody (1:500–3000) 1% BSA in TTBS and 0.2% sodium azide at 4°C for 24 h. The membranes washed in TTBS and incubated in 2° anti‐mouse or rabbit IgG (Fc specific) peroxidase conjugate (1:4000) in 2% non‐fat dried milk on TTBS for 1 h at room temperature. After a final wash, peroxidase was detected using Sigma FAST DAB (3, 3′‐diaminobenzidine tetrahydrochloride) with a metal enhancer cobalt chloride. Images were scanned using an Epson Stylus CX‐8400 (Atlanta, GA, USA).
High‐resolution 2‐D gel electrophoresis
Cell lysates (150 μg of protein) were solubilized for 30 min with 2‐D rehydration/sample buffer (7 M urea, 2 M thiourea, 1% ASB‐14, 40 mM Tris) and 2% immobilized pH gradient (IPG) buffer pH 3–10 (Bio‐Rad, CA, USA). Proteins were absorbed and separated by charge overnight using ReadyStrip IPG Strips, pH 3–10 NL and focused by isoelectric point with the PROTEAN IEF Cell (system settings: 250 V rapid voltage ramping 30 min, 10 000 V slow voltage ramping 60 min, and 10 000 V rapid voltage ramping 50 kV h). The strips were incubated in equilibration buffer I with 6 M urea, 20% glycerol, 2% SDS, 2% DTT and 0.375 M Tris, pH 8.8, for 10 min at room temperature, then in equilibration buffer II with 6 M urea, 20% glycerol, 2% SDS, 2% iodoacetamide and 0.375 M Tris, pH 8.8. The strips were then loaded onto 6–18% SDS‐PAGE gels on 13.3 × 8.7 cm and run at 50 V overnight. ReadyPrep overlay agarose was added on top of the strip to secure it and included bromophenol blue tracking dye. A molecular standard was used to estimate relative mass (Mr). Gels were pre‐rinsed with water, stained overnight with Bio‐Safe Coomassie, destained in water, and scanned with the Versadoc Model 1000 system (Bio‐Rad). Gel image analyses were performed with PD Quest software (Bio‐Rad) version 7.4.0. Individual spot volumes for each gel were normalized relative to the total spot volume of that gel. Normalized spot volume data from each experimental set were analyzed using the Student's t‐test (P < 0.05 was regarded as significant). Spots twofold higher/lower were considered to be differentially regulated. All experiments were performed in biological and technical triplicates starting with the collection of cells.
Protein identification by peptide mass fingerprinting
Protein spots were excised and tryptic digests were analyzed by LC‐MS/MS. Briefly, protein spots from 2‐D gel were de‐stained with 50% acetonitrile in 50 mM ammonium carbonate. In‐gel tryptic digest was performed using reductively methylated trypsin (Promega, Madison, WI, USA). Before digestion, samples were reduced with DTT (10 mM in 50 mM ammonium carbonate for 60 min at 56°C) and subsequently alkylated with iodoacetamide (55 mM in 50 mM ammonium carbonate for 45 min in the dark at room temperature). The digestion reaction was performed overnight at 37°C. Digestion products were extracted from the gel followed by evaporation using an APD SpeedVac (ThermoSavant, Santa Clara, CA, USA). The dried tryptic digest samples were cleaned with ZipTip (CB18B; Millipore, Billerica, MA, USA) before analysis by tandem mass spectrometry for protein identification. The digested sample was resuspended in 10 μL of 60% acetic acid, injected via autosampler (Surveyor; Thermo Finnigan, San Jose, CA, USA) and subjected to reverse phase liquid chromatography using a Thermo Finnigan Surveyor MS Pump in conjunction with a BioBasic‐18 100 × 0.18‐mm reverse‐phase capillary column (Thermo Finnigan). Mass analysis was carried out using a Thermo Finnigan LCQ Deca XP Plusion trap mass spectrometer equipped with a nanospray ion source using a 4.5‐cm long metal needle (Hamilton; 950–00954) in a data‐dependent acquisition mode. Electrical contact and voltage application to the probe tip took place via the nanoprobe assembly. Spray voltage of the mass spectrometer was set to 2.9 kV and heated capillary temperature to 190°C. The column was equilibrated for 5 min at 1.5 μL/min with 95% solution A and 5% solution B (A, 0.1% formic acid in water; B, 0.1% formic acid in acetonitrile) before sample injection. A linear gradient was initiated 5 min after sample injection ramping to 35% A and 65% B after 50 min and 20% A and 80% B after 60 min. Mass spectra were acquired in the mass‐to‐charge ratio 400–1800 range. Protein identification was performed with the MS/MS search software Mascot 1.9 (Matrix Science, Boston, MA, USA), using confirmatory or complementary analyses with TurboSequest as implemented in the Bioworks Browser 3.2, build 41 (Thermo Finnigan).
Data analysis
Statistical analysis was performed using Graph Pad Prism (version 3.0; Graph Pad Software, San Diego, CA, USA) with significance of difference between the groups assessed using a one‐way anova, followed by Tukey's post‐hoc means comparison test, a two‐way anova or Student's t‐test.
Results
Tumor cells display resistance to hypoxia or mitochondrial toxins, provided ample glucose supply is sustained to drive SLP production of ATP.19 In contrast, high levels of O2 reportedly augment the effects of chemotherapy and attenuate tumor growth in rodents.20 Our study has revealed that tumor cells appear capable of surviving in diverse ambient gases, including high levels of O2, where two vulnerable limitations were observed: (i) a rise of pHe toward alkaline (induced from the gases themselves); or (ii) the depletion of glucose that arises from hypoxic accelerated glycolysis. In this study, gas injection of either 100% O2 or 100% N2 into a closed chamber caused an alkaline pHe shift (in excess of 7.8) in the media. If pHe was not pre‐neutralized prior to addition of N2a cells, we saw a loss of viability (data not shown). Here, we demonstrate that N2a cells continue to remain viable when cultured under hypoxic or hyperoxic conditions for 24 h, provided that the media remain continually buffered at approximately pHe (7.2) and ample glucose supply is maintained (Fig. 1). While level of O2 is not so much a factor in tumor survival, alkaline pHe is. A toxicity profile (Fig. 2) establishes tolerance of N2a cells to broad acidic pHe range, where a steep loss of viability occurs as pHe exceeds 7.6.
Figure 1.
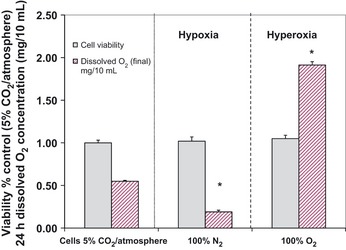
Toxicity profile of N2a cells in response to hyperoxia or hypoxia at a sustained pericellular pH 7.2. The data represent cell viability (% control) and dissolved O2 concentration (mg/10 mL) of the media after 24 h incubations at 37°C. Significance of difference between the control (5% CO2/atmosphere) and N 2 (hypoxic conditions) or O 2 (hyperoxic conditions) treated groups were determined by a one‐way anova followed by Tukey's post‐hoc test. *P < 0.01.
Figure 2.
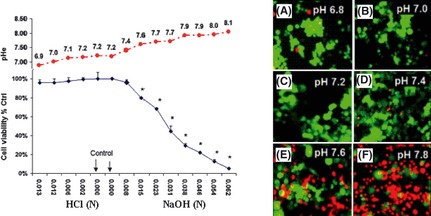
Toxicity profile of N2a cells in response to variation in pericellular pH (pHe) after 24 h incubation. The data represent viability (% control) (left panel) determined using almar blue assay and are presented as the mean ± SEM, n = 4. Corresponding pHe is presented and significance of difference between toxicity in controls versus treatment was determined by a one‐way anova followed by Tukey's post‐hoc test. *P < 0.01. Dual detection with fluorescence microscopy overlay was used as confirmation (right panel), where viable cells were imaged with fluorescein diacetate (green) and non‐viable cells using propidium iodide staining (red). pHe (A) 6.8, (B) 7.0, (C) 7.2, (D) 7.4, (E) 7.6 and (F) 7.8.
Given the loss of viability with minuscule elevation in pHe above neutral, we examined for metabolic patterns across a broad spectrum pHe (Fig. 3). The use of an aminex HPX‐87H carbohydrate analysis column and dual detection systems in HPLC application allowed for simultaneous quantification of a range of metabolites, including organic acids, carbohydrates and fermentation products within the same sample. The data show that a pHe dependent rise in lactic acid occurred at alkaline pHe in a linear fashion, even as the cells were approaching death. An equal but opposite pattern emerged under acidic conditions (Fig. 3): also presented as raw data chart readings (RI) and (UV‐210 nm) (Fig. 4A,B). These findings suggest that the metabolism of N2a cells and potentially other tumor cells could fluctuate from aerobic (acidic pHe) to anaerobic (alkaline pHe), not in response to change of energy demands or O2 supply, but rather to neutralize pHe toward a slight acidic by altering lactic acid production.
Figure 3.
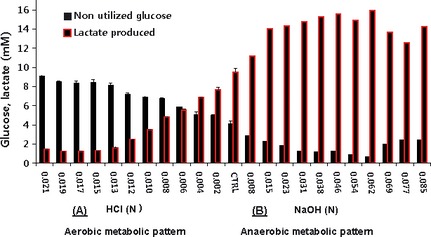
Effects of pericellular pH (pHe) on glucose to lactate conversion in N2a cells. The data represent lactic acid produced (mM) and glucose remaining (mM) (non‐utilized glucose) after 24‐h incubation at 5% CO2/atmosphere and are presented as the mean ± SEM (n = 4).
Figure 4.
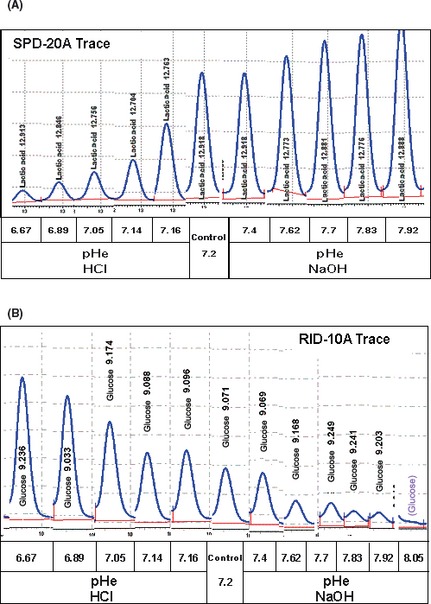
(A) Glycolytic lactate production in response to pericellular pH (pHe) shift from acidic to alkaline in N2a cells at 24 h. The data represent the raw data chart recording traces from the SPD‐20A UV detector (210 nm) quantifying lactic acid produced. (B) Glycolytic glucose remaining in response to pHe shift from acidic to alkaline in N2a cells at 24 h. The data represent the raw data chart recording traces from the RID‐10A 120 UV refractive index detector quantifying glucose remaining (consumed).
To evaluate whether the control of pHe on glucose/lactate conversion corresponds to a proclivity to buffer pHe, we compare profiles between media blank controls containing HCl to NaOH to cell supernatant acquired at 24 h (Fig. 5A,B). The data show that N2a cells will buffer externally introduced pHe shifts in both directions (acidic pHe or neutral/alkaline toward slight acidic). Moreover, Figure 5(B) (right‐hand panel) shows a gradually lessened capability of N2a cells to buffer alkaline pHe, likely due to cell death and/or exhaustion of energy supplies. Clearly, cross points within the buffering curves occurring under acidic and alkaline pHe (Fig. 5A,B right‐hand panels) suggest other molecular contributions are involved with buffering to complement that described. Further investigation will be required to elucidate these systems.
Figure 5.

The effect of acidic pericellular pH (A) or alkaline pHe (B) on buffering capability of N2a at 24 h. The data represent the optical density for phenol red indicator dye over a wavelength scan 500–600 nm in media blanks (left panel), presence of cells (middle panel) and a 550 nm comparison for media blanks versus cell supernatant across pHe. The data are presented by the mean ± SEM, n = 4 (right panel).
To understand the molecular events associated with pHe mediated metabolic inversion, expression profiles for proteins of interest were analyzed by western blot (Fig. 6). The data obtained show a slight positive change in the expression of LDH from acidic toward basic pHe. However, this change is minuscule and not likely to account for extensive metabolic inversion profiles, as shown in Figures 3 and 4. Similarly, the data also show slight changes from acidic pHe toward basic for glycogen synthase kinase‐3 alpha (which inactivates glycogen synthase, rendering greater glucose availability) and fructose‐bisphosphate aldolase A (which breaks down fructose 1,6‐bisphosphate into glyceraldehyde 3‐phosphate and dihydroxyacetone phosphate in glycolysis). Although these changes may contribute to pHe controlled metabolic inversion, the changes are meager, suggesting that additional processes are likely to be involved. Of the proteins evaluated, acidic pHe rendered significant loss of UDP glucose P2Y purinoceptor 14. While further research will be required to investigate a role for this receptor, it is believed that UDP‐glucose is released upon stress or cell damage and acts on P2Y14 to initiate signaling,21 which results in inhibition of adenylyl cyclase, reduced conversion of ATP to camp22 and accumulation of inositol phosphates, effects that might influence the rate of glycolysis in diverse cell systems.22, 23
Figure 6.
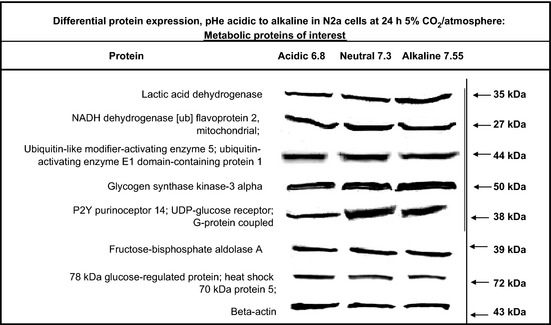
Relative expression for basic proteins of interest in N2a cells cultured under diverse pHe acidic (approximately 6.8), neutral (approximately 7.3) and alkaline (approximately 7.55) for 24 h.
Cell lysates were further subjected to 2‐D gel electrophoresis LC‐MS⁄MS proteomic analysis. Because it was not feasible to sequence all resolved proteins, the selection criteria for sequencing was based on gel image quantitative analysis of the 2‐D analysis (Table 1). Of over 300 protein spots, several met the criterion for a twofold or greater significance, P < 0.05. LC‐MS⁄MS and Mascot database matching resulted in successful identification of proteins, with spot densities over three gels per condition (P < 0.05) listed in Table 1. The data show acidic pHe‐mediated downregulation of aldolase C and pyruvate kinase (rate limiting control in glycolysis) (Fig. 7) and a rise of the acidic mitochondrial matrix protein p32 (complement component C1q), which is believed to play a role in mitochondrial biogenesis and OXPHOS.24 These events correspond to reduction of lactic acid, as shown in the Figures 3 and 4A,B.
Table 1.
Identification of proteins by peptide mass fingerprinting. Identification of differentially expressed proteins in N2a cells under pericellular pH acidic (approximately 6.8), neutral (approximately 7.3) and alkaline (approximately 7.55) for 24 h were determined by separation using 2‐D SDS–PAGE and identification using MALDI TOF MS for biological triplicates. For identification by LC‐MS⁄MS peptide sequencing, differentially expressed spots that were significant at P < 0.05 were selected
| SSP# | Protein ID | MWTheor/Exp | IpTheor/Exp | Exp.Score | Fold | Peptide | Express | |
|---|---|---|---|---|---|---|---|---|
| 2‐D Gel MALDI‐TOF MS ID of differentially expressed proteins in N2a cells | ||||||||
| 1 | 5705 | Pyruvate kinase | 58.37/55.69 | 7.18/7.87 | 6.30E‐64 | 2.1 | 27 | Acid ▼ |
| 2 | 5502 | Aldolase C, fructose‐bisphosphate | 39.76/36.42 | 6.67/7.47 | 3.97E‐20 | 2.9 | 15 | Acid ▼ |
| 3 | 5405 | G protein beta subunit like | 35.45/28.33 | 8.08/7.45 | 1.26E‐09 | – | 5 | Acid ▲ |
| 4 | 5003 | HSP 1 (chaperonin 10) | 10.95/10.12 | 7.93/7.78 | 1.99E‐08 | 2.4 | 4 | Acid ▲ |
| 5 | 1203 | Ferritin light chain 2 | 20.78/19.42 | 5.66/5.04 | 7.92E‐11 | – | 10 | Alkaline ▼ |
| 6 | 2811 | Unnamed protein product | 71.05/72.36 | 5.32/5.69 | 1.99E‐64 | – | 23 | Alkaline ▲ |
| 7 | 4202 | Peroxiredoxin 6 | 23.17/18.70 | 5.97/6.57 | 7.92E‐48 | – | 11 | Alkaline ▲ |
| 8 | 1204 | SET translocation | 24.90/17.13 | 5.43/4.92 | 1.99E‐27 | – | 7 | Acid ▼ Alkaline ▲ |
| 9 | 1401 | Acidic mit matrix protein p32 | 31.34/28.43 | 4.77/4.36 | 3.97E‐10 | 2.1 | 5 | Acid ▲ Alkaline ▼ |
| 10 | 1205 | Peroxiredoxin 2 | 21.93/19.78 | 5.20/5.10 | 6.30E‐36 | – | 7 | Acid ▲ Alkaline ▼ |
Exp, experimental; Exp. score, expectation score; Ip, isoelectric point; MW, molecular weight (kDa); Theor, Theoretical.
Figure 7.
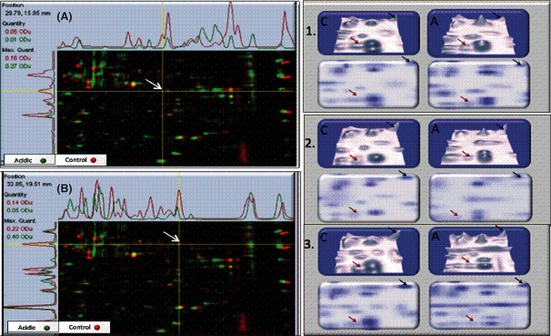
Multichannel (left) and 3‐D view (right) of aldolase C (A) (red arrows) and pyruvate kinase (B) (black arrows) exhibiting differential expression in N2a cells under pHe acidic (approximately 6.8) versus neutral controls (approximately 7.3).
Whole genome expression profiling was carried out on labeled cRNA coupled to fluorescent Cy3 hybridized to an Agilent Mouse Genome 4 × 44 k array (Beckman Coulter Genomics). Differential profiles with statistical significance <0.05 in groups with acidic pHe versus alkaline pHe were entered into the “database for annotation, visualization and integrated discovery” (DAVID), and patterns by enrichment scores are presented in Table 2.17, 18 Although not the focus of this study, the most striking observation was an acidic to alkaline pHe change in epigenetic reprogramming. These events signify that adaptive change requirements occur as the pHe shifts toward alkaline, which involved in excess of 100 genes with chromatin reorganization. In terms of metabolic gene patterns, influences on the mitochondria were identified where alkaline pHe elevated 52 genes with an enrichment score in excess of 2.0 and a P‐value of 1.6 E‐08. Of these, genes involved with greater OXPHOS under acidic pHe versus alkaline pHe are shown in Figure 8 overlapped on a KEGG diagram.25, 26, 27 Respectively, 80 gene shifts occurred in the opposite direction for the mitochondria (P‐value 3.4E‐04); however, these were not related to OXPHOS but rather processes involved with carbohydrate, fatty acid, mitochondrial or related metabolic activity (Tables S1 and S2). In summary, these findings show preliminary evidence that alkaline pHe evokes reduction of processes related to mitochondrial respiration or stability, and a rise in processes associated with catabolic breakdown of fatty acids or glycogen to provide energy. In contrast, acidic pHe versus control or neutral was associated with greater mitochondrial biogenesis, fusion and OXPHOS function. The pHe control over inversion of metabolic systems correlated to direct neutralizing effects through lactic acid production.
Table 2.
Gene‐annotation enrichment analysis, functional annotation clustering on statistically differentially expressed genes in N2a cells cultured under pericellular pH acidic (approximately 6.8) versus alkaline (approximately 7.55) for 24 h. Statistical DAVID genes were analyzed for annotation cluster enrichment scores. The data represent the database source (category), score and P‐values (Fisher exact/EASE score)
| Category | Enrichment score | Process | Count | P‐value | |
|---|---|---|---|---|---|
| Functional annotation clustering; differential upregulation by acid versus alkaline in N2a cells; Mus musculus; 487/380 DAVID IDs | |||||
| GPF, SPK, KP, USF, INT | 2.23 | tRNA metabolic process | 15 | 7.100E‐04 | Acid ▲ Alkaline ▼ |
| SPK, KP, USF, GCF | 2.18 | Mitochondria | 52 | 1.600E‐08 | Acid ▲ Alkaline ▼ |
| SPK, USF, GMF | 2.04 | Nucleotide and ATP‐binding | 48 | 1.400E‐03 | Acid ▲ Alkaline ▼ |
| GPF | 2.01 | RNA polymerase II promoter | 24 | 1.100E‐03 | Acid ▲ Alkaline ▼ |
| GPF | 1.78 | Pteridine metabolic process | 4 | 5.600E‐03 | Acid ▲ Alkaline ▼ |
| GPF, SPK, KP, USF, GMF, INT | 1.67 | Amino‐acid biosynthesis | 5 | 5.300E‐04 | Acid ▲ Alkaline ▼ |
| GPF, SPK, USF, GMF | 1.53 | Regulation of transcription | 60 | 2.100E‐03 | Acid ▲ Alkaline ▼ |
| Functional annotation clustering; differential upregulation by alkaline versus acid in N2a cells; Mus musculus; 1157/850 DAVID IDs | |||||
| GCF | 20.39 | Organelle lumen, nucleoplasm | 125 | 8.800E‐25 | Alkaline ▲ Acid ▼ |
| GPF | 17.35 | Non‐membrane‐bounded organelle | 151 | 2.300E‐16 | Alkaline ▲ Acid ▼ |
| GPF, SPK | 13.10 | M phase of mitotic cell cycle | 41 | 5.000E‐13 | Alkaline ▲ Acid ▼ |
| GPFSPK, KP, GCF | 10.60 | RNA Splicing | 37 | 5.000E‐13 | Alkaline ▲ Acid ▼ |
| GCF | 9.34 | Chromosome/chromatin | 63 | 1.700E‐21 | Alkaline ▲ Acid ▼ |
| GCF | 7.30 | Chromosome, centromeric region | 22 | 3.600E‐09 | Alkaline ▲ Acid ▼ |
| GPF, SPK | 7.24 | Chromatin organization/modification | 52 | 1.000E‐11 | Alkaline ▲ Acid ▼ |
| SPK, USF | 5.83 | ubl conjugation | 54 | 1.300E‐08 | Alkaline ▲ Acid ▼ |
| SPK, SM, INT | 5.64 | rna‐binding | 48 | 3.100E‐07 | Alkaline ▲ Acid ▼ |
| GPF, SPK, GMF | 4.55 | Regulation of transcription | 144 | 9.900E‐07 | Alkaline ▲ Acid ▼ |
| GCF | 4.49 | Histone deacetylase/chromatin | 10 | 3.600E‐06 | Alkaline ▲ Acid ▼ |
| SMINT | 4.14 | Like‐Sm ribonucleoprotein | 7 | 6.400E‐05 | Alkaline ▲ Acid ▼ |
| GCF | 3.82 | Nucleotide excision repair | 7 | 5.800E‐03 | Alkaline ▲ Acid ▼ |
| GPF, SPK, KP, USF | 3.58 | Macromolecule catabolic process | 52 | 7.800E‐06 | Alkaline ▲ Acid ▼ |
| SPK, GMF | 2.47 | Zinc finger | 86 | 8.200E‐06 | Alkaline ▲ Acid ▼ |
| GPF | 2.27 | Covalent chromatin modification | 12 | 3.300E‐03 | Alkaline ▲ Acid ▼ |
| SPK, GCF | 2.01 | Mitochondria | 80 | 3.400E‐04 | Alkaline ▲ Acid ▼ |
| GPF | 1.96 | Transcription repressor activity | 19 | 3.500E‐03 | Alkaline ▲ Acid ▼ |
Category abbreviations: GOTERM_BP_FAT (GPF), SP_PIR_KEYWORDS (SPK), Kegg Pathway (KP), UP_SEQ_FEATURE (USF), GOTERM_MF_FAT (GMF), GOTERM_CC_FAT (GCF), SMART (SM), INTERPRO (INT).
Figure 8.
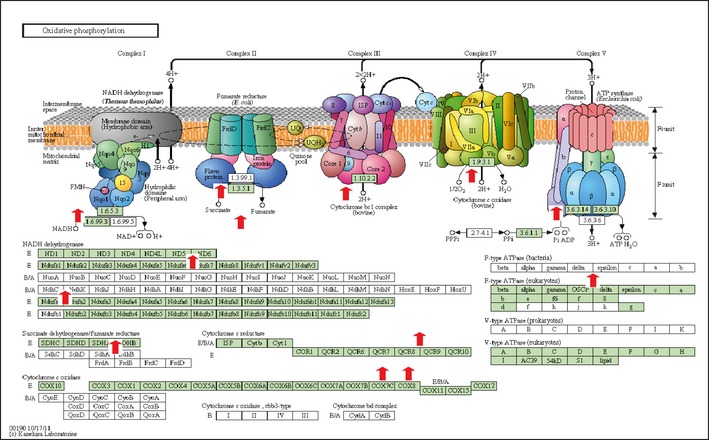
KEGG pathway mapping overlay for acidic pHe upregulated genes pertinent to OXPHOS. The data represent differential expression profiles specific to mitochondrial respiratory function for N2a cells cultured under pHe acidic (approximately 6.8) versus alkaline (approximately 7.55) for 24 h.
Discussion
The data from this study provide initial evidence that a prime function of the Warburg effect might extend beyond inefficient or deviant energy metabolism. These findings demonstrate that micro‐environmental pHe exerts control over the extent of glucose/lactate conversion (SLP); through changing mitochondrial respiration (OXPHOS) capacity thereby altering lactic acid production as a means of pH control. Moreover, these effects were not mediated by availability of glucose, change in O2 concentration and did not correlate to detectable changes in either protein or gene expression of hypoxia inducible factor‐1 α. These patterns are similar to respiratory rate control effects on physiological buffering systems, where metabolic acidosis/alkalosis correspond to changes in respiration as a compensatory buffering response.
In this study, a number of observations give the impression that a slight shift towards acidic pHe is associated with attenuated glucose use, less production of lactate and diverse molecular changes that reflect greater energy efficiency. These changes include: the attenuated protein expression of LDH, pyruvate kinase (rate limiting control); aldolase C and glycolytic genes; and enolase (Eno1), galactokinase 2 (Galk2), lactate dehydrogenase A (Ldha), phosphoglycerate mutase 1, triosephosphate isomerase 1 (Tpi1) aldose reductase (Gm8531, Akr1b3, Akr1b10) and nicotinate phosphoribosyltransferase domain containing one (Naprt1) tantamount to elevation of pyruvate, alanine transaminase (Gpt2). Of these glycolytic metabolic processes, Gpt2 has the greatest capacity for competitive substrate docking to pyruvate in a reversible enzyme reaction that converts pyruvate to l‐alanine and α‐ketoglutarate. This metabolic pathway occurs in diverse tumor cell lines,28 where C14 tracing studies show that this enzyme converts pyruvate to alanine, perhaps to a greater extent than pyruvate to lactate,29 suggesting a functional role that might serve useful under diverse environmental conditions. High levels of alanine are known to inhibit pyruvate kinase activity, in particular in aggressive stage tumor cells.30 Although future research will be required, it is possible that alanine plays a role in negative feedback on pyruvate kinase under acidic pHe.
Symbiotic effects of acidic pHe appeared to involve positive changes within the mitochondria, which could yield greater use of pyruvate through TCA cycle for aerobic energy production. The data show that acidic pHe corresponded to a rise in mitochondrial reactive oxygen species modulator 1 (Romo1), which is reportedly involved with tumor cell proliferation,31 “the formation of mitochondrial complexes 1 homolog” (Fmc1), mitochondrial aldehyde dehydrogenase (Aldh18a1), ATP synthase (Atp5g1), cytochrome c oxidase (Cox7c) and transmembrane protein 173 (Tmem173). These genes encode for a number of proteins involved with the function and synthesis of mitochondrial components. In contrast, acidic pHe initiated loss of gene expression for the mitochondrial fission factor (Mff), an effect that could render greater stability and OXPHOS capacity. Mff plays a negative role on mitochondria by altering size, shape and morphology in a process that is opposite to fusion.32 A loss of Mff, as in the case of acidity, would prevent fission‐mediated inactivation through mitochondrial fragmentation and separation33 due to lost tethering by dynamin proteins34, 35 Conversely, alkaline pHe initiated a loss of mitofusin 2 (Mfn2), which would lessen the adhesive tethering of mitochondria, rending inadequate exchange of proteins, mtDNA and required elements to maintain a strong constitution.36 Under alkaline culture conditions, the mitochondria appear vulnerable or unstable, evidence by diverse forces, including the loss of HCLS1 associated X‐1 (Hax1). The HAX1 gene encodes for a protein called HS‐1‐associated protein X‐1 (HAX‐1) located in nuclear matrix and the mitochondria, which blocks apoptosis through countering high concentrations of Ca+2, within the mitochondrial matrix37 and sarcoplasmic reticulum,38 and inhibiting caspase‐3.39 A loss of stability within mitochondria due to subsequent Ca+2overload under alkaline pH would lead to greater likelihood of permeability transition pore opening and, thus, cell death.40 The data in this study demonstrate onset of cell death as pHe rises above 7.4.
These findings show a potential ergonomic molecular advantage under an acidic pHe. For example, the data show elevation of SCAN domain‐containing 1 (Scand1), which encodes a SCAN box domain‐containing protein also known as peroxisome proliferator‐activated receptor‐γ coactivator 1‐α (PGC‐1α). This transcriptional co‐activator is a functional relative of PRC believed to contribute to mitochondrial biogenesis, yielding higher OXPHOS capacity.41 PRC binds to and activates nuclear respiratory factor 1 (NRF‐1), which, if silenced, results in ablated OXPHOS capacity.42, 43 The activation of PGC‐1α may have a role in augmenting the expression of the insulin nutrient sensor, tribbles homolog 3 (trb3), under acidic conditions.44 TRB3 protein levels are influenced by high glucose concentrations, often observed in association with type 2 diabetic patients, streptozotocin diabetic rats, Zucker fatty rats and a loss of insulin‐stimulated glucose transport.45 A number of metabolic shifts under acidity indicate change toward reduced insulin sensitivity, greater glucose availability and maximized nutrient efficiency.
Cells cultured under acidic pHe also showed differential elevated protein expression for nutrient sensor GβL (G protein, beta protein subunit‐like), a component of mTOR (mammalian target of rapamycin), PI3K/Akt signaling and its downstream eIF4E tumor promoting target.46 These changes are indicative that feedback sensors are receiving information to switch from anabolic to catabolic.47 The high levels of glucose present in the acidic media or a rise in cytosolic ATP/AMP would inactivate AMP‐activated protein kinase and activate mTOR signaling.48 Alkaline shift associated with a low nutrient signal would accompany higher levels of catabolic processes to provide adequate fuel in the form of ATP through SLP, so that lactate production can neutralize the rise in any alkaline pHe challenge. The equilibrium that controls mTOR signaling is maintained by adenylate kinase within the mitochondrial intermembrane space, and corresponding pH‐dependent shifts were also observed. These findings, while broad, also show that acidic pHe lessens expression of a large number of genes associated with catabolic energy yielding processes: hydroxyacyl‐Coenzyme A dehydrogenase/3‐ketoacyl‐Coenzyme A thiolase/enoyl‐Coenzyme A hydratase (trifunctional protein), beta subunit (Hadhb), carnitine palmitoyltransferase and 3‐hydroxybutyrate dehydrogenase, type 1 (Bdh1) in addition to glycogen phosphorylase (Pygl). Reduction of glycogen phosphorylase is again indicative of abundant energy supplies (in acidic media), where a slower degradation of glycogen breakdown would be required to supply glucose‐1‐phosphate to glycolysis. Tumor cells in general are energy wasteful (or do so to maintain high levels of lactate); however, this means a higher reliance on fuel storages, such as glycogen. Inhibition of these energy sources, as for the case with CP‐320626, will reduce cancer growth.49 Oddly, acidity was associated with a consistent loss of lipid biosynthetic processes across the spectrum, including that for stearoyl‐Coenzyme A desaturase 2 (Scd2), fatty acid desaturase 1 (Fads1) and Gm8163 farnesyl pyrophosphate synthase. It is difficult at this time to ascertain why this response occurred.
Major effects of alkaline pHe on genes than encode proteins involved with mitochondrial function involved losses of ubiquinol–cytochrome c reductase, complex III subunit VII (Uqcrq), cytochrome c oxidase subunit IV isoform 2 (Cox4i2), cytochrome c oxidase, subunit VIIc (Cox7c), ubiquinol‐cytochrome c reductase, complex III subunit X (Uqcr10), succinate dehydrogenase complex assembly factor 1 (Sdhaf1), flavin adenine dinucleotide synthetase, homolog (yeast) (Flad1) and mitochondrial coenzyme Q homologs (yeast). These effects accompanied reduction of aconitase 2, mitochondrial (Aco2) and mitochondrial glutaminase 2 (Gls2), which regulate the first series of events and transaminations that branch from the TCA cycle. Other mitochondrial enzymes adversely affected by alkalinity include aldehyde dehydrogenase 18 family, member A1 (Aldh18a1) ALDH. ALDH is regulated by TGF‐β signaling and, if silenced, will lead to loss of CD44(+) stem/progenitor migration and invasion properties,50 where elevation is associated with tumor growth.51 A pHe linear response was observed also for cytosolic (aldose reductase) (AR) (Akr1b8) (Akr1b3), which is likely to play a role in glycolysis. AR inhibitors show potential therapeutic value against solid hypoxic tumors, demonstrating block of metastatic invasion mediated by lessening signaling transduction of NF‐kB‐AP1.52 However, AR is a component of the polyol pathway, which catalyzes the NADPH‐mediated reduction of glucose to sorbitol for re‐entrance into glycolysis, where it conserves energy and may account for up to 25–30% of the glucose metabolism.53 In addition, while AR inhibitors or gene silencing show anti‐angiogenic properties and a loss of adhesion molecules ICAM, and VCAM,24 this enzyme is likely to play a role in glycolysis, although future research will be required to evaluate this. The data also show that acidic pHe lead to rise of the acidic mitochondrial matrix protein p32 (complement component C1q). Although little is know about this protein, it is harbored within the mitochondrial matrix, with a potential role in both OXPHOS and nuclear trafficking.24 It is also likely that its prime function may extend beyond metabolism and alter cytoskeletal organization or migration properties of human cancers.54
In addition, a few anomalies were noted, including the effects of pH on peroxiredoxin–thioredoxins. Although these proteins are known to play an important role in reactive oxidative stress, they are also required for iron–sulfur cluster biosynthesis (2Fe‐2S), iron homeostasis and iron‐responsive element–binding (IRE‐binding) activity of iron regulatory protein 1 IRP1. Similarly, acid can lead to loss of iron–sulfur cluster assembly 1 homolog (Saccharomyces cerevisiae) (Isca1). Future research will be required to examine whether these proteins have anything to do with oxidative reduction reactions required to fuel SLP/anaerobic metabolism or potentially the de novo synthesis of nucleotides. Other noted trends include an alkaline induced ± acidic suppressive effect on epigenetic chromatin remodeling genes (Hmgn2, Hmgb2, Hmgn1, H2afv, H2afz, H3A and Phf5a), nuclear pore trafficking (Kpna2, Nutf2 and nucleoporins 35, 37, 54, 62, 107, 133) and nucleophosmin 1. While outside the scope of this paper, it is believed that rapid epigenetic adaptation might be involved with greater ability of cancer cells to adapt to diverse conditions. Furthermore, several epigenetic modifying drugs, such as 5‐azacytidine (DNA methyltransferase inhibitors) (i.e. vidaza and decitabine), deazaneplanocin A (histone methyltransferase inhibitor) and belinostat (‐DAC) are now being evaluated for treatment of diseases, including cancer.54, 55 In the present study, the epigenetic activity associated with rise in pHe toward alkaline was consistently evidenced at the genomic level (Table 2).
In conclusion, this work provides a preliminary basis to suggest that the Warburg effect might expand beyond its role in energy metabolism and could be a primary means by which tumor cells can regulate the pace of glycolysis (glucose/lactate conversion) to neutralize the microenvironment. The negative feedback system involves a rapid switch between acid‐mediated mitochondrial OXPHOS (lactate production is halted) or excessive lactate produced by SLP, with a rise in alkalinity. These effects are independent of energy requirements and/or levels of O2. Future research is required to assess whether similar observations are consistent among tumor cells of diverse species and phenotype.
Disclosure Statement
The authors have no conflict of interest.
Supporting information
Table S1. Whole genome analysis of differentially expressed genes in N2a cells under pHe acidic (approximately 6.8) or alkaline (approximately 7.55) versus neutral (approximately 7.3) for 24 h.
Table S2. Whole genome analysis of differentially expressed genes in N2a cells under pHe acidic (approximately 6.8) versus alkaline (approximately 7.55) for 24 h.
Acknowledgments
This research was supported by a grant from the National Institutes of Health (NIH), Division of National Center of Research Resources (NCRR), Research Centers in Minority Institutions (RCMI) program (G12 RR03020) at Florida A & M University and an NIH‐RCMI Grant (2G12RR03035) at Universidad Central del Caribe, School of Medicine (Bayamon, PR, USA). The authors wish to thank the mass spectrometry facility at the University of Texas Medical Branch, Galveston, Texas, for the mass spectrometry service.
References
- 1. Champion L, Brain E, Giraudet AL et al Breast cancer recurrence diagnosis suspected on tumor marker rising: value of whole‐body 18FDG‐PET/CT imaging and impact on patient management. Cancer 2011; 117: 1621–9. [DOI] [PubMed] [Google Scholar]
- 2. Serganova I, Rizwan A, Ni X et al Metabolic imaging: a link between lactate dehydrogenase A, lactate, and tumor phenotype. Clin Cancer Res 2011; 17: 6250–61. [DOI] [PMC free article] [PubMed] [Google Scholar]
- 3. Mentis AF, Kararizou E. Metabolism and cancer: an up‐to‐date review of a mutual connection. Asian Pac J Cancer Prev 2010; 11: 1437–44. [PubMed] [Google Scholar]
- 4. Shapovalov Y, Hoffman D, Zuch D, de Mesy Bentley KL, Eliseev RA. Mitochondrial dysfunction in cancer cells due to aberrant mitochondrial replication. J Biol Chem 2011; 286: 22331–8. [DOI] [PMC free article] [PubMed] [Google Scholar]
- 5. Smerc A, Sodja E, Legisa M. Posttranslational modification of 6‐phosphofructo‐1‐kinase as an important feature of cancer metabolism. PLoS ONE 2011; 6: e19645. [DOI] [PMC free article] [PubMed] [Google Scholar]
- 6. Shlomi T, Benyamini T, Gottlieb E, Sharan R, Ruppin E. Genome‐scale metabolic modeling elucidates the role of proliferative adaptation in causing the Warburg effect. PLoS Comput Biol 2011; 7: e1002018. [DOI] [PMC free article] [PubMed] [Google Scholar]
- 7. Vazquez A, Oltvai ZN. Molecular crowding defines a common origin for the Warburg effect in proliferating cells and the lactate threshold in muscle physiology. PLoS ONE 2011; 6: e19538. [DOI] [PMC free article] [PubMed] [Google Scholar]
- 8. Sun Q, Chen X, Ma J et al Mammalian target of rapamycin up‐regulation of pyruvate kinase isoenzyme type M2 is critical for aerobic glycolysis and tumor growth. Proc Natl Acad Sci USA 2011; 108: 4129–34. [DOI] [PMC free article] [PubMed] [Google Scholar]
- 9. Whitaker‐Menezes D, Martinez‐Outschoorn UE, Lin Z et al Evidence for a stromal‐epithelial “lactate shuttle” in human tumors: MCT4 is a marker of oxidative stress in cancer‐associated fibroblasts. Cell Cycle 2011; 10: 1772–83. [DOI] [PMC free article] [PubMed] [Google Scholar]
- 10. Vander Heiden MG, Cantley LC, Thompson CB. Understanding the Warburg effect: the metabolic requirements of cell proliferation. Science 2009; 324: 1029–33. [DOI] [PMC free article] [PubMed] [Google Scholar]
- 11. Zaugg K, Yao Y, Reilly PT et al Carnitine palmitoyltransferase 1C promotes cell survival and tumor growth under conditions of metabolic stress. Genes Dev 2011; 25: 1041–51. [DOI] [PMC free article] [PubMed] [Google Scholar]
- 12. Onozuka H, Tsuchihara K, Esumi H. Hypoglycemic/hypoxic condition in vitro mimicking the tumor microenvironment markedly reduced the efficacy of anticancer drugs. Cancer Sci 2011; 102: 975–82. [DOI] [PubMed] [Google Scholar]
- 13. Hirschhaeuser F, Sattler UG, Mueller‐Klieser W. Lactate: a metabolic key player in cancer. Cancer Res 2011; 71: 6921–5. [DOI] [PubMed] [Google Scholar]
- 14. Grant BJ. Influence of Bohr‐Haldane effect on steady‐state gas exchange. J Appl Physiol 1982; 52: 1330–7. [DOI] [PubMed] [Google Scholar]
- 15. Shiomi S, Kawabe J. Clinical applications of positron emission tomography in hepatic tumors. Hepatol Res 2011; 41: 611–7. [DOI] [PubMed] [Google Scholar]
- 16. Evans SM, Casartelli A, Herreros E et al Development of a high throughput in vitro toxicity screen predictive of high acute in vivo toxic potential. Toxicol In Vitro 2001; 15: 579–84. [DOI] [PubMed] [Google Scholar]
- 17. Huang da W, Sherman BT, Lempicki RA. Bioinformatics enrichment tools: paths toward the comprehensive functional analysis of large gene lists. Nucleic Acids Res 2009; 37: 1–13. [DOI] [PMC free article] [PubMed] [Google Scholar]
- 18. Huang da W, Sherman BT, Lempicki RA. Systematic and integrative analysis of large gene lists using DAVID bioinformatics resources. Nat Protoc 2009; 4: 44–57. [DOI] [PubMed] [Google Scholar]
- 19. Mazzio E, Soliman KF. D–(+)‐glucose rescue against 1‐methyl‐4‐phenylpyridinium toxicity through anaerobic glycolysis in neuroblastoma cells. Brain Res 2003; 962: 48–60. [DOI] [PubMed] [Google Scholar]
- 20. Stuhr LE, Iversen VV, Straume O, Maehle BO, Reed RK. Hyperbaric oxygen alone or combined with 5‐FU attenuates growth of DMBA‐induced rat mammary tumors. Cancer Lett 2004; 210: 35–40. [DOI] [PubMed] [Google Scholar]
- 21. Harden TK, Sesma JI, Fricks IP, Lazarowski ER. Signalling and pharmacological properties of the P2Y receptor. Acta Physiol (Oxf) 2010; 199: 149–60. [DOI] [PMC free article] [PubMed] [Google Scholar]
- 22. Jacobson KA, Deflorian F, Mishra S, Costanzi S. Pharmacochemistry of the platelet purinergic receptors. Purinergic Signal 2011; 7: 305–24. [DOI] [PMC free article] [PubMed] [Google Scholar]
- 23. Bruni P, Vasta V, Berti L, Avila MA, Farnararo M, Varela‐Nieto I. An inositol phosphoglycan stimulates glycolysis in human platelets. Biochem Biophys Res Commun 1991; 180: 1041–7. [DOI] [PubMed] [Google Scholar]
- 24. Matthews DA, Russell WC. Adenovirus core protein V interacts with p32 – a protein which is associated with both the mitochondria and the nucleus. J Gen Virol 1998; 79: 1677–85. [DOI] [PubMed] [Google Scholar]
- 25. Kanehisa M, Goto S, Furumichi M, Tanabe M, Hirakawa M. KEGG for representation and analysis of molecular networks involving diseases and drugs. Nucleic Acids Res 2010; 38: D355–60. [DOI] [PMC free article] [PubMed] [Google Scholar]
- 26. Kanehisa M, Goto S. KEGG: kyoto encyclopedia of genes and genomes. Nucleic Acids Res 2000; 28: 27–30. [DOI] [PMC free article] [PubMed] [Google Scholar]
- 27. Kanehisa M, Goto S, Hattori M et al From genomics to chemical genomics: new developments in KEGG. Nucleic Acids Res 2006; 34: D354–7. [DOI] [PMC free article] [PubMed] [Google Scholar]
- 28. Gallagher FA, Kettunen MI, Day SE et al Detection of tumor glutamate metabolism in vivo using (13)C magnetic resonance spectroscopy and hyperpolarized 1‐(13)Cglutamate. Magn Reson Med 2011; 66: 18–23. [DOI] [PubMed] [Google Scholar]
- 29. Darpolor MM, Yen YF, Chua MS et al In vivo MRSI of hyperpolarized 1‐(13) C pyruvate metabolism in rat hepatocellular carcinoma. NMR Biomed 2010; 24: 506–13. [DOI] [PMC free article] [PubMed] [Google Scholar]
- 30. Javalkar VK, Vinod KY, Sharada S, Chandramouli BA, Subhash MN, Kolluri VR. Study of pyruvate kinase activity in human astrocytomas – alanine‐inhibition test revisted. Neurol India 2009; 57: 140–2. [DOI] [PubMed] [Google Scholar]
- 31. Chung JS, Lee SB, Park SH et al Mitochondrial reactive oxygen species originating from Romo1 exert an important role in normal cell cycle progression by regulating p27(Kip1) expression. Free Radic Res 2009; 43: 729–37. [DOI] [PubMed] [Google Scholar]
- 32. Gomes LC, Di Benedetto G, Scorrano L. During autophagy mitochondria elongate, are spared from degradation and sustain cell viability. Nat Cell Biol 2011; 13: 589–98. [DOI] [PMC free article] [PubMed] [Google Scholar]
- 33. Huang P, Galloway CA, Yoon Y. Control of mitochondrial morphology through differential interactions of mitochondrial fusion and fission proteins. PLoS ONE 2011; 6: e20655. [DOI] [PMC free article] [PubMed] [Google Scholar]
- 34. Merrill RA, Dagda RK, Dickey AS et al Mechanism of neuroprotective mitochondrial remodeling by PKA/AKAP1. PLoS Biol 2011; 9: e1000612. [DOI] [PMC free article] [PubMed] [Google Scholar]
- 35. Palmer CS, Osellame LD, Laine D, Koutsopoulos OS, Frazier AE, Ryan MT. MiD49 and MiD51, new components of the mitochondrial fission machinery. EMBO Rep 2011; 12: 565–73. [DOI] [PMC free article] [PubMed] [Google Scholar]
- 36. Kowald A, Kirkwood TB. Evolution of the mitochondrial fusion–fission cycle and its role in aging. Proc Natl Acad Sci USA 2011; 108: 10237–42. [DOI] [PMC free article] [PubMed] [Google Scholar]
- 37. Vafiadaki E, Papalouka V, Arvanitis DA, Kranias EG, Sanoudou D. The role of SERCA2a/PLN complex, Ca (2+) homeostasis, and anti‐apoptotic proteins in determining cell fate. Pflugers Arch 2009; 457: 687–700. [DOI] [PubMed] [Google Scholar]
- 38. Zhao W, Waggoner JR, Zhang ZG et al The anti‐apoptotic protein HAX‐1 is a regulator of cardiac function. Proc Natl Acad Sci USA 2009; 106: 20776–81. [DOI] [PMC free article] [PubMed] [Google Scholar]
- 39. Li WB, Feng J, Geng SM et al Induction of apoptosis by Hax‐1 siRNA in melanoma cells. Cell Biol Int 2009; 33: 548–54. [DOI] [PubMed] [Google Scholar]
- 40. Ichas F, Mazat JP. From calcium signaling to cell death: two conformations for the mitochondrial permeability transition pore. Switching from low‐ to high‐conductance state. Biochim Biophys Acta 1998; 1366: 33–50. [DOI] [PubMed] [Google Scholar]
- 41. D'Errico I, Salvatore L, Murzilli S et al Peroxisome proliferator‐activated receptor‐gamma coactivator 1‐alpha (PGC1alpha) is a metabolic regulator of intestinal epithelial cell fate. Proc Natl Acad Sci USA 2011; 108: 6603–8. [DOI] [PMC free article] [PubMed] [Google Scholar]
- 42. Scarpulla RC. Nuclear control of respiratory chain expression by nuclear respiratory factors and PGC‐1‐related coactivator. Ann N Y Acad Sci 2008; 1147: 321–34. [DOI] [PMC free article] [PubMed] [Google Scholar]
- 43. Andersson U, Scarpulla RC. Pgc‐1‐related coactivator, a novel, serum‐inducible coactivator of nuclear respiratory factor 1‐dependent transcription in mammalian cells. Mol Cell Biol 2001; 21: 3738–49. [DOI] [PMC free article] [PubMed] [Google Scholar]
- 44. Koo SH, Satoh H, Herzig S et al PGC‐1 promotes insulin resistance in liver through PPAR‐alpha‐dependent induction of TRB‐3. Nat Med 2004; 10: 530–4. [DOI] [PubMed] [Google Scholar]
- 45. Liu J, Wu X, Franklin JL et al Mammalian Tribbles homolog 3 impairs insulin action in skeletal muscle: role in glucose‐induced insulin resistance. Am J Physiol Endocrinol Metab 2010; 298: E565–76. [DOI] [PMC free article] [PubMed] [Google Scholar]
- 46. Rouschop KM, Dubois L, Schaaf MB et al Deregulation of cap‐dependent mRNA translation increases tumour radiosensitivity through reduction of the hypoxic fraction. Radiother Oncol 2011; 99: 385–91. [DOI] [PubMed] [Google Scholar]
- 47. Kimball SR, Jefferson LS. Signaling pathways and molecular mechanisms through which branched‐chain amino acids mediate translational control of protein synthesis. J Nutr 2006; 136: 227S–31S. [DOI] [PubMed] [Google Scholar]
- 48. Roe CR, Mochel F. Anaplerotic diet therapy in inherited metabolic disease: therapeutic potential. J Inherit Metab Dis 2006; 29: 332–40. [DOI] [PubMed] [Google Scholar]
- 49. Lee WN, Guo P, Lim S et al Metabolic sensitivity of pancreatic tumour cell apoptosis to glycogen phosphorylase inhibitor treatment. Br J Cancer 2004; 91: 2094–100. [DOI] [PMC free article] [PubMed] [Google Scholar]
- 50. van den Hoogen C, van der Horst G, Cheung H, Buijs JT, Pelger RC, van der Pluijm G. The aldehyde dehydrogenase enzyme 7A1 is functionally involved in prostate cancer bone metastasis. Clin Exp Metastasis 2011; 28: 615–25. [DOI] [PMC free article] [PubMed] [Google Scholar]
- 51. Kim MP, Fleming JB, Wang H et al ALDH activity selectively defines an enhanced tumor‐initiating cell population relative to CD133 expression in human pancreatic adenocarcinoma. PLoS ONE 2011; 6: e20636. [DOI] [PMC free article] [PubMed] [Google Scholar]
- 52. Ramana KV. Aldose reductase: new Insights for an old enzyme. Biomol Concepts 2011; 2: 103–14. [DOI] [PMC free article] [PubMed] [Google Scholar]
- 53. Tammali R, Reddy AB, Srivastava SK, Ramana KV. Inhibition of aldose reductase prevents angiogenesis in vitro and in vivo. Angiogenesis 2011; 14: 209–21. [DOI] [PMC free article] [PubMed] [Google Scholar]
- 54. Stresemann C, Bokelmann I, Mahlknecht U, Lyko F. Azacytidine causes complex DNA methylation responses in myeloid leukemia. Mol Cancer Ther 2008; 7: 2998–3005. [DOI] [PubMed] [Google Scholar]
- 55. Hayden A, Johnson PW, Packham G, Crabb SJ. S‐adenosylhomocysteine hydrolase inhibition by 3‐deazaneplanocin an analogues induces anti‐cancer effects in breast cancer cell lines and synergy with both histone deacetylase and HER2 inhibition. Breast Cancer Res Treat 2011; 127: 109–19. [DOI] [PubMed] [Google Scholar]
Associated Data
This section collects any data citations, data availability statements, or supplementary materials included in this article.
Supplementary Materials
Table S1. Whole genome analysis of differentially expressed genes in N2a cells under pHe acidic (approximately 6.8) or alkaline (approximately 7.55) versus neutral (approximately 7.3) for 24 h.
Table S2. Whole genome analysis of differentially expressed genes in N2a cells under pHe acidic (approximately 6.8) versus alkaline (approximately 7.55) for 24 h.