Abstract
We previously demonstrated a cardiac mitochondrial biogenic response in insulin resistant mice that requires the nuclear receptor transcription factor PPARα. We hypothesized that the PPARα coactivator peroxisome proliferator-activated receptor gamma coactivator-1 alpha (PGC-1α) is necessary for mitochondrial biogenesis in insulin resistant hearts and that this response was adaptive. Mitochondrial phenotype was assessed in insulin resistant mouse models in wild-type (WT) versus PGC-1α deficient (PGC-1α−/−) backgrounds. Both high fat-fed (HFD) WT and 6 week-old Ob/Ob animals exhibited a significant increase in myocardial mitochondrial volume density compared to standard chow fed or WT controls. In contrast, HFD PGC-1α−/− and Ob/Ob-PGC-1α−/− hearts lacked a mitochondrial biogenic response. PGC-1α gene expression was increased in 6 week-old Ob/Ob animals, followed by a decline in 8 week-old Ob/Ob animals with more severe glucose intolerance. Mitochondrial respiratory function was increased in 6 week-old Ob/Ob animals, but not in Ob/Ob-PGC-1α−/− mice and not in 8 week-old Ob/Ob animals, suggesting a loss of the early adaptive response, consistent with the loss of PGC-1α upregulation. Animals that were deficient for PGC-1α and heterozygous for the related coactivator PGC-1β (PGC-1α−/−β+/−) were bred to the Ob/Ob mice. Ob/Ob-PGC-1α−/−β+/− hearts exhibited dramatically reduced mitochondrial respiratory capacity. Finally, the mitochondrial biogenic response was triggered in H9C2 myotubes by exposure to oleate, an effect that was blunted with shRNA-mediated PGC-1 “knockdown”. We conclude that PGC-1 signaling is important for the adaptive cardiac mitochondrial biogenic response that occurs during the early stages of insulin resistance. This response occurs in a cell autonomous manner and likely involves exposure to high levels of free fatty acids.
Keywords: diabetes, insulin resistance, cardiomyopathy, mitochondria, heart failure, metabolism
1. INTRODUCTION
Mounting evidence suggests that diabetic cardiac dysfunction is linked to derangements in myocardial energy metabolism [1, 2]. The high-energy demands of the mammalian heart necessitate efficient and dynamic fuel utilization to maintain constant ATP production. This is accomplished by oxidation of fats and glucose in a high capacity mitochondrial system. Significant progress has been made in delineating the transcriptional regulatory circuitry involved in the development and maintenance of cardiac myocyte mitochondria [3–6]. The nuclear receptor transcription factors, peroxisome proliferator-activated receptor alpha (PPARα) and estrogen-related receptor alpha (ERRα), and their coactivators PPAR gamma coactivator-1 (PGC-1) α and β, cooperate to maintain high postnatal expression of cardiac genes involved in multiple mitochondrial energy transduction pathways. In the setting of insulin resistance, glucose utilization by the cardiomyocyte is constrained, forcing the heart to rely predominantly on fatty acids as the chief energy substrate. This shift towards mitochondrial fatty acid oxidation (FAO) as the main source of ATP is mediated, at least in part, by PPARα, which regulates the transcription of genes involved in fatty acid (FA) uptake and oxidation [7, 8]. Accordingly, the activity of PPARα is chronically increased in the heart and skeletal muscle of animal models with insulin resistance and in the early stages of diabetes [8–10]. However, it is likely that this adaptive metabolic reprogramming response ultimately fails, giving way to a “lipotoxic” cardiomyopathy characterized by myocyte lipid accumulation.
Increasing evidence suggests that cardiac mitochondrial dysfunction develops during the transition from insulin resistance to diabetes, setting the stage for a vicious cycle of increased FA delivery in the context of reduced mitochondrial fat burning capacity [9, 11–13]. Studies in animal models and in humans have identified cardiac mitochondrial dysfunction in the setting of type II diabetes. For example, the hearts of patients with diabetes exhibit reduced phosphocreatine/ATP ratios [14] and diminished respiratory function in atrial tissue [15]. Similarly, the hearts of rodent models of type II diabetes display evidence for reduced mitochondrial respiratory capacity [9, 11, 16]. Interestingly, mitochondrial functional derangements in the diabetic heart appear to ensue following an initial adaptive biogenic response. We, and others, have documented a mitochondrial biogenic response in the hearts of mouse models of insulin resistance and insulin deficiency [9, 17–19]. We have shown that activation of PPARα is required for this early mitochondrial biogenic response in mice [9]. This response likely involved upstream master regulatory factors such as PGC-1α, which boosts the activity of a variety of transcription factors, in addition to PPARα, to orchestrate a mitochondrial biogenic response [20, 21]. Indeed, the PGC-1α gene is expressed at higher levels in hearts of obese animals [9, 12], and is associated with increased mitochondrial number in cardiac myocytes [9]. In later stages of diabetes, PGC-1α expression is downregulated and mitochondrial architecture is deranged (Supplemental Figure 1) [12].
The present study was designed to test the hypothesis that PGC-1α is necessary for the mitochondrial biogenesis response of the insulin resistant mouse heart. Using PGC-1 loss-of-function strategies, we show that PGC-1α and PGC-1β serve overlapping functions in the adaptive mitochondrial biogenesis response in insulin resistant mice.
2. METHODS
2.1 Animal Models and diet studies
PGC-1α−/− animals have been described previously [5, 22]. Two independent lines of either wild-type (WT) or PGC-1α−/− animals were derived from the original breeding, both in the C57BL6 background. For high fat (HF) diet studies, 1 month old male and female mice were fed for 10 weeks a diet composed of 43% calories from fat (TD01381, Harlan Teklad, Madison WI) containing triglycerides (TAGs) composed of long-chain FA. Ob/Ob transgenic mice (Jackson laboratories) were crossed with PGC-1α−/− mice, both in the C57BL6 background, to initially generate Ob/+-PGC-1α+/− mice, which were subsequently bred to generate PGC-1α−/− and Ob/Ob-PGC-1α−/− mice. These animals were compared to the WT-Ob/Ob line. PGC-1α−/−β+/− mice have been described [4] and were bred to Ob/Ob-PGC-1α−/− mice in order to generate pups of four different genotypes: PGC-1α−/−, Ob/Ob-PGC-1α−/−, PGC-1α−/−β+/−, and Ob/Ob-PGC-1α−/−β+/−. All four genotypes were used for comparative analyses. All animal experiments were conducted in accordance with NIH guidelines for humane treatment of animals and reviewed by the Animal Studies Committee of Washington University School of Medicine (WUSM).
2.2 Glucose Tolerance Testing
Prior to studies animals were fasted overnight and then injected with 1gm/kg of D-glucose as previously described [23]. The area under the curve (AUC) was defined as the baseline glucose levels and the deflection caused by glucose challenge. Total AUC was calculated using the trapezoidal rule.
2.3 Myocardial Triglyceride Quantification and Plasma Chemistries
Total tissue TAG and serum FA, TAG, and cholesterol levels were determined by enzymatic, colorimetric assays (Thermo Scientific, Waltham, MA and Wako Pure Chemical Industries, Ltd. Osaka, Japan) in the Nutrition Oriented Research Center (NORC) core at WUSM. Insulin levels were determined by immunoassay in the WUSM Core Laboratory for Clinical Studies.
2.4 RNA isolation and rtPCR
Total RNA was isolated from hearts by the RNAzol method (Tel-Test, Friendswood, Tex) as described previously [24]. First-strand cDNA was generated, and real-time reverse-transcription polymerase chain reaction (rtPCR) was performed with triplicate reactions as described previously [22]. Arbitrary units of target mRNA were corrected by measuring the levels of 36B4 RNA. The mouse-specific primer and probe sets have been described previously [9].
2.5 Western Blotting
Crude nuclear extracts were prepared as previously described [25]. 50 μg of nuclear extract was loaded on a 7.5% polyacrylamide gel. Western blot was performed with a PGC-1α antibody (EMD ST1202) as described.[25]
2.6 mtDNA quantitation
Genomic/mitochondrial DNA was isolated and quantified as previously described [4]. Mitochondrial DNA (mtDNA) content was quantified by real-time rtPCR. In brief, five nanograms of DNA were assayed in triplicate with Sybrgreen core reagents (Applied Biosystems, Foster City, CA) and NADH deyhdrogenase subunit 1 (ND1, mitochondrial) or lipoprotein lipase (LpL, nuclear) primers and a MX3000P QPCR System (Agilent Technologies, Santa Clara, CA). mtDNA per nuclear genome was calculated as the ratio of ND1 DNA to LpL DNA quantity. Primer sequences have been described [4].
2.7 Echocardiographic studies
Transthoracic M-mode and 2-dimensional echocardiography was performed on conscious mice (n=6–8 males and 3–4 females per group) as described previously [26], using a Vevo 770 Ultrasound System equipped with a 30 MHz transducer (VisualSonics Inc, Toronto, Ontario, Canada). Echocardiograms were first obtained under baseline conditions in a semi-conscious state of anesthesia (Avertin 0.05 mg/g body weight IP), which maintains hemodynamic parameters at a near physiologic level. Under these conditions (HR ~650 bpm), the early and late phases of diastolic LV filling occur near simultaneously, thereby precluding the use of standard echo parameters to noninvasively evaluate diastolic filling. To overcome these limitations, after completion of baseline recordings, a selective sinus node inhibitor (Zatebradine 0.01 mg/g body weight IP) was administered to slow the heart rate to a point where Doppler parameters of early and late diastolic filling are clearly discernable (HR ~450 bpm). Within the range of affected heart rate, the overall hemodynamic affect of Zatabradine is minimal, with no significant direct effect on loading conditions or myocardial contractility (unpublished validation data).
2.8 Electron microcopy and volume density quantification
Papillary muscle was dissected from the left ventricle of the heart, fixed, and sectioned as described previously [22]. Cardiac mitochondrial and myofibrillar volume densities were determined from electron micrographs as described previously [5, 22]. For each animal, 3 different fields were quantified at the magnification 10,000x in a blinded fashion. Data are expressed as mean volume density (volume of mitochondria or myofibrils [μm3] per cytoplasmic volume [μm3]) in each field.
2.9 Mitochondrial respiration
Mitochondrial respiration was assessed in saponin-permeabilized cardiac fibers as described previously [9, 11]. Oxygen consumption (V·O2) was measured at 25°C with an optical probe (Oxygen FOXY probe, Ocean Optics, Dunedin, FL) in the presence of palmitoyl-L-carnitine (0.02 mmol/L) and malate (2 mmol/L). After measurement of basal respiration, maximal (ADP-stimulated) state 3 respiration was determined by exposing the fibers to 1 mmol/L ADP, and then respiration in the absence of ADP phosphorylation was determined in the presence of 1 mg/mL oligomycin. Respiration rates are expressed as nanomoles of O2 per minute per milligram of dry fiber weight.
2.10 Cell Culture Studies
H9c2 cells were maintained at 37°C under 5% CO2 in Dulbecco’s modified Eagle’s medium (DMEM) supplemented with 10% fetal calf serum (FCS). 48 h post-plating, medium was changed to DMEM containing 1% fetal calf serum to promote differentiation. Transduction with adenovirus siRNA was performed 4 days after plating. For oleate treatment, cells were treated with 100uM oleate-BSA (Sigma) in DMEM containing 1% FCS for 24 hour prior to assay. RNA was harvested using the RNAqueous 4PCRKit (Ambion) following manufacture’s recommendations. For OCR studies, myoblasts were seeded at 8000 cells/well in a Seahorse XF96 culture plate (Seahorse Bioscience). Twenty four hours following oleate addition, the media was changed to DMEM without serum and incubated for 1hr. Oxygen consumption rates were measured on the Seahorse XF96 Extracellular Flux analyzer (Seahorse Bioscience Inc.)
2.11 GSH Assay
Total reduced glutathione was measured using the Bioxytech GSH/GSSG-412 kit (OxisResearch), as described. Frozen heart tissue was homogenized in 255 μl of homogenization buffer (10mmol/L Tris pH 7.4, 3mmol/L EDTA, 0.25mol/L sucrose.) The homogenate was centrifuged at 600 × g and 50 μl of the supernatant was added to 50 μl of 5% metaphosphoric acid. The sample was again centrifuged at 1000 × g and the supernatant was diluted 1:25 for the final assay. The final assay was modified based on the manufacturers instructions for use with a 96 well plate. Absorbance was measured at 412nm. Total GSH was normalized to protein which was quantified using the BCA method (Thermo Scientific).
2.12 Statistics
For quantitative data, statistical comparisons were made using analysis of variance coupled to Neumann-Keul’s test or Student’s t test assuming unequal variances. All data are presented as means ± standard error (SE), with a statistically significant difference defined as p < 0.05.
3. RESULTS
3.1 Loss of PGC-1α blunts the cardiac mitochondrial biogenic response in glucose intolerant mice
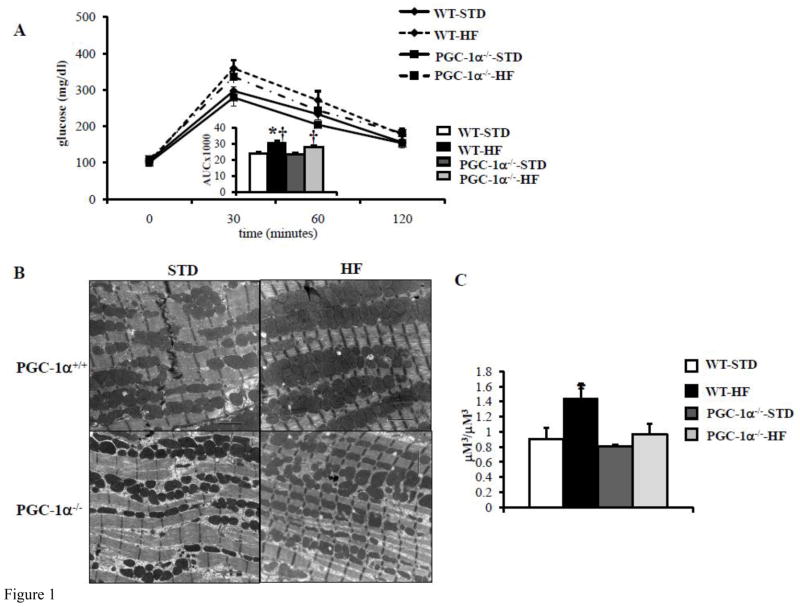
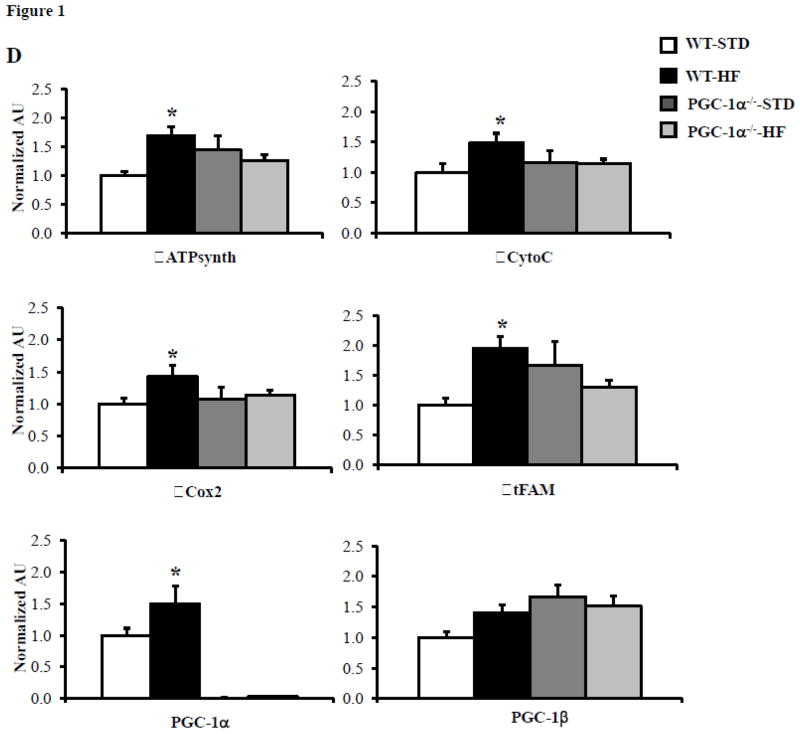
We evaluated the effect of PGC-1α deficiency on high fat (HF) diet-induced cardiac mitochondrial biogenesis. To this end, WT and PGC-1α deficient (PGC-1α−/−) mice were placed on standard or HF diet for 10 weeks. Glucose tolerance testing (GTT) confirmed glucose intolerance (Figure 1A) in both WT and PGC-1α deficient (PGC-1α−/−) mice (Figure 1A). Electron microscopy (EM) studies conducted on left ventricular (LV) papillary muscle sections revealed an increase in mitochondrial number and volume density in the WT animals, but not in the PGC-1α−/− hearts after HF-feeding (Figures 1B and 1C). Interestingly, mitochondrial DNA levels were not significantly different among the groups (data not shown). The expression of several genes involved in mitochondrial oxidative phosphorylation (OXPHOS) (ATP synthase beta (ATPsyn), cytochrome oxidase 2 (Cox2), Cytochrome C (CytoC)) and mitochondrial biogenesis programs (PGC-1α, mitochondrial transcription factor A (tFAM)) were increased in the HF-fed WT hearts but not in HF-fed PGC-1α−/− hearts (Figure 1D). These data strongly suggest that the observed increase in PGC-1α expression in insulin resistant hearts is required for a normal mitochondrial biogenic response.
Figure 1. PGC-1α deficiency blunts mitochondrial biogenesis response in glucose intolerant mice.
A) Mean blood glucose (±SE) levels during GTT after 10 weeks of HF diet, (n=5–8). Total area under the glucose excursion curve (± SE) is displayed in the inset for the GTT. B) Representative EMs from papillary muscle from WT and PGC-1α−/− hearts on either high fat (HF) or standard (STD) diets. Black bars=2 micron length. C) Quantitative measurement of mitochondrial/myofibril cellular volume density (μm3/μm3) based on analysis of EMs (n=5 animals/group). D) Quantitative real-time rtPCR analysis of cardiac transcripts encoding ATP synthase beta (ATPsyn), Cytochrome C (cyto C), Cytochrome C oxidase 2 (Cox2), mitochondrial transcription factor A (tFAM), PGC-1α and PGC-1β in WT and PGC-1α−/− hearts from HF or STD diet. (n=9) Bars represent mean (± SE) arbitrary unit (AU) normalized to the WT value (=1.0) in each case. * p < 0.05 vs WT, † p < 0.05 vs PGC-1α−/−.
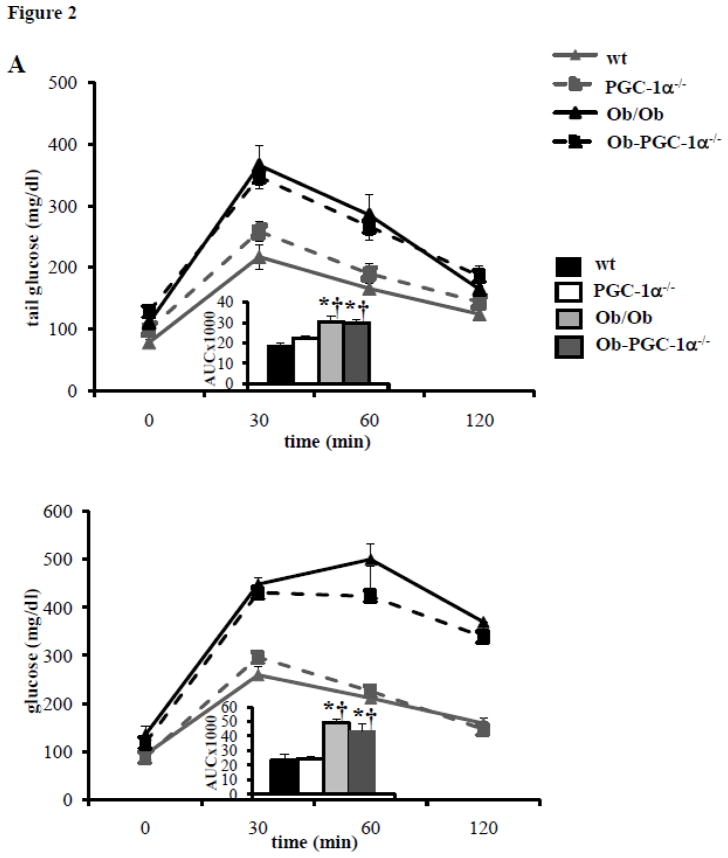
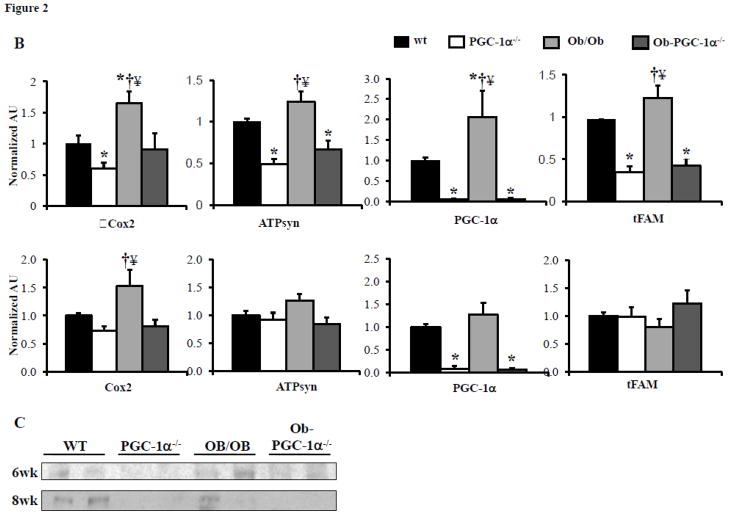
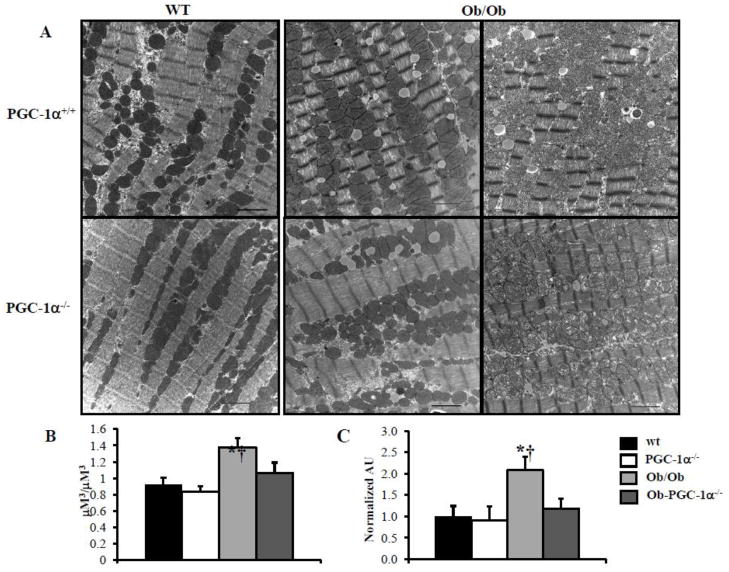
To further assess the role of PGC-1α in the mitochondrial response of the insulin resistant heart, Ob/Ob mice were crossed with PGC-1α−/− animals to obtain four mouse groups: WT, PGC-1α−/−, Ob/Ob, and Ob/Ob-PGC-1α−/−. Both Ob/Ob and Ob/Ob-PGC-1α−/− animals at 8 weeks of age had similar increases in body weight compared to the WT and PGC-1α−/− groups (Supplemental Table 1). In addition, Ob/Ob animals had significantly increased plasma TAG and FFA (Supplemental Table 1) and increased myocardial TAG levels (Supplemental Table 2). This response was similar in the Ob/Ob-PGC-1α−/− animals, although the Ob/Ob-PGC-1α−/− plasma TAG level increase did not reach statistical significance compared to WT or PGC-1α−/− animals. Plasma insulin levels and the HOMA-IR index were markedly increased in both Ob/Ob and Ob/Ob-PGC-1α−/− animals compared to WT and PGC-1α−/− animals (Supplemental Table 3). GTTs demonstrated modest glucose intolerance at 6 weeks (Figure 2A, top) and severe glucose intolerance at 8 weeks (Figure 2A, bottom) in both Ob/Ob and Ob/Ob-PGC-1α−/− animals (Figures 2A and 2B). As in the HF diet fed animals, the expression of the genes encoding OXPHOS targets (Cox2 and ATPsyn), PGC-1α, and tFAM were increased in the 6 week-old Ob/Ob hearts compared to the WT controls (Figure 2B, top). Protein levels of PGC-1α were also increased in Ob/Ob animals (Figure 2C). In contrast, Ob/Ob animals in the PGC-1α−/− background did not exhibit an upregulation of the OXPHOS genes or tFAM. Indeed, ATPsyn and tFAM mRNA levels were significantly downregulated in Ob/Ob-PGC-1α−/− compared to WT mice (Figure 2B, top). Interestingly, PGC-1α gene and protein expression were not upregulated in the 8 week-old Ob/Ob hearts (Figures 2B, bottom, and 2C). Additionally, consistent with a deficiency of PGC-1α, ATPsyn and tFAM transcripts were not upregulated. We speculate that this change in gene expression profile in Ob/Ob hearts may be related to the difference in degree of glucose intolerance. We have previously found that PPAR α was associated with the mitochondrial biogenesis response in insulin resistant hearts.[9] PPARα expression was also evaluated and we found an increase in PPARα expression at 6 weeks of age that was absent in 8 week old hearts (Supplemental Figure 2). Interestingly, PGC-1α deficiency was associated with PPARα expression levels similar to WT in both age groups. These data suggest a regulatory loop between PPARα and its co-activator PGC-1α. Evaluation of the mitochondria in the 8 week-old hearts by EM (Figure 3A) and quantification of mtDNA revealed a robust increase in both (Figures 3B and 3C) in Ob/Ob hearts. Interestingly, the volume density and mtDNA increase was not present in the Ob/Ob- PGC-1α−/− hearts compared to WT. These data indicate that PGC-1α is necessary to maintain a mitochondrial biogenic response.
Figure 2. Characterization of glucose tolerance and cardiac mitochondrial target gene expression in Ob/Ob mice.
A) Mean blood glucose (±SE) levels during GTT in 6 week (top) and 8 week-old (bottom) animals (n=6–10). Total area under the glucose excursion curve (± SE) is displayed in the inset for the GTT. B) Quantitative real-time rtPCR analysis of cardiac transcripts encoding genes as noted in Figure 1. Top- 6 week-old, bottom- 8 week-old. (n=9/genotype). Bars represent mean (± SE) arbitrary unit (AU) normalized to the WT value (=1.0) in each case. C) Representative Western blot for cardiac PGC-1α at 6 weeks and 8 weeks of age. * p < 0.05 vs WT, † p < 0.05 vs PGC-1α−/−, ¥ p < 0.05 vs Ob/Ob-PGC-1α−/−.
Figure 3. Mitochondrial biogenesis is blunted in PGC-1α deficient Ob/Ob animals.
A) Representative EMs from papillary muscle from WT, PGC-1α−/−, Ob/Ob and Ob/Ob-PGC-1α−/− hearts at 8 weeks of age. White bars=2 micron length. B) Quantitative measurement of mitochondrial/myofibril cellular volume density (μm3/μm3) based on analysis of EMs (n=5 animals/group), displayed on left. Mean cardiac mtDNA levels (right panel) determined by real-time PCR analysis shown as arbitrary units (AU) (n=5–7 hearts/group) normalized to the WT value (=1.0). * p < 0.05 vs WT, † p < 0.05 vs PGC-1α−/−.
3.2 Loss of PGC-1α results in decreased mitochondrial respiratory capacity in glucose intolerant animals
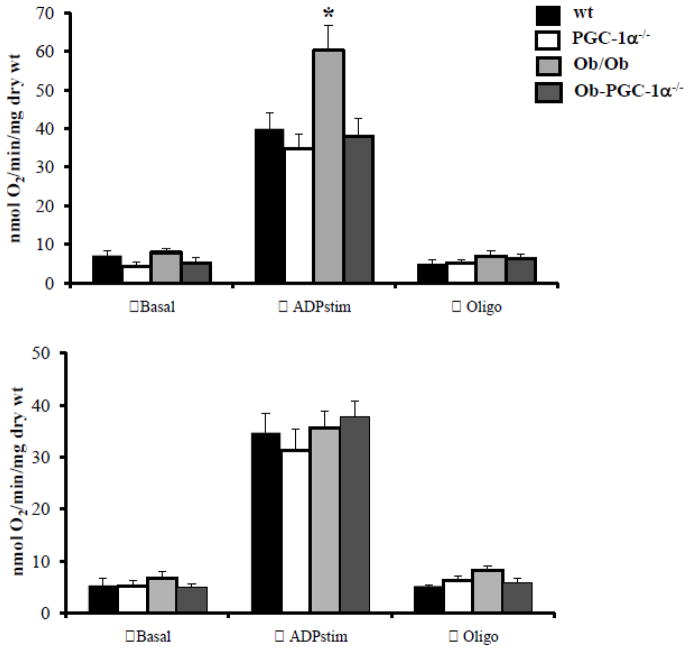
We next sought to evaluate the impact of PGC-1α deficiency on cardiac mitochondrial respiratory capacity in the insulin resistant models. Oxygen consumption was measured in saponin-permeabilized left ventricular muscle strips from WT, PGC-1α−/−, Ob/Ob, and Ob/Ob-PGC-1α−/− animals at both 6 and 8 weeks of age using palmitoyl-carnitine (PC) with malate (to assess FA oxidative capacity). At 6 weeks of age, the Ob/Ob mice had normal basal but significantly increased maximal respiratory capacity (ADP-stimulated oxygen consumption, Figure 3A) compared to WT animals, consistent with previous results demonstrating that FAO is increased in insulin resistant hearts [2, 10, 12, 27]. Interestingly, Ob/Ob-PGC-1α−/− muscle strips demonstrated a maximal respiratory capacity that was significantly diminished compared to Ob/Ob-WT strips (Figure 4, top), indicating that PGC-1α is necessary for upregulation of cardiac mitochondrial respiratory function in Ob/Ob animals at this age. This loss of maximal respiratory capacity compared to WT-Ob/Ob hearts is consistent with our gene expression data (Figure 2B, top). In striking contrast to the 6 week-old hearts, mitochondrial oxygen consumption was no longer increased in 8-week old Ob/Ob animals compared to WT mice (Figure 4, bottom). This finding is consistent with the lack of upregulated gene expression for mitochondrial metabolic targets, suggesting a loss of adaptive PGC-1α response over time. However, the increase in ADP-stimulated respiration was also absent in 8 week-old Ob/Ob-PGC-1α−/− hearts, suggesting that loss of PGC-1α does not further worsen mitochondrial function in this context.
Figure 4. Mitochondrial respiration is impaired in PGC-1α deficient Ob/Ob animals.
Mitochondrial respiration rates (V·O2) in saponin-permeabilized muscle strips prepared from WT, PGC-1α−/−, Ob/Ob and Ob/Ob-PGC-1α−/− hearts in the presence of palmitoyl-L-carnitine/malate at 6 weeks (top) and 8 weeks (bottom) of age. Mean values (± SE) are shown for basal, state 3 (ADP-stimulated), and oligomycin inhibited (oligo) respiration. (n=6 animals/group). * p < 0.05 vs WT.
One potential explanation for the changes in mitochondrial function between 6 weeks and 8 weeks of age is increased uncoupled respiration and/or reactive oxygen species production. To evaluate this possibility we have measured mRNA expression levels of UCP2 and UCP3 and protein expression of UCP3. There was no difference between expression levels in either group at 6 weeks or 8 weeks of age (data not shown). We have also evaluated GSH levels as a marker of oxidative stress. Interestingly, GSH levels were not different between WT and Ob/Ob or Ob/Ob-PGC-1α−/− animals at 6 weeks of age (Supplemental Figure 3A). However, by 8 weeks of age, when respiratory function declines in Ob/Ob animals, GSH levels trended lower (p=0.057), suggesting that oxidative stress may play a role in this process (Supplemental Figure 3B). However, deficiency of PGC-1α did not further alter the GSH levels.
We next investigated the cardiac functional impact of the mitochondrial biogenic responses in the Ob/Ob heart in wild-type and PGC-1α-deficient states. Echocardiograms (ECHOs) were performed in 8 week-old WT, PGC-1α−/−, Ob/Ob, and Ob/Ob-PGC-1α−/− animals. Parameters of systolic function such as LV fractional shortening were similar across the groups. However, mild alterations in diastolic function were noted in the Ob/Ob mice (Table 1). Specifically, the E/E′ velocity ratio was prolonged, and the isovolumic contraction time (IVCT) was shortened. However, despite the fact that loss of PGC-1α impacted mitochondrial number, function, and target gene mRNA expression in 8 week-old animals, we did not note any other differences in ECHO parameters in the Ob/Ob-PGC-1α−/− animals compared to Ob/Ob mice.
Table 1.
Systolic Echocardiogram parameters
| WT | PGC-1α−/− | Ob/Ob | Ob/Ob-PGC1α−/− | |
|---|---|---|---|---|
| Body Wt (gms) | 22.6 ± 1.1 | 19.9 ± 0.8 | 40.7 ± 1.0*† | 37.2 ± 0.8*† |
| HR | 637 ± 13 | 634 ± 7 | 631 ± 13 | 623 ± 9 |
| LVPWd | 0.669 ± 0.02 | 0.67 ± 0.015 | 0.738 ± 0.04 | 0.621 ± 0.02¥ |
| IVSd | 0.688 ± 0.02 | 0.704 ± 0.017 | 0.735 ± 0.04 | 0.638 ± 0.02 |
| LVIDd | 3.34 ± 0.07† | 3.02 ± 0.11 | 3.65 ± 0.13† | 3.44 ± 0.06† |
| LVPWs | 1.40 ± 0.06 | 1.42 ± 0.01 | 1.52 ± 0.05 | 1.42 ± 0.02 |
| IVSs | 1.42 ± 0.05 | 1.43 ± 0.05 | 1.51 ± 0.05 | 1.43 ± 0.02 |
| LVIDs | 1.66 ± 0.08 | 1.43 ± 0.1 | 1.89 ± 0.13† | 1.66 ± 0.06 |
| LVM | 69.0 ± 2.9 | 59.7 ± 2.6 | 89.6 ± 6.9 | 65.7 ± 3.1 |
| LVMI | 3.09 ± 0.17 | 3.01 ± 0.1 | 2.20 ± 0.13*† | 1.78 ± 0.1*† |
| RWT | 0.408 ± 0.02 | 0.461 ± 0.02 | 0.409 ± 0.03 | 0.367 ± 0.01† |
| FS (%) | 50.4 ± 1.8 | 53.0 ± 1.8 | 48.8 ± 2.0 | 51.7 ± 1.3 |
HR = heart rate, LV = left ventricle, LVPWd = LV posterior wall, diastole (mm), IVSd = interventricular septum, diastole (mm), LVIDd = LV internal dimension, diastole (mm), LVPWs = LV posterior wall, systole (mm), IVSs = interventricular septum, systole (mm), LVIDs = LV internal dimension, systole (mm), LVM = LV mass (mg), LVMI – LVM indexed to weight, RWT = relative wall thickness (LVPWd+IVSd/LVIDd), FS = fractional shortening (%), p < 0.05 vs WT,
p < 0.05 vs PGC-1α−/−,
p < 0.05 vs Ob/Ob
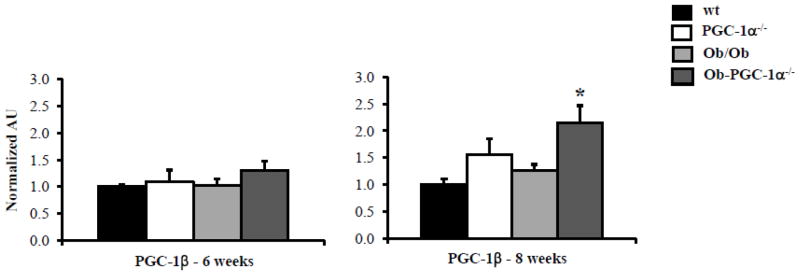
One possible explanation for the similar mitochondrial respiration capacity and our inability to detect a ventricular functional difference in the 8 week-old Ob/Ob-PGC-1α−/− hearts is that the other PGC-1 isoform, PGC-1β, compensates. Indeed, we have shown that PGC-1β and PGC-1α have overlapping roles in cardiac metabolism and transcriptional regulation of mitochondrial metabolism [4]. Quantification of PGC-1β gene expression in the hearts of the 6 and 8 week-old animals revealed that PGC-1 β mRNA levels were unchanged at the 6 week time point in any of the mouse groups (Figure 5). However, by 8 weeks of age, PGC-1β was significantly increased in Ob/Ob-PGC-1α−/− hearts compared to WT (Figure 5). These data suggest that PGC-1β is also regulated by worsening glucose tolerance and that it may compensate for the loss of PGC-1α in the Ob/Ob-PGC-1α−/− animals.
Figure 5. PGC-1β compensates for loss of PGC-1α in older Ob/Ob-PGC-1α−/− animals.
Quantitative real-time rtPCR analysis of cardiac transcript for PGC-1 β in 6 week and 8 week-old animals. (n=9–12/genotype). Bars represent mean (± SE) arbitrary unit (AU) normalized to the WT value (=1.0) in each case. * p < 0.05 vs WT.
3.3 PGC-1β deficiency worsens mitochondrial deficits in Ob/Ob-PGC-1α−/− Mice
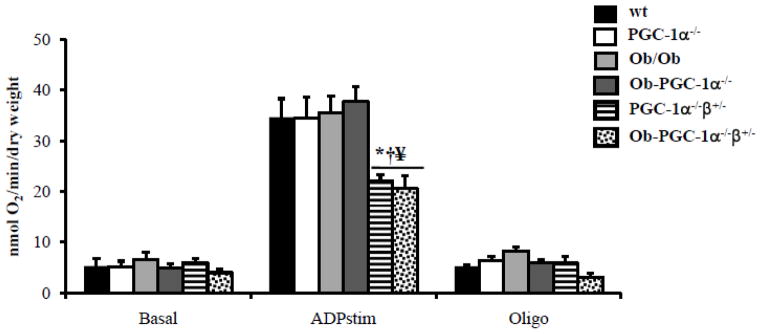
Complete loss of both PGC-1 isoforms is lethal in the neonatal period [4]. Thus, we sought to assess the role of PGC-1β in maintaining mitochondrial oxygen consumption in Ob/Ob, PGC-1α deficient animals, by crossing Ob/Ob animals to animals that lacked PGC-1α and were heterozygous for PGC-1β (PGC-1α−/−β+/−). This mating resulted in 4 animals groups: PGC-1α−/−, PGC-1α−/−β+/−, Ob/Ob-PGC-1α−/−, and Ob/Ob-PGC-1α−/−β+/−. The PGC-1α−/−β+/− animals had a 50% decrease in PGC-1β mRNA levels (Supplemental Figure 4) compared to animals with just PGC-1α deficiency. Supplemental Tables 4 and 5 document body weight, plasma parameters, and myocardial TAG for the four mouse groups at 8 weeks of age. Both Ob/Ob-PGC-1α−/− and Ob/Ob-PGC-1α−/− β+/− mice had increased body weight, increased plasma TAG and cholesterol, and increased myocardial TAG compared to controls. GTTs performed in these animals demonstrated that 8 week-old Ob/Ob-PGC-1α−/−β+/− mice had similar degrees of glucose intolerance compared to Ob/Ob-PGC-1α−/− animals (Supplemental Figure 2B). Additionally, plasma insulin levels and the HOMA-IR index were increased in Ob/Ob-PGC-1α−/− and Ob/Ob-PGC-1α−/−β+/− mice to a similar degree (Supplemental Table 6). Echocardiographs did not reveal significant differences in cardiac functional parameters in the Ob/Ob-PGC-1α−/−β+/− mice compared to Ob/Ob-PGC-1α−/− animals. However, when mitochondrial oxygen consumption in 8 week-old PGC-1α−/−β+/− and Ob/Ob-PGC-1α−/−β+/− hearts was compared to our previous data we noted that the PGC-1α−/−β+/− and Ob/Ob-PGC-1α−/−β+/− hearts demonstrated a marked reduction in oxygen consumption compared to all other groups (Figure 6). These data suggest that PGC-1α and β serve overlapping roles in maintaining mitochondrial FAO capacity in insulin resistant hearts, such that loss of both isoforms reduces mitochondrial capacity.
Figure 6. Mitochondrial respiration is severely impaired with combined deficiency of PGC-1α and PGC-1β.
Mitochondrial respiration rates (V·O2) in saponin-permeabilized muscle strips prepared from WT, PGC-1α−/−, Ob/Ob, Ob/Ob-PGC-1 α−/−, PGC-1α−/−β+/− and, Ob/Ob-PGCα−/−β+/− hearts in the presence of palmitoyl-L-carnitine/malate at 6 weeks (top) and 8 weeks (bottom) of age. Mean values (± SE) are shown for basal, state 3 (ADP-stimulated), and oligomycin inhibited (oligo) respiration. (n=6 animals/group). * p < 0.05 vs WT, † p < 0.05 vs PGC-1α−/−, § p < 0.05 vs Ob/Ob, ¥ p < 0.05 vs Ob/Ob-PGC-1α−/−.
3.4 PGC-1α/β affect on mitochondrial gene expression and oxygen consumption is cardiomyocyte-specific
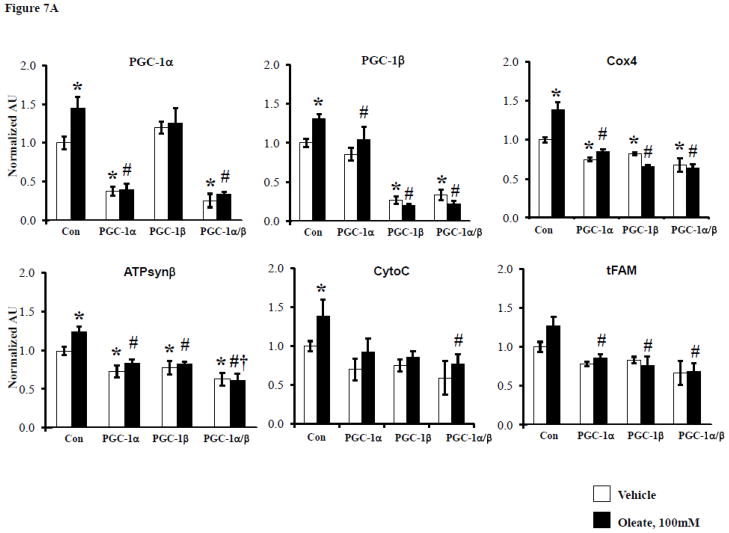
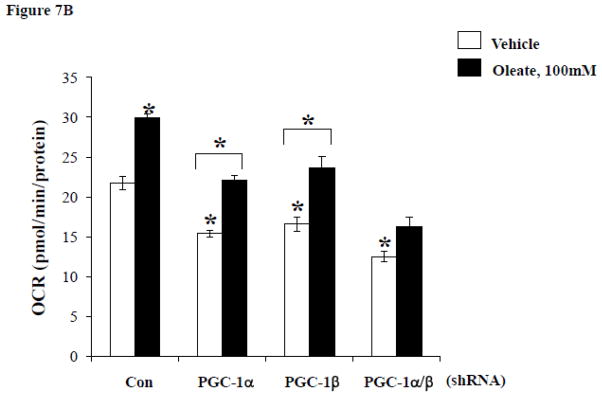
In order to evaluate the role of FFA delivery in the cardiac mitochondrial response and to assess the impact of greater degrees of loss of PGC-1α and β in myocytes, we employed a cell-based system. To this end, the impact of FFA delivery on the expression of PGC-1 coactivators and targets involved in mitochondrial respiratory function was assessed in H9C2 myotubes. Exposure of the cells to 100 μM oleate for 24 hours significantly increased mRNA expression levels of PGC-1α and β as well as targets involved in respiratory chain and OXPHOS including genes encoding Cyto C, Cox 4, and ATPsynβ (Figure 7A). ShRNA-mediated knockdown (KD) of PGC-1α or β or both demonstrated that the effect of oleate on the induction of expression of OXPHOS target genes was abolished by KD of either PGC-1 isoform. Oleate also increased oxygen consumption rates (OCR) in control cells, but basal OCR was diminished in the context of PGC-1 KD (Figure 6). However, in contrast to the gene expression results, oleate still induced OCR in the context of single isoform PGC-1 KD (albeit blunted and at lower absolute levels), but oleate induction of OCR was abolished with shRNA directed against both PGC-1 isoforms (Figure 7B). Thus, at least one PGC-1 isoform is needed to mediate the oleate-induced increase in OCR. Taken together, these results are consistent with the observations of the adaptive mitochondrial biogenic response in the insulin resistant heart in vivo and suggest that FFAs play an important role in triggering this effect in a cell autonomous manner.
Figure 7. PGC-1α and β deficiency alter cardiomyocyte gene expression and oxygen consumption in a cell autonomous manner.
A) Quantitative real-time rtPCR analysis of transcripts (as described in Figure 1) from H9C2 cells treated with either vehicle or 100μM oleate after transfection with either control shRNA (Con) or shRNA targeting PGC-1α, PGC-1β or both. * p < 0.05 vs Con-vehicle, # p < 0.05 vs Con-oleate, † p < 0.05 vs PGC-1α or β-oleate. B) Mean (±SE) oxygen consumption in H9C2 cells treated in the same manner as in A. * p < 0.05 vs Con-vehicle or for comparison noted by lines.
4. DISCUSSION
Increasing evidence indicates that derangements in lipid metabolism and mitochondrial dysfunction contribute to diabetic cardiomyopathy [9, 11, 12, 16, 19]. However, several groups have demonstrated evidence of cardiac mitochondrial proliferation in insulin resistant and diabetic animal models suggesting that an adaptive metabolic response is triggered early in this process [9, 17]. The results of our earlier work suggested that the transcriptional co-activator, PGC-1α is likely involved in the mitochondrial biogenic response in insulin resistance [9]. In this study, we sought to assess the specific role of PGC-1α in the mitochondrial biogenic response of the insulin resistant and diabetic heart and to determine if this response was adaptive in the context of increased lipid delivery and uptake. Herein, we demonstrate that PGC-1α is necessary for the mitochondrial biogenic response early in the setting of glucose intolerance, and that a second PGC-1 isoform, PGC-1β, cooperates in this response. Our results also indicate that FFA likely serve as an important stimulus for the adaptive mitochondrial response in cardiomyocytes.
We found that hearts of animals with glucose intolerance induced by a HF diet or Ob/Ob background, exhibit a mitochondrial biogenic response consisting of increased mitochondrial volume density, mtDNA content, and expression of genes involved in mitochondrial energy transduction. These data are consistent with our previous findings in early insulin resistant UCP-DTA mice [9] and the results of studies by others in independent diabetic animal models [11, 13, 19]. However, animals deficient for PGC-1 α, did not mount this mitochondrial biogenic response. Furthermore, using Ob/Ob mice, we were able to demonstrate that this mitochondrial response becomes blunted over time, as glucose tolerance worsens and full-blown diabetes sets in. Notably, a downward trend in PGC-1α expression has been demonstrated previously in both Ob/Ob and db/db animals [12]. Deficiency of PGC-1α in Ob/Ob hearts was associated with lower levels of the other target genes (ATPsyn, tFAM) at 6 weeks of age, and the loss of PGC-1α induction in the 8 week-old Ob/Ob hearts was associated with a relative loss in expression of other target genes. Interestingly, despite the loss of PGC-1α induction, the Ob/Ob hearts still demonstrated increased mitochondrial volume density, suggesting that changes in mitochondrial size are initiated early on and that reversal of the process is not entirely dependent on PGC-1α PGC-1β gene expression is also not increased at this time point, suggesting that other regulatory factors may be involved.
The specific signals that result in loss of the adaptive increase in PGC-1α are unclear but may be related to secondary effects of elevated circulating levels of glucose, changes in insulin signaling, excess FA uptake, prolonged exposure to increased FA, or a chronic inflammatory state. We did also note an increase in PPARα expression at 6 weeks that was no longer present at 8 weeks of age. Interestingly, we have found in skeletal muscle cells in culture that PPARα is capable of activating the PGC-1α promoter (unpublished data), suggesting a regulatory loop that may contribute to PGC-1α downregulation. Additionally, there is data linking diabetes with epigenetic modifications (e.g. post-translational histone modifications) that result in altered gene expression [28]. Such epigenetic changes may be a result of hyperglycemia, oxidative stress, or potentially other changes in the physiologic milieu [28]. Recently, evidence has indicated that PGC-1α activity can be altered by post-translational mechanisms, including phosphorylation, acetylation, and methylation [29–31]. One particularly interesting regulator of PGC-1α is SIRT1, which is known to be altered by nutritional status.[32] SIRT1 deacetylates PGC-1α, resulting in increased PGC-1α activity [29, 31, 33]. Interestingly, altered SIRT1 expression has also been shown with impaired insulin signaling [34, 35]. Indeed, we have evaluated SIRT1 expression in 6 week and 8 week-old WT and Ob/Ob animals and have found that SIRT1 expression is reduced in the older animals with more severe glucose intolerance (data not shown). It is also possible that the development of a chronic inflammatory state deactivates PGC-1 signaling. In support of this notion we have recently shown that LPS-mediated activation of the cardiac myocyte innate immune response reduces the expression of PGC-1α and PGC-1β [25]. Interestingly, Schilling et al. found that toll-like receptor 4 (TLR4) and NF-κB were necessary for LPS-mediated suppression of PGC-1.[25] Intriguingly, previous investigators have linked saturated fatty acids with activation of the IKK/NF-κB pathway, resulting in activation of an inflammatory cascade in a TLR4-dependent manner.[36] Together these data suggest that saturated fatty acids, like those circulating in the insulin resistant state, may contribute to a chronic inflammatory state that could impact mitochondrial biogenesis and function.
Previous investigators have documented an increase in myocardial oxygen consumption in insulin resistant animals associated with increased FA uptake and utilization [27]. Our mitochondrial respiration studies demonstrated that 6 week-old Ob/Ob muscle strips exhibit increased rates of oxygen consumption and that deficiency of PGC-1α prevents augmentation of respiration at this age. However, by 8 weeks of age, when PGC-1α is no longer upregulated in Ob/Ob hearts, there is no longer an increase in mitochondrial oxygen consumption,. We did note a trend towards increased oxidative stress, and one could speculate that this could have a detrimental effect on mitochondrial function, resulting in the decline in respiratory capacity. In the 8 week Ob/Ob-PGC-1α−/− animals, we were surprised to find that deficiency of PGC-1α did not further worsen mitochondrial respiratory capacity. Similarly, echocardiograms done at 8 weeks of age did not demonstrate a significant difference between Ob/Ob and Ob/Ob-PGC-1α−/− animals. We speculated that this may be due, in part, to compensation by the other PGC-1 isoform, PGC-1β; the role of PGC-1β in diabetic hearts has not been studied. However, one must note that the ECHO changes observed in the Ob/Ob and Ob/Ob-PGC-1α−/− animals were mild. It is possible that in the long-term, more significant functional changes could occur. However we also cannot exclude the possibility that the mitochondrial biogenesis response is a maladaptive response. Previous data from our lab has indicated that excessive mitochondrial proliferation results in cardiomyopathy.[26] In out current study, blunting mitochondrial biogenesis by knocking out PGC-1α neither improved nor worsened cardiac function. We did, however, note a decline in mitochondrial function, suggesting that the biogenic response is important for augmenting energy metabolism.
Our data indicate that PGC-1β is also responsive to the insulin resistant state, particularly when PGC-1α is absent. It appears, however, not to compensate for the downregulation in PGC-1α that occurs with worsening diabetes in Ob/Ob animals. It is possible that PGC-1β is only upregulated when PGC-1α is completely absent and that this compensatory response occurs over time but can be accelerated by the insulin resistant state. Our data also demonstrate that combined deficiency of both PGC-1 isoforms resulted in a dramatic decrease in mitochondrial oxygen consumption, indicating that the two isoforms cooperate to maintain mitochondrial respiratory capacity in insulin resistant hearts. Although echocardiography did not reveal a significant decline in function in the Ob/Ob-PGCα−/−β+/− mice, it is possible that this reflects a lack of sensitivity of ECHO to detect differences in diastolic function at this age in mice. However, it is also possible that the single PGC-1β allele is still playing a role in maintaining cardiac function. The impact of the significant decline in respiratory function in the face of ongoing excess FA uptake is unclear and will be an important area for future studies.
Finally, we were particularly interested in whether FA was driving this mitochondrial response in the cardiomyocyte given that the delivery of lipids to the heart is often increased in the insulin resistant state. Our cell culture data indicate that FFA are capable of inducing PGC-1α and other mitochondrial target gene expression changes in a cell autonomous manner. Interestingly, in cells in culture, loss of either PGC-1 isoform abolishes the impact of FFA on inducing gene expression. Although this is not fully consistent with our in vivo data, it is likely related to the fact that cells in culture are a simplified system, lacking other potentially important signaling molecules that may contribute to a compensatory response in vivo. Importantly, FFAs induced OCR and for this readout we observed a further diminution with combined knockdown of both PGC-1 isoforms, confirming that the two coactivators cooperate together to maintain these higher levels of oxygen consumption when FFA is present. The observation that FAs induce an upregulation of PGC-1α and oxygen consumption may relate to recent HF diet studies. It has been reported that increases in FFA concentration associated with a HF diet may maintain mitochondrial oxidative capacity in the murine failing heart [37].
In summary, we demonstrate that PGC-1α is necessary for the early mitochondrial biogenic response of insulin resistant hearts. Furthermore, PGC-1β also plays a role in maintaining mitochondrial function in the setting of worsening glucose intolerance. However, over time this response declines in association with a decline in PGC-1α expression. The basis for the loss of the PGC-1α response is unknown but could be related to a variety of mechanisms including altered insulin signaling, oxidative stress, inflammation, or hyperglycemia, all of which might be a result of prolonged FA exposure. Future studies aimed at delineating the mechanisms involved in the downregulation of PGC-1α in the diabetic heart could unveil new therapeutic targets aimed at diabetic cardiac dysfunction.
Supplementary Material
Table 2.
Diastolic Echocardiogram parameters
| WT | PGC-1α−/− | Ob/Ob | Ob/Ob-PGC1α−/− | |
|---|---|---|---|---|
| HR (slow) | 426 ± 12 | 418 ± 7 | 421 ± 7 | 407 ± 6 |
| E | 0.809 ± 0.02 | 0.761 ± 0.03 | 0.959 ± 0.05*† | 0.921 ± 0.03*† |
| A | 0.745 ± 0.02 | 0.745 ± 0.03 | 0.919 ± 0.04*† | 0.894 ± 0.03*† |
| E/A | 1.09 ± 0.04 | 1.02 ± 0.01 | 1.04 ± 0.01 | 1.03 ± 0.01 |
| E′ | 0.050 ± 0.002 | 0.049 ± 0.002 | 0.046 ± 0.002 | 0.048 ± 0.001 |
| S′ | 0.045 ± 0.002 | 0.044 ± 0.001 | 0.041 ± 0.002 | 0.040 ± 0.001 |
| E/E′ | 16.4 ± 0.6 | 15.5 ± 0.6 | 21.1 ± 1.0*† | 19.2 ± 0.4*† |
| IVCT | 9.0 ± 0.3 | 9.4 ± 0.5 | 7.9 ± 0.1*† | 8.6 ± 0.3*† |
| ET | 36.1 ± 0.8 | 34.2 ± 1.3 | 38.8 ± 1.7 | 35.8 ± 1.4 |
| IVRT | 13.5 ± 0.4 | 12.5 ± 0.4 | 12.3 ± 0.5 | 13.4 ± 0.4 |
HR (slow) = heart rate after Zatabradine, E = Peak trans-mitral E velocity (mm/sec), A = Peak trans-mitral A velocity (mm/sec), S′ = peak systolic mitral annular velocity (mm/sec), E′ = peak early diastolic mitral annular velocity (mm/sec), A′ = peak late (atrial) mitral annular velocity (mm/sec), IVCT = isovolumic contraction time (msec), ET = ejection time (msec), IVRT = isovolumic relaxation time (msec). p < 0.05 vs WT,
p < 0.05 vs PGC-1α−/−,
p < 0.05 vs Ob/Ob.
Highlights.
PGC-1α is necessary for the mitochondrial biogenic response in the early insulin resistant heart
PGC-1β is responsive to insulin resistance and has an overlapping role with PGC-1α
Deficiency of both PGC-1 isoforms impairs mitochondrial function
Acknowledgments
The authors thank Bill Kraft for expert technical assistance with electron microcopy, and Teresa Leone and Brian Finck for critical review of the manuscript. JGD is supported by NHLBI K08 award (HL084093) and was previously a Scholar of the Child Health Research Center of Excellence in Developmental Biology at WUSM (HD001487) and the Pediaiatric Critical Care Scientist Development Program (HD047349). This work was also supported by the NORC (P30 DK56341) and NIH grant P50 HL077113 (DPK).
Abbreviations
- PPAR
peroxisome proliferator-activated receptor
- ERR
estrogen related receptor
- PGC-1
PPAR gamma coactivator-1
- FAO
fatty acid oxidation
- FA
fatty acid
- WT
wild-type
- HF
high fat
- NORC
Nutrition Oriented Research Center
- WUSM
Washington University School of Medicine
- AUC
area under the curve
- TAG
triacylglyceride
- GTT
glucose tolerance test
- EM
electron microscopy
- LV
left ventricle
- OXPHOS
oxidative phosphorylation
- PC
palmitoyl-L-carnitine
- ECHO
echocardiogram
- IVCT
interventricular contraction time
- KD
knockdown
- OCR
oxygen consumption rate
Footnotes
DISCLOSURES
Dr. Kelly is on the Scientific Advisory Boards of Eli Lilly and Johnson & Johnson.
Publisher's Disclaimer: This is a PDF file of an unedited manuscript that has been accepted for publication. As a service to our customers we are providing this early version of the manuscript. The manuscript will undergo copyediting, typesetting, and review of the resulting proof before it is published in its final citable form. Please note that during the production process errors may be discovered which could affect the content, and all legal disclaimers that apply to the journal pertain.
References
- 1.Rodrigues B, McNeill JH. The diabetic heart: metabolic causes for the development of cardiomyopathy. Cardiovasc Res. 1992;26:913–22. doi: 10.1093/cvr/26.10.913. [DOI] [PubMed] [Google Scholar]
- 2.Stanley WC, Lopaschuk GD, McCormack JG. Regulation of energy substrate metabolism in the diabetic heart. Cardiovasc Res. 1997;34:25–33. doi: 10.1016/s0008-6363(97)00047-3. [DOI] [PubMed] [Google Scholar]
- 3.Huss JM, Kelly DP. Nuclear receptor signaling and cardiac energetics. Circ Res. 2004;95:568–78. doi: 10.1161/01.RES.0000141774.29937.e3. [DOI] [PubMed] [Google Scholar]
- 4.Lai L, Leone TC, Zechner C, Schaeffer PJ, Kelly SM, Flanagan DP, et al. Transcriptional coactivators PGC-1alpha and PGC-lbeta control overlapping programs required for perinatal maturation of the heart. Genes Dev. 2008 Jul 15;22(14):1948–61. doi: 10.1101/gad.1661708. [DOI] [PMC free article] [PubMed] [Google Scholar]
- 5.Lehman JJ, Barger PM, Kovacs A, Saffitz JE, Medeiros D, Kelly DP. PPAR γ coactivator-1 (PGC-1) promotes cardiac mitochondrial biogenesis. J Clin Invest. 2000;106:847–56. doi: 10.1172/JCI10268. [DOI] [PMC free article] [PubMed] [Google Scholar]
- 6.Lin J, Handschin C, Spiegelman BM. Metabolic control through the PGC-1 family of transcription coactivators. Cell Metab. 2005;1:361–70. doi: 10.1016/j.cmet.2005.05.004. [DOI] [PubMed] [Google Scholar]
- 7.Barger PM, Kelly DP. PPAR signaling in the control of cardiac energy metabolism. Trends Cardiovasc Med. 2000;10:238–45. doi: 10.1016/s1050-1738(00)00077-3. [DOI] [PubMed] [Google Scholar]
- 8.Finck BN, Kelly DP. Peroxisome proliferator-activated receptor alpha (PPARalpha) signaling in the gene regulatory control of energy metabolism in the normal and diseased heart. J Mol Cell Cardiol. 2002 Oct;34(10):1249–57. doi: 10.1006/jmcc.2002.2061. [DOI] [PubMed] [Google Scholar]
- 9.Duncan JG, Fong JL, Medeiros DM, Finck BN, Kelly DP. Insulin-resistant heart exhibits a mitochondrial biogenic response driven by the peroxisome proliferator-activated receptor-α/PGC-1α gene regulatory pathway. Circulation. 2007;115:909–17. doi: 10.1161/CIRCULATIONAHA.106.662296. [DOI] [PMC free article] [PubMed] [Google Scholar]
- 10.Finck BN, Lehman JJ, Leone TC, Welch MJ, Bennett MJ, Kovacs A, et al. The cardiac phenotype induced by PPARα overexpression mimics that caused by diabetes mellitus. J Clin Invest. 2002;109:121–30. doi: 10.1172/JCI14080. [DOI] [PMC free article] [PubMed] [Google Scholar]
- 11.Boudina S, Sena S, O’Neill BT, Tathireddy P, Young ME, Abel ED. Reduced mitochondrial oxidative capacity and increased mitochondrial uncoupling impair myocardial energetics in obesity. Circulation. 2005;112:2686–95. doi: 10.1161/CIRCULATIONAHA.105.554360. [DOI] [PubMed] [Google Scholar]
- 12.Buchanan J, Mazumder PK, Hu P, Chakrabarti G, Roberts MW, Jeong Yun U, et al. Reduced cardiac efficiency and altered substrate metabolism precedes the onset of hyperglycemia and contractile dysfunction in two mouse models of insulin resistance and obesity. Endocrinology. 2005;146:5341–9. doi: 10.1210/en.2005-0938. [DOI] [PubMed] [Google Scholar]
- 13.Boudina S, Sena S, Theobald H, Sheng X, Wright JJ, Hu XX, et al. Mitochondrial energetics in the heart in obesity-related diabetes: direct evidence for increased uncoupled respiration and activation of uncoupling proteins. Diabetes. 2007 Oct;56(10):2457–66. doi: 10.2337/db07-0481. [DOI] [PubMed] [Google Scholar]
- 14.Scheuermann-Freestone M, Madsen PL, Manners D, Blamire AM, Buckingham RE, Styles P, et al. Abnormal cardiac and skeletal muscle energy metabolism in patients with type 2 diabetes. Circulation. 2003 Jun 24;107(24):3040–6. doi: 10.1161/01.CIR.0000072789.89096.10. [DOI] [PubMed] [Google Scholar]
- 15.Anderson EJ, Kypson AP, Rodriguez E, Anderson CA, Lehr EJ, Neufer PD. Substrate-specific derangements in mitochondrial metabolism and redox balance in the atrium of the type 2 diabetic human heart. J Am Coll Cardiol. 2009 Nov 10;54(20):1891–8. doi: 10.1016/j.jacc.2009.07.031. [DOI] [PMC free article] [PubMed] [Google Scholar]
- 16.Kuo TH, Moore KH, Giacomelli F, Wiener J. Defective oxidative metabolism of heart mitochondria from genetically diabetic mice. Diabetes. 1983;32:781–7. doi: 10.2337/diab.32.9.781. [DOI] [PubMed] [Google Scholar]
- 17.Boudina S, Abel ED. Mitochondrial uncoupling: a key contributor to reduced cardiac efficiency in diabetes. Physiology. 2006;21:250–8. doi: 10.1152/physiol.00008.2006. [DOI] [PubMed] [Google Scholar]
- 18.Boudina S, Bugger H, Sena S, O’Neill BT, Zaha VG, Ilkun O, et al. Contribution of impaired myocardial insulin signaling to mitochondrial dysfunction and oxidative stress in the heart. Circulation. 2009 Mar 10;119(9):1272–83. doi: 10.1161/CIRCULATIONAHA.108.792101. [DOI] [PMC free article] [PubMed] [Google Scholar]
- 19.Shen X, Zheng S, Thongboonkerd V, Xu M, Pierce WM, Jr, Klein JB, et al. Cardiac mitochondrial damage and biogenesis in a chronic model of type I diabetes. Am J Physiol Endocrinol Metab. 2004;287:E896–E905. doi: 10.1152/ajpendo.00047.2004. [DOI] [PubMed] [Google Scholar]
- 20.Arany Z, He H, Lin J, Hoyer K, Handschin C, Toka O, et al. Transcriptional coactivator PGC-1 alpha controls the energy state and contractile function of cardiac muscle. Cell Metab. 2005 Apr;1(4):259–71. doi: 10.1016/j.cmet.2005.03.002. [DOI] [PubMed] [Google Scholar]
- 21.Finck BN, Kelly DP. PGC-1 coactivators: Inducible regulators of energy metabolism in health and disease. J Clin Invest. 2006;116:615–22. doi: 10.1172/JCI27794. [DOI] [PMC free article] [PubMed] [Google Scholar]
- 22.Leone TC, Lehman JJ, Finck BN, Schaeffer PJ, Wende AR, Boudina S, et al. PGC-1α deficient mice exhibit multi-system energy metabolic derangements: Muscle dysfunction, abnormal weight control, and hepatic steatosis. PLoS Biol. 2005;3:672–87. doi: 10.1371/journal.pbio.0030101. [DOI] [PMC free article] [PubMed] [Google Scholar]
- 23.Zechner C, Lai L, Zechner JF, Geng T, Yan Z, Rumsey JW, et al. Total skeletal muscle PGC-1 deficiency uncouples mitochondrial derangements from fiber type determination and insulin sensitivity. Cell Metab. 2010 Dec 1;12(6):633–42. doi: 10.1016/j.cmet.2010.11.008. [DOI] [PMC free article] [PubMed] [Google Scholar]
- 24.Kelly DP, Gordon JI, Alpers R, Strauss AW. The tissue-specific expression and developmental regulation of the two nuclear genes encoding rat mitochondrial proteins: medium-chain acyl-CoA dehydrogenase and mitochondrial malate dehydrogenase. J Biol Chem. 1989;264:18921–5. [PubMed] [Google Scholar]
- 25.Schilling J, Lai L, Sambandam N, Dey CE, Leone TC, Kelly DP. Toll-like Receptor-mediated Inflammatory Signaling Reprograms Cardiac Energy Metabolism by Repressing Peroxisome Proliferator-activated Receptor {gamma} Coactivator-1 (PGC-1) Signaling. Circ Heart Fail. 2010 May 10; doi: 10.1161/CIRCHEARTFAILURE.110.959833. [DOI] [PMC free article] [PubMed] [Google Scholar]
- 26.Russell LK, Mansfield CM, Lehman JJ, Kovacs A, Courtois M, Saffitz JE, et al. Cardiac-specific induction of the transcriptional coactivator peroxisome proliferator-activated receptor γ coactivator-1α promotes mitochondrial biogenesis and reversible cardiomyopathy in a developmental stage-dependent manner. Circ Res. 2004;94:525–33. doi: 10.1161/01.RES.0000117088.36577.EB. [DOI] [PubMed] [Google Scholar]
- 27.Mazumder PK, O’Neill BT, Roberts MW, Buchanan J, Yun UJ, Cooksey RC, et al. Impaired cardiac efficiency and increased fatty acid oxidation in insulin-resistant ob/ob mouse hearts. Diabetes. 2004 Sep;53(9):2366–74. doi: 10.2337/diabetes.53.9.2366. [DOI] [PubMed] [Google Scholar]
- 28.Cooper ME, El-Osta A. Epigenetics: mechanisms and implications for diabetic complications. Circ Res. 2010 Dec 10;107(12):1403–13. doi: 10.1161/CIRCRESAHA.110.223552. [DOI] [PubMed] [Google Scholar]
- 29.Jeninga EH, Schoonjans K, Auwerx J. Reversible acetylation of PGC-1: connecting energy sensors and effectors to guarantee metabolic flexibility. Oncogene. 2010 Aug 19;29(33):4617–24. doi: 10.1038/onc.2010.206. [DOI] [PMC free article] [PubMed] [Google Scholar]
- 30.Barres R, Osler ME, Yan J, Rune A, Fritz T, Caidahl K, et al. Non-CpG methylation of the PGC-1alpha promoter through DNMT3B controls mitochondrial density. Cell Metab. 2009 Sep;10(3):189–98. doi: 10.1016/j.cmet.2009.07.011. [DOI] [PubMed] [Google Scholar]
- 31.Rodgers JT, Lerin C, Gerhart-Hines Z, Puigserver P. Metabolic adaptations through the PGC-1 alpha and SIRT1 pathways. FEBS Lett. 2008 Jan 9;582(1):46–53. doi: 10.1016/j.febslet.2007.11.034. [DOI] [PMC free article] [PubMed] [Google Scholar]
- 32.Dominy JE, Jr, Lee Y, Gerhart-Hines Z, Puigserver P. Nutrient-dependent regulation of PGC-1alpha’s acetylation state and metabolic function through the enzymatic activities of Sirt1/GCN5. Biochim Biophys Acta. 2010 Aug;1804(8):1676–83. doi: 10.1016/j.bbapap.2009.11.023. [DOI] [PMC free article] [PubMed] [Google Scholar]
- 33.Rodgers JT, Lerin C, Haas W, Gygi SP, Spiegelman BM, Puigserver P. Nutrient control of glucose homeostasis through a complex of PGC-1alpha and SIRT1. Nature. 2005 Mar 3;434(7029):113–8. doi: 10.1038/nature03354. [DOI] [PubMed] [Google Scholar]
- 34.Rutanen J, Yaluri N, Modi S, Pihlajamaki J, Vanttinen M, Itkonen P, et al. SIRT1 mRNA expression may be associated with energy expenditure and insulin sensitivity. Diabetes. 2010 Apr;59(4):829–35. doi: 10.2337/db09-1191. [DOI] [PMC free article] [PubMed] [Google Scholar]
- 35.Barazzoni R, Zanetti M, Sturnega M, Stebel M, Semolic A, Pirulli A, et al. Insulin downregulates SIRT1 and AMPK activation and is associated with changes in liver fat, but not in inflammation and mitochondrial oxidative capacity, in streptozotocin-diabetic rat. Clin Nutr. 2010 Jun;30(3):384–90. doi: 10.1016/j.clnu.2010.11.001. [DOI] [PubMed] [Google Scholar]
- 36.Shi H, Kokoeva MV, Inouye K, Tzameli I, Yin H, Flier JS. TLR4 links innate immunity and fatty acid- induced insulin resistance. J Clin Invest. 2006 Nov;116(11):3015–25. doi: 10.1172/JCI28898. [DOI] [PMC free article] [PubMed] [Google Scholar]
- 37.Chess DJ, Khairallah RJ, O’Shea KM, Xu W, Stanley WC. A high-fat diet increases adiposity but maintains mitochondrial oxidative enzymes without affecting development of heart failure with pressure overload. Am J Physiol Heart Circ Physiol. 2009 Nov;297(5):H1585–93. doi: 10.1152/ajpheart.00599.2009. [DOI] [PMC free article] [PubMed] [Google Scholar]
Associated Data
This section collects any data citations, data availability statements, or supplementary materials included in this article.


