Abstract
Abnormal bone turnover is common in CKD, but its effects on bone quality remain unclear. We qualitatively screened iliac crest bone specimens from patients on dialysis to identify those patients with low (n=18) or high (n=17) bone turnover. In addition, we obtained control bone specimens from 12 healthy volunteers with normal kidney function. In the patient and control specimens, Fourier transform infrared spectroscopy and nanoindentation quantified the material and mechanical properties of the specimens, and we used bone histomorphometry to assess parameters of bone microstructure and bone formation and resorption. Compared with high or normal turnover, bone with low turnover had microstructural abnormalities such as lower cancellous bone volume and reduced trabecular thickness. Compared with normal or low turnover, bone with high turnover had material and nanomechanical abnormalities such as reduced mineral to matrix ratio and lower stiffness. These data suggest that turnover-related alterations in bone quality may contribute to the diminished mechanical competence of bone in CKD, albeit through different mechanisms. Therapies tailored specifically to low- or high-turnover bone may treat renal osteodystrophy more effectively.
Bone turnover abnormalities are well known in patients with chronic kidney disease (CKD).1 These abnormalities encompass a spectrum from severely suppressed to markedly elevated bone turnover. Abnormal bone turnover occurs in approximately 85% of patients with CKD stage 5 on dialysis (CKD-5D),2 and within this patient group, there is a greater risk of bone fracture than within the general population.3–5 Although turnover abnormalities are well described,1 little information is available on whether these abnormalities are associated with changes in bone quality. Bone quality is the contemporary term used to refer to the structural and material parameters that collectively enable bone to bear load and resist fracture or excessive deformation.6,7 The potential link between bone turnover and bone quality is an important question meriting study because of the relatively high incidence of fractures reported to occur with abnormal turnover.8–14 Thus, the specific aim of this study was to advance the understanding of this potential link by quantifying how the microstructural parameters, material composition, and nanomechanical properties vary in bone with low- or high-turnover renal osteodystrophy (ROD) compared with bone with normal turnover from normal volunteers.
Results
Among 163 iliac crest bone biopsies sequentially screened from patients with CKD-5D on dialysis, 35 patients met the stringent selection criteria (Concise Methods) and were included in the study; 17 of these 35 age-matched patients had high bone turnover (age: mean ± SD = 58.1 ± 8.1 years), and 18 patients had low bone turnover (age: mean ± SD = 56.6 ± 8.0 years). There was no significant difference in dialysis vintage between patients with low bone turnover (mean ± SD = 48.1 ± 35.4 months) and patients with high bone turnover (mean ± SD = 74.2 ± 71.0 months). Five of eighteen low-turnover patients and one of seventeen high-turnover patients had a history of bone pain. One clinically symptomatic fracture was documented in a patient with low bone turnover. Bone turnover in the 12 volunteers with normal kidney function (age: mean ± SD = 53.8 ± 4.7 years) was not significantly different from published data in normal individuals.1,15
There were no significant differences in serum calcium, serum phosphorus, or calcidiol concentrations between patients with low or high bone turnover (Table 1). Serum phosphorus levels were significantly elevated in both low- and high-bone turnover groups compared with the normal bone turnover group (P<0.01). Serum parathyroid hormone (PTH) levels were approximately two times the upper normal range in patients with low bone turnover and approximately nine times the upper normal range in patients with high bone turnover (Table 1). There were no upward or downward trends in serum PTH during the 6 months preceding the biopsy. Use of calcium-based phosphate binders was not different between patients who had bone with low or high turnover.
Table 1.
Serum biochemical data from patients with high, normal, or low bone turnover
| Bone Turnover | Calcium (mg/dl) | Phosphorus (mg/dl) | Calcidiol (ng/ml) | Total PTH (pg/ml) |
|---|---|---|---|---|
| High (n=17) | 9.58 ± 1.05 | 6.01 ± 2.22* | 39.0 ± 20.9 | 596 ± 469*† |
| Normal (n=12) | 9.23 ± 0.33 | 3.53 ± 0.52 | 42.5 ± 9.78 | 30.8 ± 10.2 |
| Low (n=18) | 9.64 ± 1.09 | 6.31 ± 1.80* | 43.8 ± 21.5 | 126 ± 168 |
| Normal range | 9.00–10.5 | 3.40–4.50 | 30–80 | 15–65 |
Mean ± SD.
P<0.01 versus normal.
P<0.01 versus low.
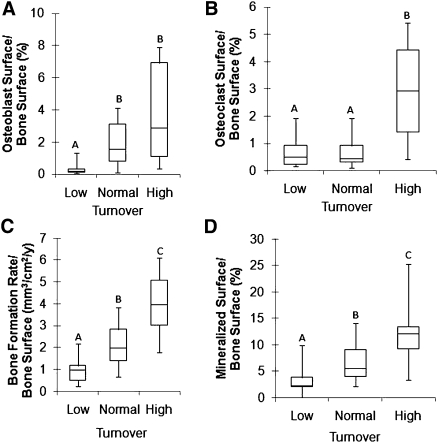
As expected, there were significant differences in histomorphometric cellular parameters of bone formation and resorption among patients with high, normal, and low turnover (P<0.05) (Figure 1).
Figure 1.
Histomorphometric parameters of bone turnover. (A–D) Box plots of static and dynamic parameters of bone with low, normal, and high turnover. Values with the same letters are not significantly different. The bottom and top of the box represent the lower (25%) and upper (75%) quartiles, respectively, and the middle line denotes the median (50%). The upper and lower bounds of the error bars denote the range.
Microstructural Parameters at Various Levels of Bone Turnover
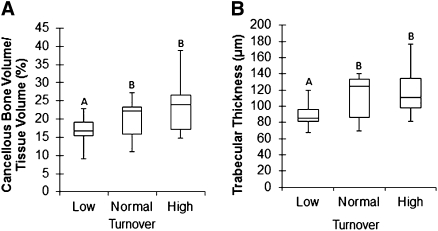
No differences in microstructural parameters were observed between bone with high turnover and bone with normal turnover. In contrast, bone with low turnover had altered microstructural properties compared with bone with normal or high turnover (Figure 2). Specifically, cancellous bone volume in bone with low turnover was 16.9% (P<0.05) and 34.7% (P<0.01) less than in bone with normal and high turnover, respectively (Figure 2A). Trabecular thickness in bone with low turnover was 20.3% (P<0.05) and 33.1% (P<0.01) less than in bone with normal and high turnover, respectively (Figure 2B).
Figure 2.
Microstructural parameters of bone are lower in patients with low than in patients with normal or high turnover. (A and B) Box plots of microstructural parameters of bone with low, normal, and high turnover. Values with the same letters are not significantly different. The bottom and top of the box represent the lower (25%) and upper (75%) quartiles, respectively, and the middle line denotes the median (50%). The upper and lower bounds of the error bars denote the range.
Material Composition at Various Levels of Bone Turnover
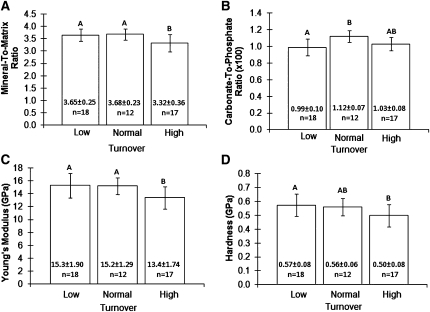
Less relative mineral was observed in bone with high turnover compared with bone with normal or low turnover (Figure 3A). Specifically, the mineral to matrix ratio of bone with high turnover was 9.7% less compared with bone with normal turnover and 9.1% less compared with bone with low turnover (both P<0.01).
Figure 3.
Material and mechanical properties of bone according to bone turnover. (A–D) Mean (±SD) values of the mineral to matrix ratio, carbonate to phosphate ratio, Young’s Modulus, and hardness are shown graphically and numerically versus bone turnover. Values with the same letter are not significantly different.
The carbonate to phosphate ratio was 13.1% lower (P<0.01) in bone with low turnover compared with bone with normal turnover (Figure 3B). No significant differences were detected among the three turnover groups in crystallinity (inversely proportional to mineral crystal size) or collagen crosslinking (directly proportional to collagen maturation) (Table 2).
Table 2.
Crystallinity and collagen crosslinking from bone with high, normal, or low turnover
| Bone Turnover | Crystallinity | Collagen Crosslinking |
|---|---|---|
| High (n=17) | 0.93 ± 0.07 | 3.51 ± 0.75 |
| Normal (n=12) | 0.89 ± 0.04 | 3.53 ± 0.27 |
| Low (n=18) | 0.89 ± 0.04 | 3.62 ± 0.47 |
Mean ± SD.
Bone Turnover and Nanomechanical Properties
Young’s Modulus (shape-independent material stiffness) was 11.9% (P<0.05) and 12.4% (P<0.01) less in bone with high turnover compared with bone with normal or low turnover, respectively (Figure 3C). Hardness (the ability to resist permanent shape change when a force is applied) of bone with high turnover was 13.1% less (P<0.05) compared with bone with low turnover (Figure 3D). No significant difference in hardness was observed between bone with high turnover and bone with normal turnover.
Correlation between Bone Turnover and Material and Nanomechanical Properties
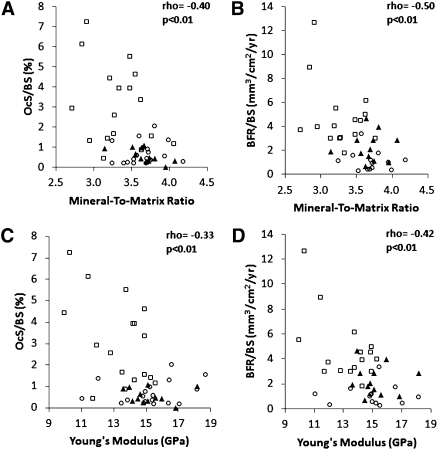
Correlations were found between bone turnover parameters (when considered as continuum) and mineral to matrix ratio as well as Young’s modulus. Specifically, osteoclast surface per bone surface and bone formation rate per bone surface correlated with mineral to matrix ratio and Young’s modulus (ρ = −0.33 to −0.50, P<0.01) (Figure 4).
Figure 4.
Relationship between material and mechanical properties and histomorphometric parameters of bone resorption and formation. (A) Mineral to matrix ratio versus osteoclast surface/bone surface (OcS/BS), (B) mineral to matrix ratio versus bone formation rate/bone surface (BFR/BS), (C) Young’s modulus versus OcS/BS, and (D) Young’s modulus versus BFR/BS. ○, Low turnover; ▲, normal turnover; □, high turnover.
Discussion
The key finding of this study is that bone quality varies, albeit by different mechanisms, with different levels of bone turnover. Departures from normal bone quality were manifested in bone with low turnover by changes in microstructural parameters; in contrast, departures from normal bone quality were manifested in bone with high turnover by changes in material composition and nanomechanical properties.
Our data regarding high turnover are consistent with the findings of Ng et al.,16 who reported that bone from patients with high-turnover ROD had lower mineralization and lower trabecular microhardness compared with bone from patients with low-turnover ROD.16 The work by Ng et al.,16 however, found no turnover-related differences in the microstructural parameters of bone. Bone samples for the retrospective study by Ng et al.16 were obtained between 1987 and 1989, a time period when aluminum and magnesium phosphate binders were commonly used. None of the patients in the present study were on aluminum- or magnesium-containing phosphate binders.
Isaksson et al.17 studied static histomorphometric parameters and material properties in normal subjects and patients with high-turnover ROD. Relative mineralization, measured by the mineral to matrix ratio in the center of trabecular bone, was less in our study and in the study by Isaksson et al.17 in ROD patients with high turnover compared with normal subjects. This difference did not reach significance in the study by Isaksson et al.17 but was significant in the present study. Isaksson et al.17 detected a significant turnover-related difference in the mineral to matrix ratio when this parameter was measured at the periphery of the trabeculae. This mineralization difference observed at the periphery may be explained by the high osteoid volume at the surface of bone with high turnover. For this reason, we did not measure the mineral to matrix ratio at the edge of the trabeculae.
Also, the study by Isaksson et al.17 and the present study both showed that the carbonate to phosphate ratio was less in the center of trabecular bone with high turnover compared with the center of trabecular bone with normal turnover. This reduction (approximately 10%) reached statistical significance in the study by Isaksson et al.17 but not in our study (approximately 8%). In the present study, however, there was a significant difference in the carbonate to phosphate ratio between bone with low turnover and bone with normal turnover. Clinical relevance of the carbonate to phosphate ratio awaits additional study.18
Turnover-related differences in bone material properties between the present study and the study by Isaksson et al.18 may be attributable to differences in patient characteristics including age, gender, treatment, and underlying kidney disease.
The observed reduction in mineral to matrix ratio and Young’s modulus in bone with high turnover may be explained by the shorter duration between remodeling cycles. Specifically, the diminished remodeling duration may prevent full mineralization and thus, cause reduced bone stiffness.19 This explanation is supported by the negative relationship between bone turnover parameters and the mineral to matrix ratio or Young’s modulus (Figure 4). It is consistent with the known increase in osteoid volume accompanying high turnover and should be not be interpreted as evidence of osteomalacia.1 Studies of pediatric ROD find a greater prevalence of abnormal mineralization than in the adult skeleton.20,21 This discrepancy could be explained by the higher remodeling of bone in the growing skeleton in addition to increases in bone turnover because of secondary hyperparathyroidism. The present findings are also consistent with prior studies showing that a reduction in relative mineralization, a decreased mineral to matrix ratio, is associated with reduced stiffness in human22 and animal bone.23,24 Reduced mineralization in bone with high turnover is clinically relevant, because other evidence shows that small decreases in mineral content are associated with disproportionately greater reductions in fracture toughness.19
The absence of changes in the mineral to matrix ratio of bone with low turnover suggests that mineral supersaturation may not accompany reduced remodeling activity. The accompanying lack of change in nanomechanical properties is expected, but the macromechanical properties of bone may be reduced because of the observed microstructural abnormalities.
The observed abnormal microstructural parameters (thinner trabeculae and less cancellous bone volume) in patients with low turnover are clinically relevant, because reducing support element size in any structure with unchanged material properties diminishes its mechanical competence.
Bone quality abnormalities accompanying different turnover states were studied by using the current gold standard sampling technique, which is bone biopsy. Of course, for routine clinical diagnostic purposes, a noninvasive approach is preferable. A recent study by Bhagat et al.25 used noninvasive magnetic resonance imaging and finite element modeling of the distal tibial metaphysis to predict bone strength.25 This promising approach awaits additional study.
This study was designed to detect differences in bone’s microstructural and material properties but was not powered to assess overall fracture risk. The documented prevalence of bone pain and fractures in this study is in keeping with published studies in patients with ROD.4 To prevent data confounding, this study was limited to Caucasian women with CKD-5D (40–70 years of age) with predefined selection criteria. Additional studies are needed to address the potential effects of gender, race, age, diabetes, and medications (including vitamin D) on bone quality.
Our data are clinically important, because they extend the studied spectrum of bone abnormalities in ROD to include bone with low turnover and measurement of bone’s nanomechanical properties. This extension is clinically relevant, because bone strength and musculoskeletal competence are influenced by its microstructural parameters, material composition, and mechanical properties.6,7 The information contributed by the present study provides substantial evidence linking bone quality and bone turnover in ROD.
In conclusion, abnormal bone turnover in ROD is associated with specific changes in bone quality as manifested on the microstructural, material, or mechanical levels. These abnormalities are dependent on the level of turnover. Specifically, bone with low turnover is associated with microstructural abnormalities, whereas bone with high turnover is associated with material and mechanical property abnormalities. Reduced bone quality of patients with either low- or high-turnover ROD may contribute to the known decreased mechanical competence in these patients8–14 but for two different turnover-dependent reasons. These findings call for additional studies to evaluate modified treatment regimens for ROD by using tailored therapies for patients with low- or high-turnover bone.
Concise Methods
Subjects: Inclusion Criteria
Anterior iliac crest, double tetracycline-labeled bone biopsies received sequentially in the Bone Diagnostic and Research Laboratory at the University of Kentucky were screened to identify potential candidates for enrollment in this study. Inclusion criteria were signed informed consent from female Caucasian patients aged 40–70 years with CKD-5D on chronic maintenance dialysis and low or high bone turnover (see Qualitative and Quantitative Assessment of Bone). An additional 12 bone samples were obtained from healthy, consenting Caucasian female volunteers of the same age range. These subjects had normal kidney function and agreed to undergo baseline bone biopsy after double tetracycline labeling for an unrelated prospective research study. They had normal bone turnover. The study was conducted in adherence with the Declaration of Helsinki.
Subjects: Exclusion Criteria
Men and patients of non-Caucasian races were excluded to focus on the patient group with the highest fracture risk.26,27 Patients were also excluded if they had parathyroidectomy, osteomalacia, chronic alcoholism or drug addiction, kidney transplant(s), stainable aluminum in bone, past or present systemic illnesses, organ diseases, diabetes, or used medications within the past 6 months before biopsy that are known to alter bone metabolism, such as calcitriol, vitamin D analogs, and calcimimetics.
Biochemical Methods
Blood chemistry measurements for calcium and phosphorus were performed by using standard automated techniques. Total intact PTH level was measured by a radioimmunometric assay (Scantibodies Inc., Santee, CA): normal range was 15–65 pg/ml, and intra- and interassay coefficients of variation were <5% and <7%, respectively. Calcidiol (25-OH vitamin D) was measured by liquid chromatography tandem mass spectrometry: normal range was 30–80 ng/ml, and intra- and interassay coefficients of variation were <13% and <14%, respectively. Blood samples for biochemical measurements were obtained immediately before biopsy.
Mineralized Bone Histology
The double tetracycline labeling schedule consisted of a 2-day oral administration of tetracycline hydrochloride (500 mg two times per day) followed by a tetracycline-free interval of 10 days and a subsequent oral administration of demeclocycline hydrochloride (300 mg two times per day) for 4 days. Bone biopsies were performed by using a one-step electrical drill technique (Straumann Medical, Waldenburg, Switzerland) as previously described.28 Iliac crest bone samples were fixed with ethanol at room temperature, dehydrated, and embedded in methylmethacrylate.1 Serial sections of 4-μm thickness were cut with a Microm microtome (model HM360; C. Zeiss, Thornwood, NY). Sections were stained with modified Masson–Goldner trichrome stain,29 aurin tricarboxylic acid stain,30 and solochrome azurine.31 Unstained sections were prepared for fluorescent and polarized light microscopy.
Qualitative and Quantitative Assessment of Bone
Bone turnover was initially assessed qualitatively by examining bone slides under bright field, polarized, and fluorescent light microscopy. For inclusion in the low- or high-turnover group, the actively mineralizing bone surface and cellularity (hypo- versus hyper-) of bone cells had to be clearly different from normal. After enrollment in the study, histomorphometry was done at standardized sites in cancellous bone to obtain quantitative static and dynamic parameters of bone structure, formation, and resorption. This process was done using the semiautomatic method (Osteoplan II; Kontron, Munich, Germany).32,33 All measured parameters comply with the nomenclature of the Histomorphometry Committee of the American Society of Bone and Mineral Research.34
Spectroscopic Assessment of Bone Material
Cancellous bone mineral and matrix properties were quantified by using Fourier transform infrared spectroscopy (FTIR).35–40 Briefly, a 4-µm-thick section was cut from each embedded bone sample and placed between two barium fluoride discs. Infrared spectra were collected from these sandwiched bone specimens using a microscope attached to a Nexus 670 FTIR spectrometer (Thermo Electron, Waltham, MA) operating in transmission mode for 200 scans at a 4-cm−1 resolution. Three randomly selected locations within the center of three randomly selected trabeculae were spectroscopically examined. A total of nine infrared spectral scans were obtained from each bone biopsy. All scans were directed at the center of each trabeculum to avoid the mineralization heterogeneity known to exist between the center of the trabeculum and the edge (i.e., between mature bone and recently formed bone).41 The region subjected to FTIR analysis at each location was 40 × 40 µm. Background scans were performed to correct the resulting spectra from influences because of the environment, barium fluoride discs, and methylmethacrylate mount.
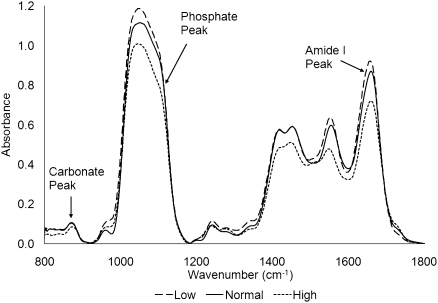
Bone mineralization (i.e., relative mineral quantity) was calculated using the mineral to matrix ratio, a measure of the amount of bone mineral relative to the amount of collagen matrix. Greater values of the mineral to matrix ratio indicate a higher amount of bone mineralization. It has been shown that the mineral to matrix ratio correlates with ash weight and thus, is a reliable means of quantifying relative bone mineralization.42 This ratio was calculated by dividing the area under the phosphate (mineral) peak (900–1200 cm−1) by the area under the Amide I (matrix) peak (1590–1720 cm−1) after both peaks were background and baseline shift corrected (Figure 5).39 The purity of bone mineral was quantified using the carbonate to phosphate ratio, a measure of the amount of carbonate substituted (for PO4− or OH− ions) within the mineral crystal structure. A low carbonate to phosphate ratio indicates a high degree of crystal purity. The carbonate to phosphate ratio was calculated by dividing the area under the carbonate peak (850–890 cm−1) by the area under the phosphate peak. Crystallinity, a measurement of crystal size along the largest dimension, was calculated from the ratio of the areas under the peaks located at 1020 and 1030 cm−1.35,37,43 The relative amount of collagen crosslinking, also known as collagen maturation, was obtained by taking the ratio of the amount of mature enzymatic crosslinks (pyridinium) normalized by the amount of immature enzymatic crosslinks (reducible collagen crosslinks). Collagen crosslinking was calculated from the ratio of the areas under the peaks located at 1660 and 1690 cm−1.38 The coefficient of variation of the FTIR measurements was 4.3%.
Figure 5.
Typical FTIR spectra from bone biopsies with low, normal, and high turnover. The spectra were analyzed using the carbonate peak (carbonate substitution into hydroxyapatite) between 850 and 900 cm−1, phosphate peak (mineral) between 900 and 1200 cm−1, and Amide I peak (matrix) between 1590 and 1720 cm−1.
Nanoindentation
Bone Preparation
The surface of each biopsy was polished and made uniplanar by sanding on a metallographic specimen preparation station holding abrasive silicon carbide papers of decreasing grit size (ending in 1200 grit). A final high polish was achieved by using a rotating microcloth wetted with deionized water in which diamond particles (0.3-µm grit size and then 0.05-µm grit size) were suspended. Finally, specimens were placed in an ultrasonic water bath for 10 minutes to remove surface debris.
Nanoindentation Testing Protocol
The hardness and Young’s modulus of cancellous bone were quantified using established nanoindentation techniques.44–47 This process was done by using a Nanoindenter XP (MTS Nano Instruments, Oak Ridge, TN) at Oak Ridge National Laboratories. The indenter was stationed on an antivibration table located within an isolation cabinet to reduce the potential for environmentally generated mechanical interference. A three-sided tip (Berkovich diamond indenter) was used for specimen indentation. The nanoindenter was calibrated by indenting fused silica of known modulus. All indentation sites were chosen based on microscopic visualization to ensure that, like the FTIR measurements, all indentation was done within the mineralized center of each trabeculum. A total of 12 indentations were performed on each biopsy: three indentations within the center of four randomly chosen trabeculae.
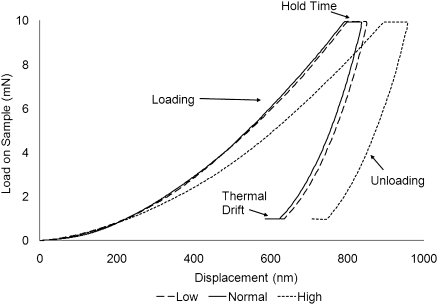
Nanoindentation was performed by applying a peak load of 10 mN during each indentation at a constant strain rate of 0.05 second−1 (Figure 6). The maximum load was maintained for 10 seconds (hold time) to ensure that the subsequent unloading would be completely elastic.44,45 This load produced an indentation depth of approximately 700 nm. Based on the first 50% of the unloading curve, stiffness and hardness were quantified by using the Oliver and Pharr48 method. The coefficient of variation of the nanoindentation measurements was 4.9%.
Figure 6.
Typical load and unload cycle for nanoindentation of bone with low, normal, and high turnover. Nanoindentation was performed by applying a maximum load of 10 mN at which a 10-s hold time was placed to ensure elastic unloading. The specimen was then unloaded to 90% of maximum load and held there for 25 s to correct for thermal drift.
Statistical Analyses
Data were tested for normality using the Kolmogorov–Smirnov test and equality of variances using Levene’s test. Normally distributed data were compared using a one-way ANOVA with the Scheffe post hoc correction. Non-normally distributed data were compared by using the Kruskal–Wallis test; if the resulting P value was <0.05, then a Mann–Whitney test was used to identify which groups were significantly different. Microstructural and histomorphometric parameters were analyzed using nonparametric methods; biochemical, material, and mechanical properties were analyzed using parametric methods. Relationships among the histomorphometric parameters of bone turnover and the material and nanomechanical properties were evaluated by the Spearman test. All computations were done by using SPSS version 17 (SPSS, Inc, Chicago, IL).
Disclosures
None.
Acknowledgments
We thank the Mechanical Properties and Mechanics Group at Oak Ridge National Laboratory for providing access to nanoindentation instrumentation, Dr. Guodong Wang for technical assistance, and Dr. K. Muse for help in recruiting normal volunteers.
This study was supported by National Institute of Health Grant R01 080770 and a grant from the Kentucky Nephrology Research Trust. Additional support was provided by the Division of Nephrology Bone and Mineral Metabolism, the Center for Biomedical Engineering, and the Department of Orthopaedic Surgery at the University of Kentucky.
Footnotes
Published online ahead of print. Publication date available at www.jasn.org.
References
- 1.Malluche H, Faugere M: Atlas of Mineralized Bone Histology, New York, Karger, 1986 [Google Scholar]
- 2.Malluche HH, Mawad H, Monier-Faugere MC: The importance of bone health in end-stage renal disease: Out of the frying pan, into the fire? Nephrol Dial Transplant 19[Suppl 1]: i9–i13, 2004 [DOI] [PubMed] [Google Scholar]
- 3.Alem AM, Sherrard DJ, Gillen DL, Weiss NS, Beresford SA, Heckbert SR, Wong C, Stehman-Breen C: Increased risk of hip fracture among patients with end-stage renal disease. Kidney Int 58: 396–399, 2000 [DOI] [PubMed] [Google Scholar]
- 4.Moe SM, Drüeke TB, Block GA, Cannata-Andía JB, Elder GJ, Fukagawa M, Jorgetti V, Ketteler M, Langman CB, Levin A, MacLeod AM, McCann L, McCullough PA, Ott SM, Wang AY, Weisinger JR, Wheeler DC, Persson R, Earley A, Moorthi R, Uhlig K: KDIGO clinical practice guideline for the diagnosis, evaluation, prevention, and treatment of Chronic Kidney Disease-Mineral and Bone Disorder (CKD-MBD). Kidney Int 76[Suppl 113]: S1–S130, 2009 [DOI] [PubMed] [Google Scholar]
- 5.Nickolas TL, McMahon DJ, Shane E: Relationship between moderate to severe kidney disease and hip fracture in the United States. J Am Soc Nephrol 17: 3223–3232, 2006 [DOI] [PubMed] [Google Scholar]
- 6.Burr DB: Bone quality: Understanding what matters. J Musculoskelet Neuronal Interact 4: 184–186, 2004 [PubMed] [Google Scholar]
- 7.Felsenberg D, Boonen S: The bone quality framework: Determinants of bone strength and their interrelationships, and implications for osteoporosis management. Clin Ther 27: 1–11, 2005 [DOI] [PubMed] [Google Scholar]
- 8.Atsumi K, Kushida K, Yamazaki K, Shimizu S, Ohmura A, Inoue T: Risk factors for vertebral fractures in renal osteodystrophy. Am J Kidney Dis 33: 287–293, 1999 [DOI] [PubMed] [Google Scholar]
- 9.Coco M, Rush H: Increased incidence of hip fractures in dialysis patients with low serum parathyroid hormone. Am J Kidney Dis 36: 1115–1121, 2000 [DOI] [PubMed] [Google Scholar]
- 10.Danese MD, Kim J, Doan QV, Dylan M, Griffiths R, Chertow GM: PTH and the risks for hip, vertebral, and pelvic fractures among patients on dialysis. Am J Kidney Dis 47: 149–156, 2006 [DOI] [PubMed] [Google Scholar]
- 11.Jadoul M, Albert JM, Akiba T, Akizawa T, Arab L, Bragg-Gresham JL, Mason N, Prutz KG, Young EW, Pisoni RL: Incidence and risk factors for hip or other bone fractures among hemodialysis patients in the Dialysis Outcomes and Practice Patterns Study. Kidney Int 70: 1358–1366, 2006 [DOI] [PubMed] [Google Scholar]
- 12.Piraino B, Chen T, Cooperstein L, Segre G, Puschett J: Fractures and vertebral bone mineral density in patients with renal osteodystrophy. Clin Nephrol 30: 57–62, 1988 [PubMed] [Google Scholar]
- 13.Ritz E, Krempien B, Mehls O, Malluche H: Skeletal abnormalities in chronic renal insufficiency before and during maintenance hemodialysis. Kidney Int 4: 116–127, 1973 [DOI] [PubMed] [Google Scholar]
- 14.Ureña P, Bernard-Poenaru O, Ostertag A, Baudoin C, Cohen-Solal M, Cantor T, de Vernejoul MC: Bone mineral density, biochemical markers and skeletal fractures in haemodialysis patients. Nephrol Dial Transplant 18: 2325–2331, 2003 [DOI] [PubMed] [Google Scholar]
- 15.Malluche HH, Meyer W, Sherman D, Massry SG: Quantitative bone histology in 84 normal American subjects. Micromorphometric analysis and evaluation of variance in iliac bone. Calcif Tissue Int 34: 449–455, 1982 [DOI] [PubMed] [Google Scholar]
- 16.Ng AH, Hercz G, Kandel R, Grynpas MD: Association between fluoride, magnesium, aluminum and bone quality in renal osteodystrophy. Bone 34: 216–224, 2004 [DOI] [PubMed] [Google Scholar]
- 17.Isaksson H, Turunen MJ, Rieppo L, Saarakkala S, Tamminen IS, Rieppo J, Kröger H, Jurvelin JS: Infrared spectroscopy indicates altered bone turnover and remodeling activity in renal osteodystrophy. J Bone Miner Res 25: 1360–1366, 2010 [DOI] [PubMed] [Google Scholar]
- 18.Ruppel ME, Burr DB, Miller LM: Chemical makeup of microdamaged bone differs from undamaged bone. Bone 39: 318–324, 2006 [DOI] [PubMed] [Google Scholar]
- 19.Wainwright S, Biggs W, Currey J, Gosline J: Mechanical Design in Organisms, New York, Halsted Press, 1976 [Google Scholar]
- 20.Bakkaloglu SA, Wesseling-Perry K, Pereira RC, Gales B, Wang HJ, Elashoff RM, Salusky IB: Value of the new bone classification system in pediatric renal osteodystrophy. Clin J Am Soc Nephrol 5: 1860–1866, 2010 [DOI] [PMC free article] [PubMed] [Google Scholar]
- 21.Malluche HH, Mawad HW, Monier-Faugere MC: Renal osteodystrophy in the first decade of the new millennium: Analysis of 630 bone biopsies in black and white patients. J Bone Miner Res 26: 1368–1376, 2011 [DOI] [PMC free article] [PubMed] [Google Scholar]
- 22.Follet H, Boivin G, Rumelhart C, Meunier PJ: The degree of mineralization is a determinant of bone strength: A study on human calcanei. Bone 34: 783–789, 2004 [DOI] [PubMed] [Google Scholar]
- 23.Mulder L, Koolstra JH, den Toonder JM, van Eijden TM: Intratrabecular distribution of tissue stiffness and mineralization in developing trabecular bone. Bone 41: 256–265, 2007 [DOI] [PubMed] [Google Scholar]
- 24.Mulder L, Koolstra JH, den Toonder JM, van Eijden TM: Relationship between tissue stiffness and degree of mineralization of developing trabecular bone. J Biomed Mater Res A 84: 508–515, 2008 [DOI] [PubMed] [Google Scholar]
- 25.Bhagat YA, Rajapakse CS, Magland JF, Love JH, Wright AC, Wald MJ, Song HK, Wehrli FW: Performance of μMRI-Based virtual bone biopsy for structural and mechanical analysis at the distal tibia at 7T field strength. J Magn Reson Imaging 33: 372–381, 2011 [DOI] [PMC free article] [PubMed] [Google Scholar]
- 26.Kaneko TM, Foley RN, Gilbertson DT, Collins AJ: Clinical epidemiology of long-bone fractures in patients receiving hemodialysis. Clin Orthop Relat Res 457: 188–193, 2007 [DOI] [PubMed] [Google Scholar]
- 27.Stehman-Breen CO, Sherrard DJ, Alem AM, Gillen DL, Heckbert SR, Wong CS, Ball A, Weiss NS: Risk factors for hip fracture among patients with end-stage renal disease. Kidney Int 58: 2200–2205, 2000 [DOI] [PubMed] [Google Scholar]
- 28.Malluche HH, Monier-Faugere MC: The role of bone biopsy in the management of patients with renal osteodystrophy. J Am Soc Nephrol 4: 1631–1642, 1994 [DOI] [PubMed] [Google Scholar]
- 29.Goldner J: A modification of the masson trichrome technique for routine laboratory purposes. Am J Pathol 14: 237–243, 1938 [PMC free article] [PubMed] [Google Scholar]
- 30.Lillie P, Fullmer H: Histopathologic Technique and Practical Histochemistry, 4th Ed., New York, McGraw Hill, 1976, pp 434–435 [Google Scholar]
- 31.Denton J, Freemont AJ, Ball J: Detection and distribution of aluminium in bone. J Clin Pathol 37: 136–142, 1984 [DOI] [PMC free article] [PubMed] [Google Scholar]
- 32.Malluche HH, Sherman D, Meyer W, Massry SG: A new semiautomatic method for quantitative static and dynamic bone histology. Calcif Tissue Int 34: 439–448, 1982 [DOI] [PubMed] [Google Scholar]
- 33.Manaka RC, Malluche HH: A program package for quantitative analysis of histologic structure and remodeling dynamics of bone. Comput Programs Biomed 13: 191–201, 1981 [DOI] [PubMed] [Google Scholar]
- 34.Parfitt AM, Drezner MK, Glorieux FH, Kanis JA, Malluche H, Meunier PJ, Ott SM, Recker RR; Report of the ASBMR Histomorphometry Nomenclature Committee: Bone histomorphometry: standardization of nomenclature, symbols, and units. J Bone Miner Res 2: 595–610, 1987 [DOI] [PubMed] [Google Scholar]
- 35.Paschalis EP, Betts F, DiCarlo E, Mendelsohn R, Boskey AL: FTIR microspectroscopic analysis of normal human cortical and trabecular bone. Calcif Tissue Int 61: 480–486, 1997 [DOI] [PubMed] [Google Scholar]
- 36.Paschalis EP, Betts F, DiCarlo E, Mendelsohn R, Boskey AL: FTIR microspectroscopic analysis of human iliac crest biopsies from untreated osteoporotic bone. Calcif Tissue Int 61: 487–492, 1997 [DOI] [PubMed] [Google Scholar]
- 37.Paschalis EP, DiCarlo E, Betts F, Sherman P, Mendelsohn R, Boskey AL: FTIR microspectroscopic analysis of human osteonal bone. Calcif Tissue Int 59: 480–487, 1996 [DOI] [PubMed] [Google Scholar]
- 38.Paschalis EP, Verdelis K, Doty SB, Boskey AL, Mendelsohn R, Yamauchi M: Spectroscopic characterization of collagen cross-links in bone. J Bone Miner Res 16: 1821–1828, 2001 [DOI] [PubMed] [Google Scholar]
- 39.Faibish D, Ott SM, Boskey AL: Mineral changes in osteoporosis: A review. Clin Orthop Relat Res 443: 28–38, 2006 [DOI] [PMC free article] [PubMed] [Google Scholar]
- 40.Gourion-Arsiquaud S, West PA, Boskey AL: Fourier transform-infrared microspectroscopy and microscopic imaging. Methods Mol Biol 455: 293–303, 2008 [DOI] [PubMed] [Google Scholar]
- 41.Boskey AL, DiCarlo E, Paschalis E, West P, Mendelsohn R: Comparison of mineral quality and quantity in iliac crest biopsies from high- and low-turnover osteoporosis: an FT-IR microspectroscopic investigation. Osteoporos Int 16: 2031–2038, 2005 [DOI] [PMC free article] [PubMed] [Google Scholar]
- 42.Pienkowski D, Doers TM, Monier-Faugere MC, Geng Z, Camacho NP, Boskey AL, Malluche HH: Calcitonin alters bone quality in beagle dogs. J Bone Miner Res 12: 1936–1943, 1997 [DOI] [PubMed] [Google Scholar]
- 43.Gadaleta SJ, Paschalis EP, Betts F, Mendelsohn R, Boskey AL: Fourier transform infrared spectroscopy of the solution-mediated conversion of amorphous calcium phosphate to hydroxyapatite: New correlations between X-ray diffraction and infrared data. Calcif Tissue Int 58: 9–16, 1996 [DOI] [PubMed] [Google Scholar]
- 44.Fan Z, Rho JY: Effects of viscoelasticity and time-dependent plasticity on nanoindentation measurements of human cortical bone. J Biomed Mater Res A 67: 208–214, 2003 [DOI] [PubMed] [Google Scholar]
- 45.Ozcivici E, Ferreri S, Qin YX, Judex S: Determination of bone’s mechanical matrix properties by nanoindentation. Methods Mol Biol 455: 323–334, 2008 [DOI] [PubMed] [Google Scholar]
- 46.Rho JY, Tsui TY, Pharr GM: Elastic properties of human cortical and trabecular lamellar bone measured by nanoindentation. Biomaterials 18: 1325–1330, 1997 [DOI] [PubMed] [Google Scholar]
- 47.Roy ME, Rho JY, Tsui TY, Evans ND, Pharr GM: Mechanical and morphological variation of the human lumbar vertebral cortical and trabecular bone. J Biomed Mater Res 44: 191–197, 1999 [DOI] [PubMed] [Google Scholar]
- 48.Oliver WC, Pharr GM: An improved technique for determining hardness and elastic modulus using load displacement sensing indentation experiments. J Mater Res 7: 1564–1583, 1992 [Google Scholar]


