

Abstract
The Cochran–Armitage trend test (CATT) is well suited for testing association between a marker and a disease in case–control studies. When the underlying genetic model for the disease is known, the CATT optimal for the genetic model is used. For complex diseases, however, the genetic models of the true disease loci are unknown. In this situation, robust tests are preferable. We propose a two-phase analysis with model selection for the case–control design. In the first phase, we use the difference of Hardy–Weinberg disequilibrium coefficients between the cases and the controls for model selection. Then, an optimal CATT corresponding to the selected model is used for testing association. The correlation of the statistics used for selection and the test for association is derived to adjust the two-phase analysis with control of the Type-I error rate. The simulation studies show that this new approach has greater efficiency robustness than the existing methods.
Keywords: Cochran–Armitage trend test, Disease risk, Efficiency robustness, Hardy–Weinberg disequilibrium, SNP
1. INTRODUCTION
The case–control design is often employed for testing association between a marker and a disease. A single-nucleotide polymorphism (SNP) is a marker with 2 alleles, denoted as A and B, where A is the at-risk one. Its genotypes are denoted as AA, AB, or BB. Testing genetic association is equivalent to finding any general association between the outcome and the observed genotypes in a 2 × 3 contingency table, for which Pearson's chi-squared test can be used. It has an asymptotic chi-squared distribution with 2 degrees of freedom (df) under the null hypothesis. However, as A is the risk allele, an individual with genotype AA is more likely to have disease than an AB individual, who in turn is more likely to have disease than a BB individual. The Cochran–Armitage trend test (CATT) (Cochran, 1954; Armitage, 1955), which utilizes this risk model, is usually more powerful than Pearson's chi-squared test with 2 df (Zheng and others, 2006). CATT has been suggested for genetic association in the case–control design (Sasieni, 1997). It is known that the statistical properties of CATT depend on the choice of scores and that the best (or optimal) set of scores which maximizes the power of the test depends on the genetic model (Sasieni, 1997; Slager and Schaid, 2001; Zheng and others, 2003). For complex diseases, however, the genetic models of the disease loci are unknown. Therefore, analysis using the CATT based on one score is not robust (Graubard and Korn, 1987; Freidlin and others, 2002). In this situation, one usually uses the CATT optimal for the additive model (Sasieni, 1997). On the other hand, when the true model is unknown, robust tests are preferable. The maximin efficiency robust test (MERT) (Gastwirth, 1966, 1985) and the maximum of the 3 CATTs (MAX) were studied in Freidlin and others (2002). Here, we follow the criterion of efficiency robustness in the previous articles and say that one test has greater efficiency robustness across a set of plausible models than another test when the minimum power of the first test is higher than that of the second test. Wang and Sheffield (2005) introduced a restricted likelihood ratio test for the case–control data and showed that it had comparable power with MAX. Empirical results also demonstrate that MAX has greater efficiency robustness than MERT (Freidlin and others, 2002). For comparison with our proposed method, we only consider CATT, MAX, and MERT.
Wittke-Thompson and others (2005) studied the directions (signs) of the Hardy–Weinberg disequilibrium (HWD) coefficients when Hardy–Weinberg equilibrium (HWE) holds in the population and used these to confirm the underlying genetic model. We further show that HWD coefficients can be used to divide the parameter space into 4 unique regions, from which genetic models can be selected. The selection of genetic models based on the above theory is, however, robust to departure from HWE in the population. Next, we propose a two-phase analysis for genetic association with model selection. In the first phase, we apply the difference of HWD coefficients between the cases and the controls to classify the underlying genetic model into 3 categories: the recessive region, additive/multiplicative region, or dominant region. In the second phase, we apply the appropriate CATT, optimal for the selected model, to test genetic association. Such two-phase selection-testing analysis has been studied by Hogg (1974) and extensively studied in clinical trials (e.g. Thall and others, 1988), but not in genetic analysis. We further derive and adjust the asymptotic correlation between the 2 analyses so that the two-phase analysis with model selection has an approximately correct size. Extensive simulation studies are also conducted to compare this new approach with the existing approaches. Finally, for illustration, we apply the two-phase analysis with model selection to real data.
2. NOTATION AND MODEL
Denote the allele frequencies in cases and controls as p = Pr(A|case) and q = Pr(A|control) and the genotypes as g0 = BB, g1 = AB, and g2 = AA. Assume that r cases and s controls are independently sampled. The observed counts for genotypes (g0, g1, g2) are (r0, r1, r2) in cases and (s0, s1, s2) in controls. The observed genotype counts (r0, r1, r2) and (s0, s1, s2) follow multinomial distributions (r; p0, p1, p2) and mul(s; q0, q1, q2), respectively, where pi = Pr(gi|case) and qi = Pr(gi|control) for i = 0, 1, 2. The null hypothesis of no association can be stated as H0 : pi = qi for i = 0, 1, 2. Denote the disease prevalence as k = Pr(case). Then, pi = Pr (gi)fi / k and qi = Pr(gi)(1 − fi)/(1 − k), where fi = Pr(case|gi) > 0 is the penetrance and k = ∑i = 02Pr(gi)fi. The null hypothesis is equivalent to H0: f0 = f1 = f2 = k. A genetic model is referred to as a relationship between 2 genotype relative risks, denoted as λ1 = f1 /f0 and λ2 = fs/f0. The null and alternative hypotheses can be equivalently stated as H0: λ1 = λ2 = 1 against H1: λ2 ≥ λ1 ≥ 1 with at least one inequality. Then, under H0, p = q. The recessive (REC), additive (ADD), multiplicative (MUL), and dominant (DOM) models refer to λ1 = 1, λ1 = (λ2 + 1)/2, λ2 = λ12, and λ1 = λ2, respectively.
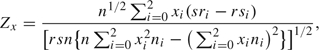
CATT models association between the outcome as a linear trend in genotypes. In a logistic regression model for case–control data with a single covariate (genotype) coded with scores (0, x, 1) for (g0, g1, g2), where 0 ≤ x ≤ 1, the score statistic is equivalent to the CATT statistic (Sasieni, 1997)
 |
(2.1) |
where ni = ri + si for i = 0, 1, 2, n = r + M, and (x0, x1, x2) = (0, x, 1). Under H0, for a given x ∈ [0, 1], Zx asymptotically follows a standard normal distribution N(1, 0). Sasieni (1997), Slager and Schaid (2001), and Zheng and others (2003) showed that the optimal choices of x for the REC, ADD (MUL), and DOM models are x = 0, 1/2, and 1, respectively.
In genetic association studies, departure from HWE in cases has also been used to test genetic association in the case–control design (Nielsen and others, 1998). However, using departure from HWE in cases as a test statistic has lower power for the additive model and no power at all for the multiplicative model (Nielsen and others, 1998; Deng and others, 2000; Song and Elston, 2003, 2006). In general, Pr(g0) = {Pr(B)}2 + FPr(A)Pr(B), Pr(g1) = 2Pr(A)Pr(B)(1 − F), and Pr(g2) = {Pr(A)}2 + FPr(A)Pr(B), where F is the Wright coefficient of inbreeding and HWE holds in the population if and only if F = 0.
3. TWO-PHASE ANALYSIS WITH GENETIC MODEL SELECTION
3.1. HWD coefficients and genetic models
HWE is usually tested using the HWD coefficients (Weir, 1996), denoted as Δ = Pr(AA) − {Pr(AA) + Pr(AB)/2}2. When HWE holds in the population, Δ = 0, under which Wittke-Thompson and others (2005) studied the directions of Δ in cases (Δp = p2 − (p2 + p1/2)2) and controls (Δq = q2 − (q2 + q1/2)2) and their relations with the underlying genetic model. They considered an additive model as λ1 = λ2/2 regardless of the reference penetrance f0, but here we use the definition λ1 = (λ2 + 1)/2.
Additional relations among Δ, Δp, and Δq are as follows: (i) Δ = 0 does not imply that Δp = 0 or Δq = 0 and vice versa; (ii) under the null hypothesis of no association, it follows from pi = qi = Pr(gi) that Δ = Δp = Δq. This implies that, when HWE holds in the population (Δ = 0), genetic association can be tested under the null hypothesis H0:Δp = Δq. On the other hand, under the alternative hypothesis of association, whether or not HWE holds in the population cannot be tested using the retrospective case–control data. Song and Elston (2006) considered a Hardy–Weinberg disequilibrium trend test (HWDTT) based on H0:Δp − Δq = 0. Here, following Wittke-Thompson and others (2005), we assume that HWE holds in the population and use the HWDTT for genetic model selection. The sensitivity of departure from HWE is examined empirically in Section B of the supplementary material available at Biostatistics online (http://www.biostatistics.oxfordjournals.org). Substituting pi = Pr(gi)fi/k and qi = Pr(gi)(1 − fi)/(1 − k) into Δp and Δq with Δ = 0, one obtains the following: Δp = f02p2q2(λ2 − λ12)/k2 and Δq = f0p2q2(2λ1 − 1 − λ2 − f0λ12 + f0λ2)/(1 − k)2. Wittke-Thompson and others (2005) proved that Δp > 0 and Δq < 0 under the REC model (λ1 = 1), Δp < 0 and Δq > 0 under the DOM model (λ1 = λ2), and Δp = 0 and Δq < 0 under the MUL model (λ2 = λ12). Under the ADD model (f1 = (f0 + f2)/2), it can be shown similarly that both Δp and Δq are negative. The 4 genetic models with the directions of (Δp,Δq) are plotted in Figure 1. The open triangle, formed by REC and DOM in Figure 1, indicates the null and alternative hypotheses. The vertex C(1,1) corresponds to the null hypothesis. The signs of (Δp,Δq) for the 4 models are indicated with the labels of the genetic models. The curve CD corresponds to λ2 = ( − f0λ12 + 2λ1 − 1)/(1 − f0), the condition used to determine the sign of Δq. It follows from Figure 1 that the 4 genetic models plus the curve CD divide the alternative hypothesis into 4 mutually exclusive open regions: R1, R2, R3, and R4 (boundaries are excluded). The signs of (Δp,Δq) in the 4 open regions can be uniquely determined when HWE holds in the population (see Section A of the supplementary material available at Biostatistics online). Based on the above analysis, the difference of HWD coefficients between cases and controls can be used to classify the REC and DOM models. For example, the REC and DOM models imply that Δp − Δq > 0 and Δp − Δq < 0, respectively.
Fig. 1.

Signs of HWD coefficients and genetic models.
3.2. Two-phase analysis with model selection
When the genetic model is unknown, Z1/2 has the greatest efficiency robustness among the family of statistics {Zx:x∈[0,1]} against model misspecification and is often used in applications (Sasieni, 1997; Slager and Schaid, 2001; Freidlin and others, 2002; Zheng and others, 2005). Other robust tests considered by Freidlin and others (2002) are MAX = max(|Z0|,|Z1/2|,|Z1|) and the MERT given by  , where
  , is a consistent estimate of the asymptotic null correlation between Z0 and Z1. The MERT and MAX have been shown to have high-efficiency robustness in hypothesis testing in survival and ordered categorical data, and genetic data analyses when the model underlying the data is uncertain, but a family of scientifically plausible models and their normally distributed tests are available (Gastwirth, 1966, 1985; Davies, 1977; Zucker and Lakatos, 1990; Whittemore and Tu, 1998; Freidlin and others, 1999; Gastwirth and Freidlin, 2000; Shih and Whittemore, 2001).
We propose a two-phase analysis where we classify the underlying genetic model in the first phase followed by testing association using the optimal CATT for the selected model in the second phase. Song and Elston (2006) considered testing association using the test statistic
where  and
and  are the estimates of Δp and Δq, respectively, with
  and
and  .
.
From Figure 1 and the signs of (Δp,Δq) for the 4 genetic models and regions, it seems that the ADD and MUL models cannot be distinguished by the signs as (Δp,Δq) have the same sign ( − , − ) under the 2 models. However, Z1/2 is asymptotically optimal for both ADD and MUL models under local alternatives. Thus, it is not necessary to distinguish them. On the other hand, the ADD (MUL) model may be distinguished from the REC and DOM models by the signs of (Δp,Δq). Thus, in the first phase, we classify the genetic model in the recessive region (R1) if ZHWDTT > c, the dominant region (R4) if ZHWDTT < − c, and in the middle region (R2 and R3) containing the ADD or MUL models otherwise, where c > 0 is a prespecified real number. In the second phase, we choose Zmodel as a test statistic for association, given by Zmodel = Z0 if ZHWDTT > c, Z1 if ZHWDTT < − c, and Z1/2 if otherwise, where we choose c = Φ − 1(0.95) = 1.645. The performance of the above model selection is examined and the results are reported in Section B of the supplementary material available at Biostatistics online. When p ≥ 0.3, the probabilities to select correct REC/DOM and ADD/MUL models are greater than 65% and 85% and are robust to departure from HWE.
3.3. Adjustment of the sizes of the two-phase analysis with model selection
To correct the size of Zmodel analytically, the correlation between the two phases of the analysis needs to be derived. In Section C of the supplementary material available at Biostatistics online, we obtain corrH0(ZHWDTT,Z0) = {(1 − p)/(1 + p)}1/2 + O(n − 1), corrH0(ZHWDTT,Z1/2) = O(n − 1), and corrH0(ZHWDTT,Z1) = − {p/(2 − p)}1/2 + O(n − 1), where p = Pr(A|case) = Pr(A|control) under H0. Note that ZHWDTT and Z1/2 are asymptotically independent.
Suppose in the second phase the null hypothesis corresponding to the jth SNP (j = 1,…,M) is rejected at the level α*/M using the normal distribution. Then, to control the overall level at the given α in the two-phase analysis with model selection for M SNPs, we have α/M = PrH0(|Z1/2| > z(1 − α*/(2M)),|ZHWDTT| < c) + PrH0(|Z0| > z(1 − α*/(2M)),ZHWDTT > c) + PrH0(|Z1| > z(1 − α*/(2M)),ZHWDTT < − c) and PrH0(|Z1/2| > z(1 − α*/(2M)),|ZHWDTT| < c) = 0.9α*/M, where z(1 − α) is the upper αth percentile of N(0,1). Using the bivariate normal distribution of (Zx, ZHWDTT) with correlation ρx, α* satisfies
 |
(3.1) |
where Ω0 = {u:u > c}, Ω1 = {u:u < − c}, and ρx = corrH0(ZHWDTT,Zx). Given α and M and under HWE in the population, this shows that α* only asymptotically depends on p (=q, under H0), which can be estimated consistently using the observed data (Weir, 1996) by  . The supplementary material available at Biostatistics online (Section E) includes a SAS IML macro to calculate α*. Table 1 (the last column) reports the simulated levels of significance using the adjusted significance level (α*) for Zmodel. The adjusted level α* was calculated for each simulated data set. The sizes of the analytically adjusted level (α*) based on (3.1) are not significantly different from the nominal level. For rare allele frequency (p = 0.1), the level α* leads to a conservative test. The last part of Table 1 also shows that departure from HWE does not inflate the Type-I error rates of the 4 genotype-based test statistics (see comments of Sasieni, 1997).
Table 1.
Type-I error rates of the robust tests based on 10 000 replications with the nominal level 0.05 using r cases and s controls and Wright's coefficient of inbreeding F. The α is unadjusted and α* is analytically adjusted levels
| F | r | s | p | k | Z1/2 | MAX | ZMERT | Zmodel | |
| α | α* | ||||||||
| 0 | 500 | 500 | 0.1 | 0.01 | 0.0486 | 0.0497 | 0.0395 | 0.0621 | 0.0423 |
| 0 | 500 | 500 | 0.1 | 0.1 | 0.0477 | 0.0506 | 0.0436 | 0.0606 | 0.0415 |
| 0 | 250 | 250 | 0.3 | 0.01 | 0.0482 | 0.0510 | 0.0477 | 0.0607 | 0.0456 |
| 0 | 250 | 250 | 0.3 | 0.1 | 0.0525 | 0.0509 | 0.0524 | 0.0634 | 0.0506 |
| 0 | 250 | 250 | 0.5 | 0.01 | 0.0476 | 0.0472 | 0.0471 | 0.0590 | 0.0455 |
| 0 | 250 | 250 | 0.5 | 0.1 | 0.0511 | 0.0514 | 0.0512 | 0.0640 | 0.0506 |
| 0 | 400 | 600 | 0.1 | 0.01 | 0.0481 | 0.0503 | 0.0427 | 0.0703 | 0.0505 |
| 0 | 400 | 600 | 0.1 | 0.1 | 0.0468 | 0.0448 | 0.0409 | 0.0644 | 0.0459 |
| 0 | 200 | 300 | 0.3 | 0.01 | 0.0472 | 0.0498 | 0.0454 | 0.0628 | 0.0487 |
| 0 | 200 | 300 | 0.3 | 0.1 | 0.0469 | 0.0468 | 0.0455 | 0.0630 | 0.0481 |
| 0 | 200 | 300 | 0.5 | 0.01 | 0.0452 | 0.0446 | 0.0452 | 0.0597 | 0.0470 |
| 0 | 200 | 300 | 0.5 | 0.1 | 0.0522 | 0.0539 | 0.0523 | 0.0654 | 0.0531 |
| 0.05 | 500 | 500 | 0.1 | 0.01 | 0.0490 | 0.0562 | 0.0477 | 0.0648 | 0.0475 |
| 0.05 | 500 | 500 | 0.1 | 0.1 | 0.0438 | 0.0476 | 0.0443 | 0.0580 | 0.0411 |
| 0.05 | 250 | 250 | 0.3 | 0.01 | 0.0485 | 0.0486 | 0.0500 | 0.0625 | 0.0472 |
| 0.05 | 250 | 250 | 0.3 | 0.1 | 0.0466 | 0.0468 | 0.0467 | 0.0612 | 0.0462 |
| 0.05 | 250 | 250 | 0.5 | 0.01 | 0.0491 | 0.0519 | 0.0490 | 0.0627 | 0.0494 |
| 0.05 | 250 | 250 | 0.5 | 0.1 | 0.0503 | 0.0514 | 0.0504 | 0.0627 | 0.0489 |
4. NUMERICAL RESULTS
In Section D of the supplementary material available at Biostatistics online, we reported simulation studies to compare power for various approaches. Our results show that the two-phase analysis with model selection (Zmodel) has greater efficiency robustness than MAX, although their power difference is about 2–3%. The Zmodel has at least 95% efficiency under ADD/MUL and 100–225% (100–123%) under REC (DOM) relative to the CATT.
To illustrate the use of the two-phase model selection, we consider the top 2 SNPs in a genome-wide case–control study for age-related macular degeneration (AMD) presented in Klein and others (2005). After the quality control of genotyping, there were 103 611 SNPs left for testing association. Each SNP was tested at the level α = 0.05/103611 = 4.82×10 − 7. The top 2 SNPs (rs380390 and rs1329428) with smallest p-values were found in a close region and were further studied by biology and haplotype analysis. The results show that this region is associated with AMD. For both SNPs, the underlying genetic models are uncertain.
The data set for the top SNP (rs380390) was given by (r0,r1,r2) = (50,35,11) for cases and (s0,s1,s2) = (6,25,19) for controls. The CATT with the additive score is Z1/2 = 5.1171 with unadjusted p-value 3.1×10 − 7 < α. The MERT is ZMERT = 5.0735 with unadjusted p-value 3.91×10 − 7 < α. Further, we have MAX = Z1/2 = 5.1171 and its simulated p-value is 5.9×10 − 7 based on 108 replicates, which indicates that the association is marginally significant. For the model selection, using (3.1), we obtained the adjusted significance level α* = 0.0387 and ZHWDTT = 1.0283. This suggests that we use Zmodel = Z1/2 with p-value 3.1×10 − 7. After Bonferroni correction, the adjusted p-value is 0.032 < α*. Thus, the SNP is significantly associated with the AMD after Bonferroni correction. Note that the two-phase analysis selected the largest CATT in the first phase.
The second top SNP (rs1329428) was given by (r0,r1,r2) = (2,24,68) for cases and (s0,s1,s2) = (5,29,14) for controls. Using (3.1), the adjusted significance level is α* = 0.0374. The CATT Z1/2 = 4.9189 with unadjusted p-value 8.7×10 − 7 > α. On the other hand, ZMERT = 4.4523 with unadjusted p-value 8.5×10 − 6 > α. The MAX is equal to Z0 = 4.9268 and its simulated p-value is 6.6×10 − 7. Since ZHWDTT = 1.930, we select the CATT with the recessive score in the second phase and Zmodel = Z0 = 4.9268 with unadjusted p-value 8.36×10 − 7, which is not significant after Bonferroni correction. In fact, none of the 4 nonadaptive robust tests reached statistical significance; however, the two-phase test selected the appropriate CATT.
5. DISCUSSION
In testing genetic association between a SNP and a disease using a case–control design, we studied a new two-phase analysis, where an underlying genetic model is selected in the first phase based on the difference of HWD coefficients between cases and controls. Then, in the second phase, we use the CATT for association with the score optimal for the selected model. Since two-phase analyses are correlated, we derived their asymptotic null correlations and used them to adjust the level in the two-phase analysis to control the Type-I error rate.
Our simulation results demonstrate that this new approach compares favorably with other existing approaches, including the CATT with the additive score (Sasieni, 1997) and the robust tests (MERT and MAX) of Freidlin and others (2002). When the underlying genetic model is uncertain, it has the greatest efficiency robustness among all the tests considered here. Thus, it is useful for genetic data analysis using case–control data. Since it has been shown that MAX and likelihood ratio tests have comparable power, we did not compare our approach to the likelihood ratio test.
One assumption in this article is that HWE holds in the population. Although model selection can be uniquely determined when HWE holds in the population, our empirical results showed that a moderate departure from HWE had little effect on the power performance of the model selection under various genetic models. Nor did departure of HWE inflate Type-I error rates. It is known that case–control designs for genetic association may be affected by population stratifications and/or cryptic relatedness (Devlin and Roeder, 1999; Pritchard and Rosenberg, 1999; Satten and others, 2001; Zheng and others, 2005; Gorroochurn and others, 2006). This needs to be examined in the future. In addition, we chose a fixed threshold value as the upper 95th normal percentile in the model selection phase. Data-driven threshold levels may further improve the power. This also needs future research.
Supplementary Material
Acknowledgments
The authors gratefully acknowledge the editor, the associate editor, and the 2 anonymous referees for their constructive comments. The authors would also like to thank Prof. William R. Schucany and Ms Julia Kozlitina for their suggestions which resulted in a much improved version of the manuscript. Conflict of Interest: None declared.
References
- Armitage P. Tests for linear trends in proportions and frequencies. Biometrics. 1955;11:375–386. [Google Scholar]
- Cochran WG. Some methods for strengthening the common chi-square tests. Biometrics. 1954;10:417–451. [Google Scholar]
- Davies RB. Hypothesis testing when a nuisance parameter is present only under the alternative. Biometrika. 1977;64:247–254. doi: 10.1111/j.0006-341X.2005.030531.x. [DOI] [PubMed] [Google Scholar]
- Deng HW, Chen WM, Recker RR. QTL fine mapping by measuring and testing for Hardy-Weinberg and linkage disequilibrium at a series of linked marker loci in extreme samples of population. American Journal of Human Genetics. 2000;66:1027–1045. doi: 10.1086/302804. [DOI] [PMC free article] [PubMed] [Google Scholar]
- Devlin B, Roeder K. Genomic control for association studies. Biometrics. 1999;55:997–1004. doi: 10.1111/j.0006-341x.1999.00997.x. [DOI] [PubMed] [Google Scholar]
- Freidlin B, Podgor MJ, Gastwirth JL. Efficiency robust tests for survival or ordered categorical data. Biometrics. 1999;55:883–886. doi: 10.1111/j.0006-341x.1999.00883.x. [DOI] [PubMed] [Google Scholar]
- Freidlin B, Zheng G, Li Z, Gastwirth JL. Trend tests for case-control studies of genetic markers: power, sample size and robustness. Human Heredity. 2002;53:146–152. doi: 10.1159/000064976. [DOI] [PubMed] [Google Scholar]
- Gastwirth JL. On robust procedures. Journal of the American Statistical Association. 1966;61:929–948. [Google Scholar]
- Gastwirth JL. The use of maximin efficiency robust tests in combining contingency tables and survival analysis. Journal of the American Statistical Association. 1985;80:380–384. [Google Scholar]
- Gastwirth JL, Freidlin B. On power and efficiency robust linkage tests for affected sibs. Annals of Human Genetics. 2000;64:443–453. doi: 10.1046/j.1469-1809.2000.6450443.x. [DOI] [PubMed] [Google Scholar]
- Gorroochurn P, Heiman GA, Hodge SE, Greenberg DA. Centralizing the non- central chi-square: a new method to correct for population stratification in genetic case-control association studies. Genetic Epidemiology. 2006;30:277–289. doi: 10.1002/gepi.20143. [DOI] [PubMed] [Google Scholar]
- Graubard BI, Korn EL. Choice of column scores for testing independence in ordered 2 × K contingency tables. Biometrics. 1987;43:471–476. [PubMed] [Google Scholar]
- Hogg RV. Adaptive robust procedures—partial review and some suggestions for future applications and theory. Journal of the American Statistical Association. 1974;69:909–923. [Google Scholar]
- Klein RJ, Zeiss C, Chew EY, Tsai JY, Sackler RS, Haynes C, Henning AK, Sangiovanni JP, Mane SM, Mayne ST, et al. Complement factor H polymorphism in aged-related macular degeneration. Science. 2005;308:385–389. doi: 10.1126/science.1109557. [DOI] [PMC free article] [PubMed] [Google Scholar]
- Nielsen DM, Ehm MG, Weir BS. Detecting marker-disease association by testing for Hardy-Weinberg disequilibrium at a marker locus. American Journal of Human Genetics. 1998;63:1531–1540. doi: 10.1086/302114. [DOI] [PMC free article] [PubMed] [Google Scholar]
- Pritchard MJ, Rosenberg NA. Use of unlinked genetic markers to detect population stratification in association studies. American Journal of Human Genetics. 1999;65:220–228. doi: 10.1086/302449. [DOI] [PMC free article] [PubMed] [Google Scholar]
- Sasieni PD. From genotypes to genes: doubling the sample size. Biometrics. 1997;53:1253–1261. [PubMed] [Google Scholar]
- Satten GA, Flanders WD, Yang Q. Account for unmeasured population substructure in case-control studies of genetic association using a novel latent-class model. American Journal of Human Genetics. 2001;68:466–477. doi: 10.1086/318195. [DOI] [PMC free article] [PubMed] [Google Scholar]
- Shih M, Whittemore AS. Allele-sharing among affected relatives: nonparametric methods for identifying genes. Statistical Methods in Medical Research. 2001;10:27–55. doi: 10.1177/096228020101000103. [DOI] [PubMed] [Google Scholar]
- Slager SL, Schaid DJ. Case-control studies of genetic markers: power and sample size approximations for Armitage's test for trend. Human Heredity. 2001;52:149–153. doi: 10.1159/000053370. [DOI] [PubMed] [Google Scholar]
- Song K, Elston RC. The Hardy-Weinberg disequilibrium (HWD) measure and test statistics for a disease-susceptibility locus with multiple alleles allowing for an inbreeding coefficient (F) Genetica. 2003;119:269–293. doi: 10.1023/b:gene.0000003681.02766.3c. [DOI] [PubMed] [Google Scholar]
- Song K, Elston RC. A powerful method of combining measures of association and Hardy-Weinberg disequilibrium for fine-mapping in case-control studies. Statistics in Medicine. 2006;25:105–126. doi: 10.1002/sim.2350. [DOI] [PubMed] [Google Scholar]
- Thall PF, Simon R, Ellenberg SS. Two-stage selection and testing designs for comparative clinical trials. Biometrika. 1988;75:303–310. [Google Scholar]
- Wang K, Sheffield VC. A constrained-likelihood approach to marker-trait association studies. American Journal of Human Genetics. 2005;77:768–780. doi: 10.1086/497434. [DOI] [PMC free article] [PubMed] [Google Scholar]
- Weir BS. Genetic Data Analysis II: Methods for Discrete Population Genetic Data. Sunderland, MA: Sinauer Associations Inc; 1996. [Google Scholar]
- Whittemore AS, Tu I-P. Simple, robust linkage tests for affected sibs. American Journal of Human Genetics. 1998;62:1228–1242. doi: 10.1086/301820. [DOI] [PMC free article] [PubMed] [Google Scholar]
- Wittke-Thompson JK, Pluzhnikov A, Cox NJ. Rational inferences about departure from Hardy-Weinberg equilibrium. American Journal of Human Genetics. 2005;76:967–986. doi: 10.1086/430507. [DOI] [PMC free article] [PubMed] [Google Scholar]
- Zheng G, Freidlin B, Gastwirth JL. Comparison of robust tests for genetic association using case-control studies (2nd special issue in honor of E.L. Lehmann) IMS Lecture Notes—Monograph Series. 2006;49:253–265. [Google Scholar]
- Zheng G, Freidlin B, Li Z, Gastwirth JL. Choice of scores in trend tests for case-control studies of candidate-gene associations. Biometrical Journal. 2003;45:335–348. [Google Scholar]
- Zheng G, Freidlin B, Li Z, Gastwirth JL. Genomic control for association studies under various genetic models. Biometrics. 2005;61:186–192. doi: 10.1111/j.0006-341X.2005.t01-1-.x. [DOI] [PubMed] [Google Scholar]
- Zucker DM, Lakatos E. Weighted log rank type statistics for comparing survival curves when there is a time lag in the effectiveness of treatment. Biometrika. 1990;77:853–864. [Google Scholar]
Associated Data
This section collects any data citations, data availability statements, or supplementary materials included in this article.