Abstract
Objectives
Calibration studies are routinely performed to establish examiner reliability in clinical periodontal research. In these studies, each periodontal site is assessed in duplicate, enabling point and interval estimation of agreement measures. We show how these data can be used additionally to discover subgroups among the periodontal sites according to degree of agreement with true periodontal status and to identify factors associated with examiner bias.
Methods
A Bayesian hierarchical model is developed that, for all examiners, links the examiner’s recorded measurement with the site’s true periodontal status, allowing for site-specific examiner effects on the recorded measurement. These site-specific examiner effects are modeled as arising from a Dirichlet process mixture, which yields a small number (relative to the number of sites) of distinct effects for each examiner. Hence sites that share the same examiner effect form a subgroup for which that examiner exhibits consistent bias relative to truth. We fit this model to data from a pilot calibration study for probed pocket depth measurements and use the results to explore examiner-specific groupings of sites according to degree of agreement with true pocket depth. The discovered group assignments were then associated with characteristics of the site.
Results
The Bayesian hierarchical modeling revealed that periodontal sites were grouped according to bias into three, two and two subgroups, respectively, for each of the three study examiners. The magnitude of the bias was associated with tooth position and true depth of the pocket.
Conclusions
Our Bayesian hierarchical model enhances the utility of data obtained from calibration studies for periodontal pocket depth by facilitating discovery of subgroups of sites according to examiner bias. The results indicate that targeting specific tooth locations and pocket depths during examiner training, uniquely for each examiner, may reduce bias in periodontal pocket depth measurements, thereby enhancing the quality of oral epidemiologic research.
Introduction
A high degree of examiner agreement for periodontal measures is vital in oral epidemiological research (1–5). Hence examiners are routinely trained and periodically evaluated using calibration studies in which subjects’ periodontal sites are assessed in duplicate by study examiners. The usual goal of statistical analyses of data arising from these calibration studies is to obtain estimates of agreement indices and their standard errors (Fleiss (6) particularly emphasized the importance of standard errors). Such analyses are usually performed separately for subsets of the data for each examiner pair and hence lose the full strength of information available in the data. In contrast, we present a model-based approach utilizing all data that, in addition to agreement estimation, facilitates discovery of subgroups among periodontal sites according to degree of agreement with true periodontal status and identification of factors associated with examiner bias. Knowledge of such subgroups, especially for inexperienced examiners, would be valuable for targeting training toward sources of bias to ultimately enhance the quality of oral epidemiologic research.
Statistical analyses of periodontal calibration data must accommodate within-subject correlation, i.e., that measurements obtained from the same subject (or cluster) are more alike than those obtained from independent subjects (7–11). Such correlation occurs when measurements are taken from different sites in the same mouth, and also when duplicate measurements are taken from the same site. To better understand the nature of examiner bias, our model also incorporates parameters that quantify site-level bias effects for each examiner. We incorporate these characteristics in a Bayesian hierarchical model that links an examiner’s measured probed pocket depth with the true pocket depth of the site. The hierarchical structure of the model draws strength across all examiners and subjects when estimating agreement for any examiner pair, thereby gaining substantial efficiency over estimates of agreement derived from data subset on specific examiner pairs. The site-specific examiner effects are modeled as arising from a Dirichlet process mixture, which yields a small number (relative to the number of sites) of distinct effects for each examiner. Hence sites that share the same examiner effect form a subgroup for which that examiner exhibits consistent bias relative to truth. The aims of this manuscript are (1) to describe our model-based approach to assessing agreement and discovery of the examiner-specific site subgroups, (2) to apply these methods to the pilot periodontal calibration data, and (3) to use the discovered subgroups to identify site-level characteristics influencing examiner bias.
Materials and methods
Data description
The motivating data were obtained from a pilot calibration exercise for dental hygienists in the clinical core of the Center for Oral Health Research at the Medical University of South Carolina. This pilot calibration study was used to obtain preliminary measures of agreement for probed pocket depth and corresponding uncertainty, which were then used to design a formal examiner calibration study described elsewhere (12). The study protocol was approved by the institutional review board process and all nine subjects participating in the calibration session provided informed consent. This pilot calibration and subsequent examiner training were performed in preparation for an epidemiologic project investigating the association between periodontal disease and glycosylated hemoglobin levels among African American Gullah with Type 2 diabetes.
A highly experienced standard examiner (S) performed a preliminary training session for three dental hygienists (A, B and C) in basic methodology for clinical research and correct procedures for performing standardized periodontal examinations, including measuring probing pocket depth (PPD), the focus of this paper. All three hygienists had more than 2 years of clinical experience, but little to no prior experience in clinical research. Using a UNC probe, probing depth was measured as the distance from the free gingival margin to the base of the periodontal pocket, and recorded as the largest whole millimeter less than or equal to the value observed. The minimum and maximum allowable PPD measures were 0mm and 15mm, respectively. The millimeter markings on all probes were validated before their use.
For each of nine calibration subjects, pocket depth was measured at six periodontal sites (distobuccal, midbuccal, mesiobuccal, distolingual, midlingual, and mesiolingual) of all teeth except third molars and teeth restored with implants. Duplicate probing depth measures at each of the 1080 sites were used to estimate inter- and intra-examiner reliability, reported elsewhere (12). The number of clusters for examiner pairs ranged from 1 to 5, and the average cluster comprised 35 periodontal sites.
Model specification
We distinguish between pocket depth (the true biological state) and probing depth (its clinical measure), the latter being subject to error. We further distinguish between observed and recorded probing depth. Observed probing depth is the measurement as seen on the manual probe (a continuous measure), while recorded probing depth is the measurement listed in the database for subsequent analysis (an integer value).
Our model consists of three conditionally related submodels: 1) true pocket depth, with subject-specific random effects capturing the correlation among pocket depths within the same mouth; 2) observed probing depth conditional on pocket depth, with correlation between duplicate observations from the same periodontal site, and a Dirichlet process prior (DPP) on the examiner-bias parameters to accommodate possible subgroup structure in examiner effects; and 3) recorded probing depth conditional on observed probing depth. Notationally, with i denoting the subject (i = 1, 2, …, n), j the periodontal site (j = 1, 2, …, ni), and k the replicate probing (k = 1, 2) our model consists of the three submodels below:
| (1) |
| (2) |
| (3) |
All ‘Error’ terms are normally distributed, mutually independent, and independent of all other model effects. Thus the true pocket depth is lognormally distributed, and μ represents the population average log depth; the observed probing depth is also lognormally distributed. The examiner bias terms in (2) capture systematic effects associated with the examiner’s probing of the site (i, j), and are denoted as βS,ij, βA,ij, βB,ij or βC,ij according to whether the standard examiner S, or study examiner, A, B, or C, performed the kth probing of site (i, j). For convenience, let βE,ij denote the bias terms for examiner E, where E ∈ {S, A, B, C}. We assume that the standard examiner is unbiased, and hence fix βS,ij = 0. Positive bias, βE,ij > 0, indicates an observed probing depth deeper than truth.
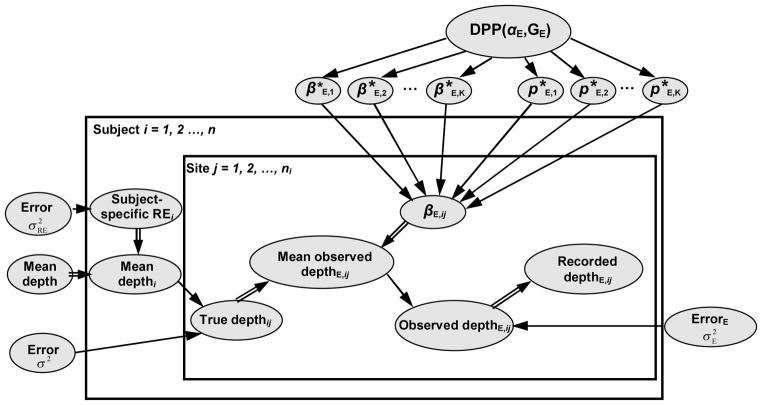
Figure 1 shows a representation of our model using a directed acyclic graph (DAG) (13). The nodes (ovals) are model components, which are linked by arrows indicating directional dependence. The node at the head of the arrow depends deterministically (indicated by a double-edged arrow) or stochastically (indicated by a single-edged arrow) on the node at the tail of the arrow. Large rectangles (or plates) indicate repetitive structures, and the overlay of plates represents a nested hierarchy of such structures. The model is acyclic since nodes cannot be revisited after following an arrow.
Figure 1.
Graphical representation of the statistical model for probed pocket depth measurements arising from a calibration study. The true pocket depth of periodontal site j for subject i, which is not observed, depends on the mean pocket depth for this subject and error. The observed probing depth depends on the true pocket depth and bias terms βE,ij associated with the examiner E performing the probing. The recorded probing depth is a deterministic function (truncation) of the observed probing depth. See text for additional explanation.
To illustrate, consider the node ‘True depthij’ located in the ‘Site’ plate nested within the ‘Subject’ plate, and representing the true pocket depth for the ith subject at the jth periodontal site. As indicated in Fig. 1, true pocket depth for subject i site j depends on two components – that subject’s mean pocket depth (‘Mean depthi’) and an error term. The arrows depicting this dependence are single-edged indicating a stochastic – or distributional – relationship. For the node ‘Mean depthi’, we see subject i’s mean pocket depth depends deterministically (by the sum, from Eqn. (1)) on a population-level mean depth (‘Mean depth’) and a subject-specific random effect (‘Subject-specific REi’).
The periodontal measures obtained by the study examiners A, B and C may differ from those of the standard examiner S according to both bias (which is captured in the parameters βE,ij) and variability. This variability corresponds to the variance of the ‘Errorijk’ term in the submodel for the observed probing depth, Eqn. (2), and is denoted as in Fig. 1. We permit full flexibility in our modeling of the pilot calibration data by allowing the βE,ij and parameters to be unconstrained apart from βS,ij = 0.
Subgroup Discovery and Model Estimation
Because the bias parameters associated with examiner E’s observed probing depth, βE,ij, are modeled as arising from a DPP unique to each examiner, the induced posterior distribution is discrete with distinct values and associated probabilities summing to one (14). When the bias terms βE,ij and βE,i′j′ for two different periodontal sites (i, j) and (i′, j′ ) are estimated by the same value drawn from the values , we say that these sites occur in the same subgroup for examiner E. Thus K is the maximum number of subgroups that can be discovered among the periodontal sites for which an examiner has distinct bias characteristics. Because some of the probabilities may be zero, the site-specific bias terms for examiner E may assume fewer than K values and, consequently, form fewer than K subgroups. The maximum value of K cannot exceed 9, the number of distinct recorded probing depths in our data (0 to 8 mm) (14). We used K = 6 in our analyses, a balanced compromise between this maximum value and our reasoning that the number of subgroups of distinct behavior for an examiner should be small given all examiners have more than 2 years of clinical experience.
We fit our model using WinBUGS (13) with noninformative proper prior distributions for the location μ and all standard deviation parameters σRE, σ, σE (code is available from the authors). For the DPP, the base distribution GE was the same diffuse normal centered at zero for all examiners, and the DPP precision αE was fixed at 8 following extensive sensitivity analyses over the range (0.5, 20) using simulated data. Convergence was assessed graphically and using the modified Gelman-Rubin statistic (15) for three chains. We used 50,500 iterations for burn-in and an additional 10,000 iterations for posterior inference. We evaluated the fit of our model relative to a null model – one with common examiner variance and no biases – using the deviance information criterion DIC3 of Celeux et al. (16), for which smaller values indicate better model fit.
The least squares method of Dahl (17) was used for determining the subgroups of periodontal sites for each examiner from the 10,000 realizations of the bias parameters {βE,ij, i = 1, 2, …, n, j = 1, 2, …, ni}. The posterior pairwise probability that sites (i, j) and (i′, j′ ) are in the same subgroup is estimated by the proportion of the 10,000 realizations for which βE,ij = βE,i′j′. Put briefly, Dahl’s method yields the grouping of the periodontal sites that best matches (in a least squares sense) these pairwise posterior probabilities.
Results
Our model demonstrated substantial improvement in fit relative to the null model (DIC3 = 3381 versus 4560), providing strong evidence for heterogeneous examiner variance and site-specific biases for each examiner. An important assumption of our modeling is that the standard examiner S is unbiased; the results indicate this examiner is also highly precise. Indeed, the posterior median estimates for σS, σA, σB, and σC are 0.08, 0.13, 0.24 and 0.15 mm, respectively, indicating the greater variability of examiner B’s measures.
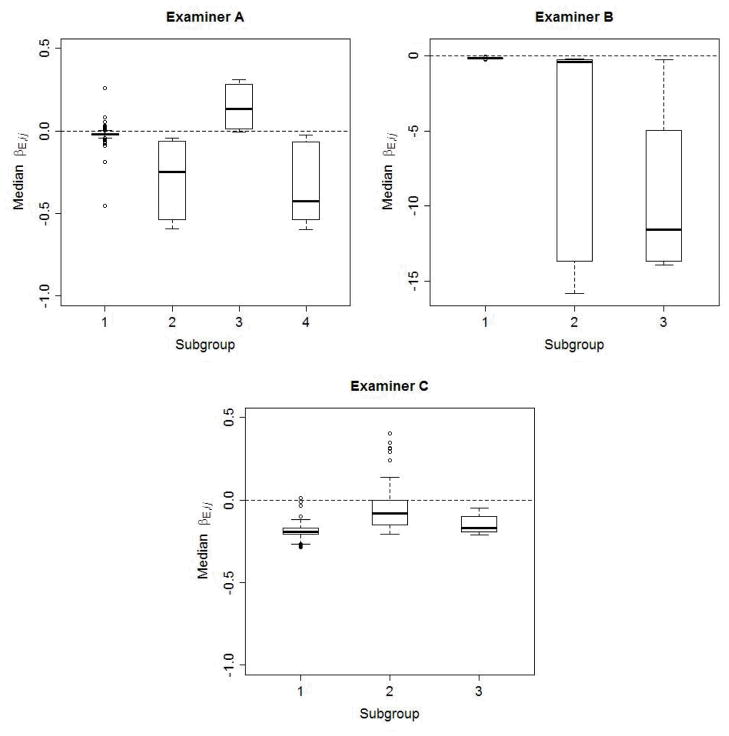
Application of the subgroup assignment method of Dahl (17) to the posterior realizations of the βE,ij revealed 4 subgroups for examiner A and 3 subgroups for each of examiners B and C, after exclusion of an additional subgroup containing a single site for each examiner. Figure 2 shows boxplots of the median values of the site biases for each examiner by discovered subgroup. Examiner A probed 443 periodontal sites among the 9 subjects, for which most (410) were classified into subgroup 1 exhibiting little bias, although negative bias was present for the 25 sites in subgroups 2 and 4, and positive bias emerged for 8 sites in subgroup 3. Examiner B’s measures were mildly negatively biased (subgroup 1), but showed more substantial negative bias for the 14 sites in subgroups 2 and 3, for which this examiner recorded 0 mm. Examiner C was predominantly negatively biased (414 sites in subgroups 1 and 3), but showed some positive bias among the 59 sites in subgroup 2.
Figure 2.
Boxplots of the posterior median βE,ij for each subgroup of periodontal sites. The medians are determined from 10,000 posterior realizations. The bias effects associated with the 443 sites probed by examiner A fell into 4 subgroups; the bias effects for the 455 sites probed by examiner B formed 3 subgroups; and the bias effects for the 473 sites probed by examiner C also formed 3 subgroups. To avoid excessive compression, the scale for examiner C extends more negatively than for the other examiners.
Based on similarities of the posterior densities, we combined subgroups 2 and 4 for examiner A, subgroups 2 and 3 for examiner B, and subgroups 1 and 3 for examiner C, yielding 3, 2 and 2 subgroups, respectively, for the examiners A, B and C. To better understand the nature of examiner bias, we investigated the association of site subgroup assignment with tooth position (anterior/posterior, maxillary/mandibular) and site location (lingual/buccal, proximal/mid-tooth).
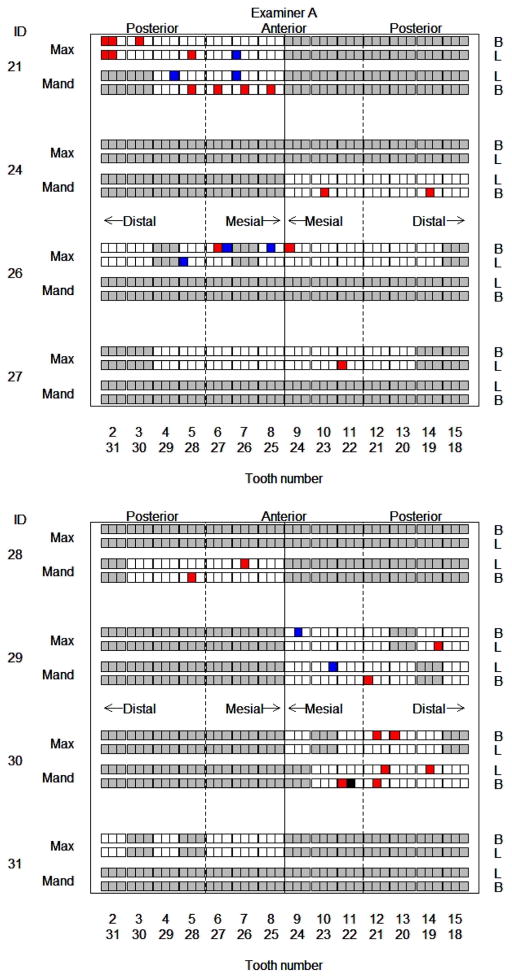
Figure 3 depicts subgroup assignment for each site probed by examiner A. Relative to sites in subgroup 1, the majority of negatively biased sites (i.e. those in subgroup 2) are mid-tooth (64% vs 31%, p = 0.03) or buccal (68% vs 49%, p = 0.02). Similarly, the majority of sites for which examiner A is positively biased (i.e. those in subgroup 3) are on anterior teeth (75% vs 49%, p = 0.03). Thus additional training for examiner A may focus on these specific sites, e.g. directing toward less probing force for anterior sites.
Figure 3.
Graphical depiction of subgroup assignments of periodontal sites for examiner A. Each small square corresponds to one probing site. The color of the site denotes subgroup assignment: White = subgroup 1, red = subgroup 2, blue = subgroup 3; black indicates the singleton class; and gray sites were not probed by this examiner. Site location is indicated as Max = maxillary jaw, Mand = mandibular jaw, B = buccal, L = lingual, with the relative location of the square further indicating mesial/distal.
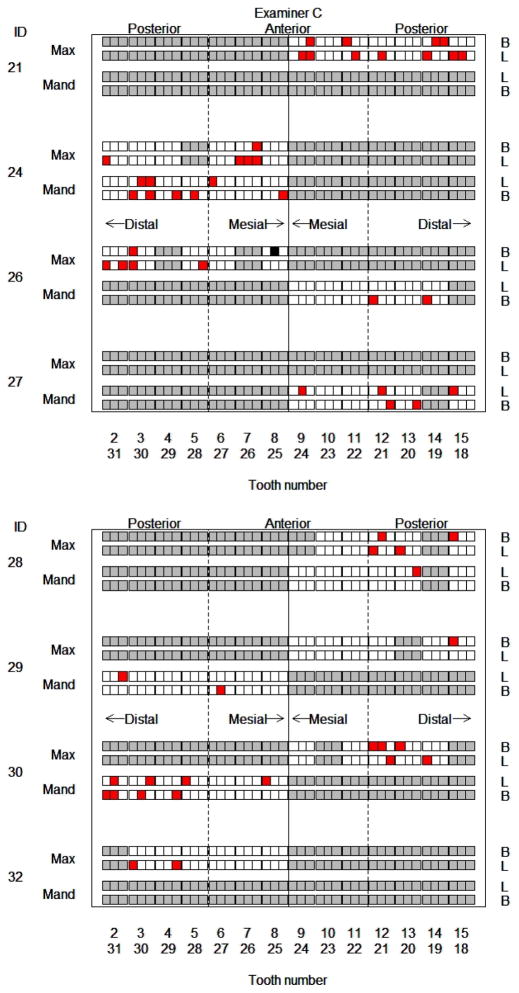
Figure 4 shows the subgroup assignments for each site probed by examiner C. Recall this examiner exhibits a negative bias overall, but anterior sites occur more often in subgroup 2, for which a positive bias is more likely, than subgroup 1 (49% versus 24%, p = 0.05). Thus, similar to examiner A, further attention to anterior teeth may reduce probing depth bias for examiner C. The graphic analogous to Fig. 3 for examiner B (not shown) reveals that all sites in the nonmajority subgroup are positioned mid-tooth and had recorded probing depths of 0 mm, a systematic behavior of potential concern.
Figure 4.
Graphical depiction of subgroup assignments of periodontal sites for examiner C. Each small square corresponds to one probing site. The color of the site denotes subgroup assignment: White = subgroup 1, red = subgroup 2; black indicates the singleton class; and gray sites were not probed by this examiner. Site location is indicated as Max = maxillary jaw, Mand = mandibular jaw, B = buccal, L = lingual, with the relative location of the square further indicating mesial/distal.
Subgroup assignment of the sites also may be correlated with the posterior estimates of true pocket depth available from the model. For example, a deeper site was more likely to be in subgroup 2 for examiner C (p = 0.001), the subgroup for which a positive bias was more frequent.
Discussion
The Bayesian hierarchical model presented in equations (1)–(3) extends traditional analyses of periodontal calibration study data by enabling discovery of subgroups of sites for which examiners exhibit consistent bias relative to truth. Our use of the DPP for the examiner site-specific bias terms, βE,ij , facilitates partitioning these bias effects into these subgroups of distinct behavior.
Traditional analyses of examiner calibration data provide agreement indices (e.g. percent agreement within one millimeter or kappa statistics) derived from subsets of the data formed by each examiner pairing. Such approaches, besides losing efficiency by subsetting the data, do not readily facilitate exploration of examiner biases that degrade agreement and, especially, associations of these biases with possible explanatory factors. Hill et al. (2006) use cluster-adjusted regression of site-level agreement measures on examiner and site characteristics, which, while permitting evaluation of these prespecified associations, does not enable unsupervised discovery of subgroups of sites according to levels of examiner agreement.
While discovery of these subgroups has been the focus of this manuscript, our model has three additional important advantages for assessing examiner agreement over analyses based on subsetting data by examiner pair. First, the model naturally accommodates the multiple levels of clustering present in calibration data: among measurements obtained from the same subject (through the random effects REi) and among duplicate measurements on the same site (through the true pocket depth). Second, the hierarchical structure enables borrowing of strength, through which information from all probing measurements contributes to inference on the agreement for any examiner pair, thereby increasing precision. The posterior predictive distribution incorporates information from all the data, enabling sites probed by the examiner pairs AB and BC to inform agreement between examiners A and C. Third, the model permits estimation of the true pocket depth and so accommodates evaluation of examiner agreement with truth.
Our analysis of the pilot periodontal calibration data identified 3, 2 and 2 bias behavior subgroups for the periodontal sites, for examiners A, B and C, respectively. Examiners A and C had bias significantly associated with tooth and site location, and Examiner C’s bias was additionally associated with the true depth of the pocket. Moreover we noted a systematic behavior of recording a probing depth of 0 mm for mid-tooth sites by examiner B. Thus our analysis facilitates identification of characteristics of the tooth, site and other factors (potentially characteristics of the examiner, such as handedness and prior experience) that are associated with poor or excellent agreement with a standard examiner. This knowledge would provide guidance for improving agreement in ongoing training and calibration, and hence be extremely valuable for improving the quality of oral epidemiologic periodontal research.
Acknowledgments
This investigation was supported in part by National Institutes of Health grants P20RR17696, U24DE16508, K25DE016863, R01DE16353, and R03DE020114. Additional support was provided by the MUSC Division of Biostatistics and Epidemiology and the MUSC Hollings Cancer Center. The authors thank the South Carolina Center for Oral Health Research for providing the data, and especially the clinical investigators Jyotika Fernandes, MD and Carlos Salinas, DMD. They also thank Sara Grossi, DDS, MS, Lisa Summerlin, RDH, Pemra Hudson, RDH, and Elizabeth Reid, RDH, for data collection, and Wenle Zhou, PhD for data management, and are grateful for the 9 calibration subjects’ participation.
Contributor Information
Elizabeth H. Slate, Email: slate@stat.fsu.edu, Department of Statistics, Florida State University, Tallahassee, FL 32306, USA. Tel.: 850-644-3218, Fax: 850-644-5271
Elizabeth G. Hill, Division of Biostatistics and Epidemiology, Medical University of South Carolina, Charleston, SC 29425
References
- 1.Chattopadhyay A. Oral Health Epidemiology: Principles and Practice. Boston: Jones and Bartlett Publishers; 2011. [Google Scholar]
- 2.Kingman A, Albandar JM. Methodological aspects of epidemiological studies of periodontal diseases. Periodontol 2000. 2002;29:11–30. doi: 10.1034/j.1600-0757.2002.290102.x. [DOI] [PubMed] [Google Scholar]
- 3.Kingman A, Loe H, Anerud A, Boysen H. Errors in measuring parameters associated with periodontal health and disease. J Periodontol. 1991;62:477–486. doi: 10.1902/jop.1991.62.8.477. [DOI] [PubMed] [Google Scholar]
- 4.Pihlstrom B. Issues in the evaluation of clinical trials of periodontitis: a clinical perspective. J Periodontal Res. 1992;27:433–441. doi: 10.1111/j.1600-0765.1992.tb01710.x. [DOI] [PubMed] [Google Scholar]
- 5.Polson AM. The research team, calibration, and quality assurance in clinical trials in periodontics. Ann Periodontol. 1997;2:75–82. doi: 10.1902/annals.1997.2.1.75. [DOI] [PubMed] [Google Scholar]
- 6.Fleiss JL. Design and Analysis of Clinical Experiments. New York: John Wiley & Sons, Inc; 1986. pp. 1–32. [Google Scholar]
- 7.Blomqvist N. On the choice of computational unit in statistical analysis. J Clin Periodontol. 1985;12:873–876. doi: 10.1111/j.1600-051x.1985.tb01365.x. [DOI] [PubMed] [Google Scholar]
- 8.Fleiss JL, Wallenstein S, Chilton NW, Goodson JM. A re-examination of within-mouth correlations of attachment level and of change in attachment level. J Clin Periodontol. 1988;15:411–414. doi: 10.1111/j.1600-051x.1988.tb01594.x. [DOI] [PubMed] [Google Scholar]
- 9.Hoberman D. Periodontal sites or patients as the experimental unit. J Periodontal Res. 1992;27:417–419. doi: 10.1111/j.1600-0765.1992.tb01707.x. [DOI] [PubMed] [Google Scholar]
- 10.Imrey PB. Considerations in the statistical analysis of clinical trials in periodontitis. J Clin Periodontol. 1986;13:517–532. doi: 10.1111/j.1600-051x.1986.tb01500.x. [DOI] [PubMed] [Google Scholar]
- 11.Laster LL. The effect of subsampling sites within patients. J Periodontal Res. 1985;20:91–96. doi: 10.1111/j.1600-0765.1985.tb00415.x. [DOI] [PubMed] [Google Scholar]
- 12.Hill EG, Slate EH, Wiegand RE, Grossi SG, Salinas CF. Study design for calibration of clinical examiners measuring periodontal parameters. J Periodontol. 2006;77:1129–1141. doi: 10.1902/jop.2006.050395. [DOI] [PubMed] [Google Scholar]
- 13.Lunn DJ, Thomas A, Best N, Spiegelhalter D. Winbugs - a Bayesian modelling framework: Concepts, structure and extensibility. Statistics and Computing. 2000;10:325–337. [Google Scholar]
- 14.Congdon P. Bayesian Statistical Modeling. Chichester: John Wiley & Sons; 2001. [Google Scholar]
- 15.Brooks SP, Gelman A. Alternative methods for monitoring convergence of iterative simulations. Journal of Computational and Graphical Statistics. 1998;7:434–455. [Google Scholar]
- 16.Celeux G, Forbes F, Robert CP, Titterington DM. Deviance information criteria for missing data models. Bayesian Analysis. 2006;1:651–674. [Google Scholar]
- 17.Dahl D, Do K-M, Müller P, Vannucci M. Bayesian inference for gene expression and proteomics. Cambridge University Press; 2006. Model-based clustering for expression data via a Dirichlet process mixture model; pp. 201–218. [Google Scholar]


