Abstract
Under specific stress treatments (cold, starvation), in vitro microspores can be induced to deviate from their gametophytic development and switch to embryogenesis, forming haploid embryos and homozygous breeding lines in a short period of time. The inductive stress produces reactive oxygen species (ROS) and nitric oxide (NO), signalling molecules mediating cellular responses, and cell death, modifying the embryogenic microspore response and therefore, the efficiency of the process. This work analysed cell death, caspase 3-like activity, and ROS and NO production (using fluorescence probes and confocal analysis) after inductive stress in barley microspore cultures and embryogenic suspension cultures, as an in vitro system which permitted easy handling for comparison. There was an increase in caspase 3-like activity and cell death after stress treatment in microspore and suspension cultures, while ROS increased in non-induced microspores and suspension cultures. Treatments of the cultures with a caspase 3 inhibitor, DEVD-CHO, significantly reduced the cell death percentages. Stress-treated embryogenic suspension cultures exhibited high NO signals and cell death, while treatment with S-nitrosoglutathione (NO donor) in control suspension cultures resulted in even higher cell death. In contrast, in microspore cultures, NO production was detected after stress, and, in the case of 4-day microspore cultures, in embryogenic microspores accompanying the initiation of cell divisions. Subsequent treatments of stress-treated microspore cultures with ROS and NO scavengers resulted in a decreasing cell death during the early stages, but later they produced a delay in embryo development as well as a decrease in the percentage of embryogenesis in microspores. Results showed that the ROS increase was involved in the stress-induced programmed cell death occurring at early stages in both non-induced microspores and embryogenic suspension cultures; whereas NO played a dual role after stress in the two in vitro systems, one involved in programmed cell death in embryogenic suspension cultures and the other in the initiation of cell division leading to embryogenesis in reprogrammed microspores.
Keywords: Abiotic stress, barley, caspase 3-like, embryogenic suspension cultures, microspore cultures, microspore embryogenesis, nitric oxide, programmed cell death, reactive oxygen species
Introduction
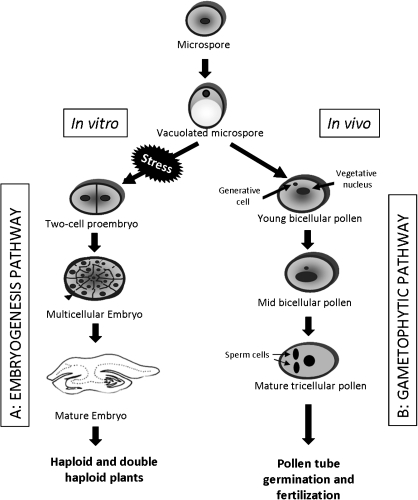
Embryogenesis is a process that can be initiated in a fertilized egg cell, somatic cells and cells of the haploid generation, like microspores. The physiological pollen development programme involves the establishment of cell polarity (Petricka et al., 2009) in the microspore, followed by its asymmetrical division, giving rise to two cells, the vegetative and generative one, with different nuclear organization, cell cycle progression, gene activity, and fate (González-Melendi et al., 2000; Testillano et al., 2004). Under in vitro conditions and by means of specific inductive stress treatments, such as cold or starvation, microspores can be induced to switch their developmental pathway from gametophytic to embryogenic, resulting in the formation of haploid embryos (Prem D, Solís MT, Risueño MC, Testillano PS, unpublished data). This process produces completely homozygous breeding lines in a much shorter time than by conventional plant breeding methods. The two developmental pathways of the microspores are schematized in Fig. 1. Stress treatments are necessary to produce the embryogenic response of microspores (Touraev et al., 1996; Maraschin et al., 2005). Cold treatment (González-Melendi et al., 2005; Oleszczuk et al., 2006), heat shock (Segui-Simarro et al., 2003; Bárány et al., 2010), starvation (Touraev et al., 1996), treatments with oligosaccharides (Lemonnier-Le Penhuizic et al., 2001), antimicrotubular drugs such as colchicine (Smykal and Pechan, 2000), ethanol and gamma irradiation (Pechan and Keller, 1989), and chemicals (Liu et al., 2002), have been reported to reprogramme the gametophytic pathway in different plant species. In barley, microspore embryogenesis has been induced in anther and microspore cultures. Cold and starvation are the two most common stress treatments that have been used in barley (Joähne-Gärtner and Lörz, 1999; Kasha et al., 2001; Ritala et al., 2001; Coronado et al., 2005; González-Melendi et al., 2005). It has been demonstrated that optimization of the preculture and culture conditions is essential to successfully induce microspores to switch to the embryogenic pattern of development (Jähne and Lörz, 1995; Touraev et al., 1997); however, the response to inductive stress is also a key step.
Fig. 1.
Embryogenic and gametophytic developmental pathways of the microspore. Scheme representing the main stages of the two developmental pathways that the microspore can undergo. (A) Embryogenic pathway: by stress treatment in vitro, the vacuolated microspore is reprogrammed and follows an embryogenic pathway forming embryos that further regenerate haploid and double-haploid plants. (B) Gametophytic pathway: in vivo, the microspore undergoes the gametophytic development leading to mature pollen which further germinates and carries out fertilization.
It is known that different external factors can trigger cell death, such as heat shock, viruses, protein synthesis inhibition, oxidative stress, hypoxia, or nitric oxide (Leist, 1997). In isolated microspore cultures, there are different cell responses after stress treatment. Some microspores are reprogrammed and enter the embryogenic pathway; others are stopped in their gametophytic development, and many others die (Satpute et al., 2005). For this reason, one of the important events affecting the efficiency of the process is the level of cell death during the early culture stages. The stress treatment applied to microspores is one of the first factors that could trigger cell death in part of the population of microspores in a culture, thereby compromising the yield of microspore embryogenic cultures.
Reactive oxygen species (ROS) and nitric oxide (NO) are well established as signalling molecules, mediating a wide range of cellular responses. Plant cells actively produce ROS at low levels, but many stresses that disrupt cell homeostasis enhance ROS production. ROS act as signalling molecules to control processes such as programmed cell death (PCD) and stress response (Mittler, 2002) There are numerous examples of ROS being involved in the modulation of biological responses, including hormone signalling involving growth and development, the cell cycle, and stress, and defence responses as well as PCD (Apel and Hirt, 2004; Gechev et al., 2006; Kwak et al., 2006; Laloi et al., 2004; Mittler et al., 2004, 2011; Fortes et al., 2011). Such a dual function of ROS requires precise and efficient control over ROS production and scavenging (Mittler et al., 2004, 2011).
NO is an important second messenger in animal cells (Chung et al., 2001) and plant cells (Beligni and Lamattina, 2001; Wendehenne et al., 2001). NO is also known to act as a signalling intermediate in a variety of responses, e.g. stomatal guard cell closure, disease resistance, and abiotic stresses, as well as during plant development (Delledonne, 2005; Neill et al., 2008; Kasprowicz et al., 2009). NO can react with a variety of intracellular and extracellular targets, and in some cases these interactions are cytotoxic and result in cell death. NO can also act as an antioxidant and an antiapoptotic modulator that prevents cell death (Chung et al., 2001). Both ROS and NO induced by the inductive stress treatment could modify the effectiveness of embryogenic microspore development, influencing both cell viability and its metabolism. The levels of stress tolerance seem to play an important role in microspore embryogenesis and may be considered as an important factor affecting the final efficiency of the process (Żur et al., 2009).
PCD is a physiological process occurring during development and is induced under pathological conditions in animal and plant cells (Jabs, 1999). Caspase-like proteases have been shown to be involved in PCD in plants, in tobacco mosaic virus-infected tobacco leaves (Korthout et al., 2000; Lam and del Pozo, 2000), in the hypertensive response of tobacco plants (Chichkova et al., 2004), and during UV- or heat shock-induced apoptosis of plant cells (Danon et al., 2004; Vacca et al., 2006).
Cell suspension cultures have been developed in different species as convenient experimental systems for analysing different aspects of plant cell physiology in isolated cells and as an interesting tool for regenerating protoplasts, transformation, and morphogenesis. In barley, embryogenic calli can be produced from immature embryos (Lührs and Lörz, 1988) and embryogenic suspension cultures have been established from embryogenic calli (Jähne et al., 1991) that are able to regenerate plants (Jähne et al., 1991). In the present work, barley embryogenic suspension cultures have been obtained from embryogenic calli originating from immature zygotic embryos.
This study analysed the primary cell response after stress-induced microspore embryogenesis in barley, focusing on NO and ROS production and cell death occurrence and the possible cross-talk between them. Also, for comparison purposes, NO and ROS production and cell death response to inductive stress have been analysed in embryogenic suspension cultures of barley, as models of isolated cells in in vitro systems.
Materials and methods
Plant material and growth conditions
Winter barley cultivars, Hordeum vulgare L. cv. Igri (Dr L Cistué, Aula Dei, CSIC, Spain) were used as donor plants. Seeds were germinated in soil for 1 month at 4 °C. After that, they were grown at 12 °C with a 12/12 light/dark cycle (10,000–16,000 lx) for 1 month in a Sanyo growth chamber (relative humidity about 70%), and then in a greenhouse under a controlled temperature of 18 °C.
Microspore isolation and culture
Spikes containing microspores at the vacuolated stage were collected and surface sterilized by immersion in bleach at 5% for 20 min, followed by 3–4 washes with sterile distilled water. The sterilized spikes were then pre-treated at 4 °C for 23–24 days to stimulate embryogenic development. To isolate the microspores, the spikes were blended in 20 ml of pre-cooled 0.4 M mannitol using a Waring Blender (Eberbach, Ann Arbor, MI/ USA) pre-cooled in a refrigerator, and the extract was filtered through a 100-μm nylon mesh (Wilson, Nottingham, UK) into a vessel at 4 °C. The pollen suspension collected was transferred into a 50-ml tube and centrifuged at 100 g for 10 min at 4 °C. After removing the supernatant, the pellet was resuspended in 8 ml of ice-cold 0.55 M maltose. This volume was distributed between two 15-ml tubes and each aliquot cautiously overlayered with 1.5 ml of mannitol solution. After gradient centrifugation at 100 g for 10 min at 4 °C, the interphase band consisting of an almost pure population of vacuolated microspores was resuspended in mannitol solution giving a final volume of 20 ml (González-Melendi et al., 2005). The pelleted microspores were diluted in an appropriate volume of KBP medium (Kumlehn et al., 2006) to obtain a cell density of 1.1 × 10⁻⁵. The microspores were incubated at 25 °C in the dark.
Embryogenic suspension culture
Cell suspension cultures were obtained from embryogenic calli generated from immature zygotic embryo cultures (Lührs and Lörz, 1988; Jähne et al., 1991). The seeds were surface sterilized with 5% bleach for 10 min and washed three times with sterile distilled water. For the callus induction, seeds were cultured in Petri dishes containing wet Whatman filter paper discs and stored in the dark at 25 °C. After a 1-day incubation period, the seeds were surface sterilized again, the immature embryos were dissected with a scalpel and 15 dissected immature embryos were placed in a 9-cm diameter Petri dish with the scutellum side up in the induction medium and stored at 25 °C in darkness. The induction medium used contained MS (Murashige and Skoog, 1962) basal medium supplemented with 50 mg/l of glutamine, 60 g/l maltose, and 2 mg /l 2,4-dichlorophenoxyacetic acid. The medium pH was adjusted to pH 5.6 with KOH and filter sterilized. For the solid medium, the solutions were double-concentrated and mixed with an equal volume of double-concentrated autoclaved agar (8 g/l). After a 4-week incubation period, any embryogenic callus arising from an immature somatic embryo was removed and cultured on fresh medium. When an embryogenic callus composed of relatively small friable sectors was identified, it was transferred to a liquid medium. Cell suspension cultures were initiated by putting 2–3 g friable calli in a 100-ml Erlenmeyer flask containing 25 ml liquid medium, as previously described but without the agar, and rotary shaken at 100 rpm in darkness, where they dispersed easily. After 7 days, the original crude suspension culture contained a range of microcalli, isolated cells, and cell aggregates. The isolated cells and aggregates were subcultured in fresh medium, which was replaced every week. Suspension cultures were kept on a rotary shaker (100 rpm) at 25 °C in the dark. The medium was removed once a week and replaced with enough fresh medium to support 2–3 g fresh cells. Under specific culture conditions, new embryogenic calli and plantlets were regenerated from suspension cultures in 8–10 weeks. For the comparative analysis of the stress response between embryogenic microspore and suspension cultures, the embryogenic suspension cultures were subjected to the same stress treatments as the microspore cultures: (a) cold treatment at 4 °C for 23 days, and (b) starvation treatment, which involved changing the nutrient medium for the starvation medium containing a limited supply of nutrients (Joähne-Gärtner and Lörz, 1999; Coronado et al., 2005), for 6 days.
Detection of cell death and treatments with caspase 3 inhibitor
To determine changes in viability of cells, microspore and suspension cells were incubated with a 0.25% (w/v) aqueous solution of Evans Blue (RomeroPuertas, 2004) for 30 min, observed with a light microscope, and the number of dead (stained by Evans Blue) and live (unstained by Evans Blue) cells from three different experiments were quantified. To study the possible role of NO in cell death induction, the samples were incubated with 200 μM S-nitrosoglutathione (GSNO), a NO donor, for 2 days and the proportion of dead cells induced by the treatment was calculated.
To evaluate the effect of caspase 3, a key enzymatic effector of PCD, on cell death after stress, treatments with N-acetyl-L-α-aspartyl-L-α-glutamyl-N-(2-carboxyl-1-formylethyl)-L-valinamide (Ac-DEVD-CHO), a specific inhibitor of caspase 3, were performed on microspore and suspension cultures. 20 μM Ac-DEVD-CHO was added at the initiation of the cultures in stress-treated microspore and suspension cultures. Evans Blue staining and quantification of cell deaths were carried out after the stress and in 4-day microspore cultures containing the inhibitor and control cultures. Assays were performed on 3 independent samples and measured in duplicate. P-values were calculated using the Duncan test.
Cryoprocessing for light microscopy
Freshly isolated microspores and microspore-derived pro-embryos from different culture times were collected and fixed for microscopy studies. Fixation was performed overnight at 4 °C with a solution of 4% paraformaldehyde in 15% saccharose in phosphate-buffered saline (PBS). The samples were stored until use in 0.1% paraformaldehyde in saccharose 15% at the same temperature. After washing in PBS, samples were dehydrated through a methanol series by progressive lowering of temperature from 0 °C to –30 °C. Then the samples were infiltrated and embedded in Lowicryl K4M resin at –30 °C under UV irradiation in an AFS automatic device (Leica, Vienna). Semithin sections were cut using the ultramicrotome (Ultracut E Reichert), collected on slides and stained with toluidine blue for general structure observation under light microscopy.
ROS and NO detection by confocal microscopy
Fresh culture samples at different stages were incubated for 1 h at 25 °C, in the dark, with 10 μM 4,5-diaminoflorescein diacetate (DAF-2DA, Calbiochem) prepared in 10 mM Tris-HCl (pH 7.4) for NO detection. Superoxide radicals were detected by using 10 μM dihydroethidium (DHE), and H2O2 was observed by using 25 μM 2′,7′-dichlorofluorescein diacetate (DCF-DA) (Rodriguez-Serrano et al., 2009). As a negative control, samples were incubated for 1 h before the fluorochromes with the NO scavenger 2-4-carboxyphenyl-4,4,5,5-tetramethylimidazoline-1-oxyl -3-oxide (cPTIO, 200 μM) and the ROS scavengers 4 mM Cl2Mn (O2.− scavenger) and 1 mM ascorbate (H2O2 scavenger). As NO donors, the samples were incubated with 200 μM of GSNO, subsequently washed twice in the same buffer for 15 min each and then placed onto a slide with 50% glycerol in PBS. The samples were observed with a confocal laser scanning microscope (Leica TCS SP5). Both the DAF-2DA signal (excitation at 495 nm; emission at 515 nm for DAF-2DA) and the DCF-DA signal (485 nm excitation; 530 nm emission) were captured as green fluorescence. The DHE signal was captured as red fluorescence (490 nm excitation; 520 nm emission). Fluorescence intensity quantification was performed on all cells emitting high and low fluorescence, using all the cell populations in each culture sample. Random samples of over 200 cells per culture were measured, repeating the experiment at least three times.
Caspase enzymatic activity
Caspase 3-like activity was analysed in cell suspensions and isolated microspore cultures, using the Caspase 3 Assay Kit, Colorimetric (CASP3C, Sigma Aldrich), based on the hydrolysis of the peptide substrate acetyl-Asp-Glu-Val-Asp p-nitroanilide (Ac-DEVD-pNA) by caspase 3, which results in the release of the p-nitroaniline (pNA) moiety. Duplicate samples were incubated in parallel in the presence of a 20 μM caspase 3 inhibitor, Ac-DEVD-CHO. All assays were performed on three independent samples, measured in duplicate, and P-values were calculated using the Duncan test.
Treatments of microspore cultures with ROS and NO scavengers
To evaluate the elimination effect of ROS and NO on microspore cultures, treatments with specific scavengers were carried out. The following components were added to independent stress-treated microspore cultures: 4 mM Cl2Mn (O2.− scavenger), 1 mM ascorbate (H2O2 scavenger), and 200 mM cPTIO (NO scavenger). To evaluate the effect of ROS and NO inhibition on cell death, Evans Blue staining and quantification of dead cells were performed as previously explained in 4-day cultures treated with the scavengers. To evaluate the effect of ROS and NO scavenging on embryogenesis, treated and control microspore cultures were observed after 20 days and the percentage of embryogenesis was calculated by quantification of non-responding microspores and developing embryo structures. All assays were performed on three independent samples and measured in duplicate. P-values were calculated using the Duncan test.
Results
Cold stress treatment efficiently induced embryogenesis in isolated barley microspore cultures
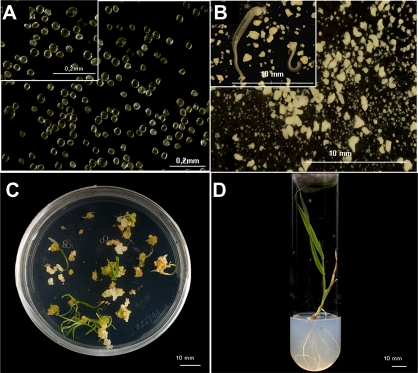
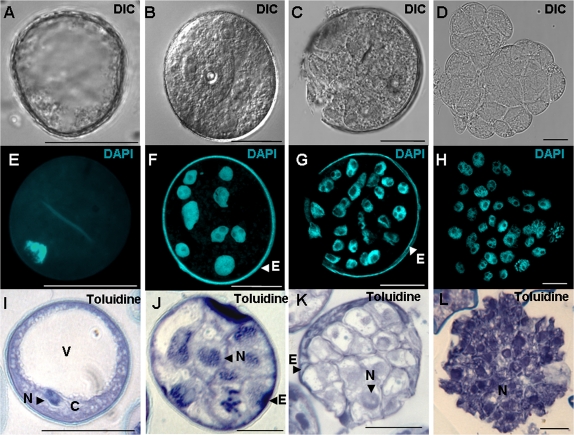
Stress treatment of in vitro cultures of isolated microspores (Fig. 2A) can induce them to generate embryos that germinate and produce haploid and double-haploid plants. Four days after the cold stress treatment, cultures yielded multi-nuclear structures or pro-embryos which proceeded to develop into embryos in the following 28 days (Fig. 2B–D). Later, 45–53-day-old embryos induced on KBP media were cultured for germination on MS medium containing 2% sucrose, gelled with 0.7% agar, and with a pH of 5.8. The embryos which were maintained at 25 °C, first in the dark for 4 days and then in the light (Fig. 2C), finally regenerated green plantlets (Fig. 2D), around 50% of which were diploid, as assessed by flow cytometry using propidium iodide staining of isolated nuclei (Wilkinson et al., 2000). To investigate the developmental pathways by which cold treatment induces microspore embryogenesis in barley, the present study studied the number and morphology of nuclei using DNA condensation as a marker to distinguish cells with vegetative and generative origins (Sunderland et al., 1979; Testillano et al., 2004) by analysing squash preparations of microspores in cultures stained with 4′,6-diamidino-2-phenylindole under fluorescence and phase contrast microscopy, as well as by staining semi-thin sections with toluidine blue. The spikes selected to start the cultures mostly contained vacuolated microspores which are characterized by a large vacuole (Fig. 3A,E,I). After the cold stress pre-treatment (spikes kept for 23 days at 4 °C) to induce embryogenesis, the microspores reprogrammed and started a new pathway. During the cold treatment, the first mitotic division produced two equal nuclei. After 4 days in culture (Fig. 3B,F,J) pro-embryos with up to 10 nuclei could be observed. Later, subsequent divisions produced multicellular embryos with exine (Fig. 3C,G,K) which finally broke, yielding the embryos (Fig. 3D,H,L) which would give rise to haploid and double-haploid plants.
Fig. 2.
Stress-induced embryogenesis in isolated barley microspore cultures and plantlet regeneration. (A) Isolated microspores at culture initiation. (B) Microspore-derived embryos after 28 days in culture. (C) Germination of microspore-derived embryos. (D) Regenerated plantlet in solid MS medium. Bars, 0.2 mm (A), 10 mm (B–D). (This figure is available in colour at JXB online.)
Fig. 3.
Cellular monitoring at early stages of barley microspore embryogenesis. (A,E,I) Vacuolated microspores at culture inititation. (B,F,J) Pro-embryo after 4 days in culture surrounded by the microspore wall, the exine. (C,G,K) Multicellular pro-embryos after 10 days in culture, with broken exine. (D,H,L) Multicellular embryo without exine after 15 days in culture. Squash preparations observed by differential interference contrast microscopy (DIC, A–D), after 4′,6-diamidino-2-phenylindole staining to reveal nuclei (DAPI, E–H), and semi-thin sections stained with toluidine blue for general structural analysis (Toluidine, I–L). C, cytoplasm; E, exine; N, nucleus; V, vacuole. Bars, 20 μm. (This figure is available in colour at JXB online.)
Cell death and caspase 3-like activity increased after inductive stress in microspore cultures and decreased by treatments with caspase 3 inhibitors
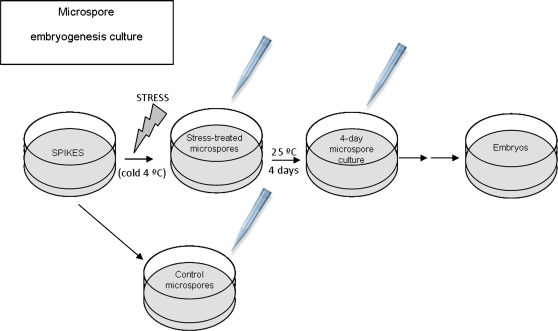
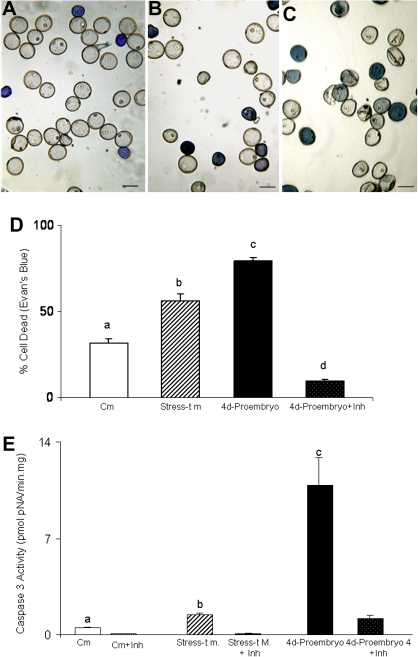
This study analysed the proportion of cell deaths in the microspore cultures by using Evans Blue staining, which preferentially reveals dead cells. For the analysis, three different stages in the experiment were chosen (Fig. 4): (a) control microspores not subjected to the stress treatment (control microspore, i.e. vacuolated microspore stage) (Fig. 5A); (b) microspores immediately after stress treatment (stress-treated microspore; 23 days at 4 °C) (Fig. 5B); and (c) 4 days after stress application (4-day-pro-embryos) (Fig. 5C). The microscopic images and the quantification of the results showed low cell death levels in control microspores (Fig. 5A,D). The dead microspores in this stage were probably due to either the stress caused in the isolation process or because of the presence of some cells that had previously died in the spike. The proportion of dead cells increased after the cold treatment (stress-treated microspore) (Fig. 5B,D) and reached high levels after 4 days in culture (4-day-pro-embryos) (Fig. 5C,D). When treatment with Ac-DEVD-CHO, a specific inhibitor of caspase 3, was performed on stress-treated microspore cultures, the percentage of dead cells significantly decreased in the 4-day cultures (Fig. 5D), suggesting the implication of caspase 3-like activity on the pathway.
Fig. 4.
Scheme of microspore embryogenesis culture and collection of samples for analysis. Micropipette tips point to the three stages of sample collection: control microspores, stress-treated microspores, and 4-day microspore culture.
Fig. 5.
Cell death and caspase 3-like activity in barley microspore cultures. (A–C) Evans Blue staining revealing dead microspores as blue cells: (A) control microspores, before the stress treatment; (B) stress-treated microspores; (C) microspore culture 4 days after stress; bars, 20 μm. (D) Histogram showing the percentage of dead cells identified by Evans Blue staining, in control microspores (Cm) and the three stages illustrated in the micrographs. (E) Caspase 3-like activity in the three stages, with the caspase 3 inhibitors (+Inh) as negative controls. Stress-t m, stress-treated microspores. Letters indicate significant differences at P < 0.05 according to Duncan’s multiple-range test. (This figure is available in colour at JXB online.)
To study what type of cell death took place in the cultures, caspase 3 activity in the three experimental stages was analysed (Fig. 5E). The quantification results of caspase 3 activity followed a similar pattern to that of the proportion of dead cells detected by Evans Blue staining. Low caspase 3 activity was observed in the control microspores but increased after stress treatment. The highest levels of caspase 3-activity were detected at the end of the 4-day stage, where a characteristic PCD had been reported in the transition from multicellular structures to globular embryos in barley (Maraschin et al., 2005). Controls of the enzymatic assay were carried out by using the caspase 3 inhibitor (Ac-DEVD-CHO), resulting in almost null levels of activity in the culture in all the stages analysed (Fig. 5E).
Endogenous NO and ROS increased after inductive stress in microspore cultures
ROS and NO production in the culture was analysed during the same three stages (Fig. 4): (a) control microspores, not subjected to the stress treatment (control microspores); (b) immediately after stress treatment (stress-treated microspores); and (c) 4 days after stress treatment (4-day-pro-embryos) (Fig. 6 and 7). Specific fluorescence probes and observations were performed by confocal laser scanning microscopy.
Fig. 6.
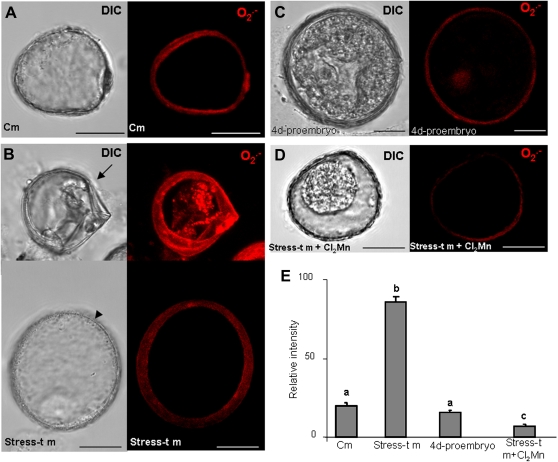
Imaging of O2.− production in barley microspore cultures with a dihydroethidium (DHE)-specific probe and confocal analysis. (A–D) Micrographs showing the differential interference contrast microscopy (DIC) image and the O2.− -dependent DHE fluorescence in red (maximum projection of several optical sections): (A) control microspore with no signal for O2.− ; (B) stress-treated microspores: in the upper image, a small cell with contracted cytoplasm, typically a non-embryogenic cell (arrow), with high O2.− fluorescence; in the lower image, a bigger rounded cell, typically an embryogenic microspore (arrowhead), with no O2.− signal; (C) 4-day pro-embryo, negative to O2.− fluorescence; (D) negative control in stress-treated microspores after incubation with Cl2Mn (O2.− scavenger); bars, 15 μm. (E) Histogram showing the relative fluorescence intensities of control microspores (Cm) and the three stages illustrated in the micrographs. Stress-t m, stress-treated microspores. Letters indicate significant differences at P < 0.05 according to Duncan’s multiple-range test. (This figure is available in colour at JXB online.)
Fig. 7.
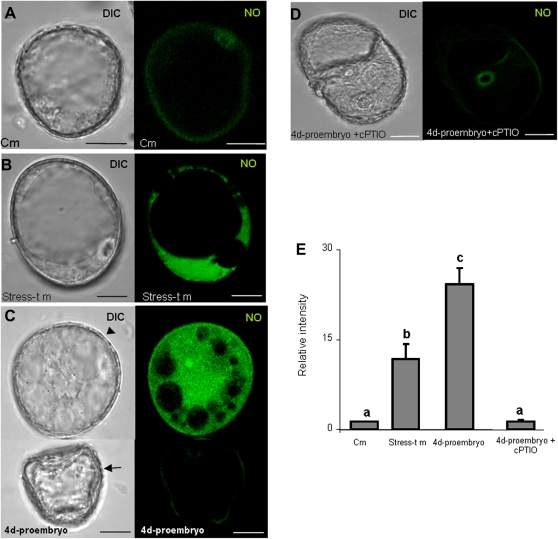
Imaging of NO production in barley microspore cultures with 4,5-diaminoflorescein diacetate (DAF-2DA)-specific probe and confocal analysis. (A–D) Micrographs showing the differential interference contrast microscopy (DIC) image and the NO-dependent DAF-2DA fluorescence in green (maximum projection of several optical sections): (A) control microspore with no signal for NO; (B) stress-treated microspore with a rounded shape and big size corresponding to an embryogenic microspore, showing NO fluorescence signal in cytoplasm, the large vacuole appears negative; (C) microspores after 4 days in culture: in the upper image a bigger rounded cell, typically a 4-day embryogenic microspore or pro-embryo (arrowhead), with high NO signal; in the lower image, a smaller cell with contracted cytoplasm, typically a non-embryogenic cell (arrow), showing no NO fluorescence; (D) negative control in 4-day-pro-embryo after incubation with cPTIO, NO scavenger; bars, 15 μm; (E) histogram showing the relative fluorescence intensities for the control (Cm) and the three stages illustrated in the micrographs. Stress-t m, stress-treated microspores. Letters indicate significant differences at P < 0.05 according to Duncan’s multiple-range test.
DHE was used to visualize the superoxide anion (O2.−) because it specifically reacts with intracellular O2.− in vivo, resulting in a specific red fluorescent product, oxiethidium (Zhao et al., 2003). No specific fluorescent signal was detected in vacuolated microspores (Fig. 6A) nor in pro-embryos (Fig. 6C), and the faint signal observed in the exine would have been due to its unspecific autofluorescence. In stress-treated microspores, a red fluorescent signal was specifically detected in the cytoplasm of non-embryogenic cells, characterized by their smaller size (Fig. 6B, arrows) in comparison with the embryogenic ones, which appeared negative to DHE staining (Fig. 6B, arrowheads). When Cl2Mn was used as a specific scavenger, the fluorescent signal completely disappeared in those cells (Fig. 6D), indicating the specificity of the staining. The quantification of the fluorescence intensity in the three stages (Fig. 6E) supports the qualitative results observed.
The specific fluorescent probe DAF-2DA was used for NO detection. The results revealed no detectable presence of NO in control microspores (Fig. 7A). In contrast, after stress treatment the levels of fluorescence increased in microspores (Fig. 7B) and 4-day-pro-embryos (Fig. 7C), with the signals localized in the cytoplasms whereas vacuoles and nuclei appeared dark (Fig. 7B,C). There were two types of cells in the 4-day samples; some of them were small and showed a contracted cytoplasm similar to a dead cell, with no NO fluorescent signal (Fig. 7C, arrows), whereas the embryogenic cells were characterized by bigger sizes with high fluorescence signals (Fig. 7C, arrowheads). Similar results, with two-cell populations, were observed in the stress-treated microspores, where the small dead cells did not show any fluorescence but the larger embryogenic cells were positive to NO staining (Fig. 7B). These results suggested an early NO contribution in the initiation of cellular proliferation during the first stages of embryogenesis. In control experiments in which cPTIO was used as a NO scavenger, the fluorescence signal completely vanished (Fig. 7D). The quantification of the mean fluorescence intensity in the three stages (Fig. 7E) supports the qualitative results observed.
Scavenging of ROS and NO after the inductive stress reduced cell death proportion in microspore cultures
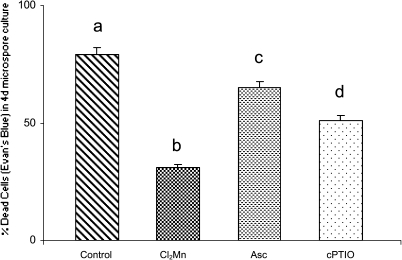
In stress-treated microspore cultures, ROS and NO increased, as well as cell death. To evaluate the effect on cell death of the elimination of these radicals on microspore cultures after the stress, treatments with specific scavengers, Cl2Mn (O2.− scavenger), ascorbate (H2O2 scavenger), and cPTIO (NO scavenger) were performed on stress-treated microspore cultures. Evans Blue staining and quantification of stained (dead) cells were carried out in 4-day cultures treated with the scavengers, Results showed significant decreasing of the percentage of dead cells in the microspore cultures treated with the three inhibitors, in comparison with a control 4-day microspore culture. The maximum effect was observed with Cl2Mn treatment which reduced the cell death percentage to less than half, while cPTIO and ascorbate treatments produced lower reductions in cell death. These results suggested that increase in ROS and NO produced after the stress in microspore cultures would be involved in leading cell death, since their reduction with specific scavengers significantly reduced the percentage of dead cells (Fig. 8).
Fig. 8.
Effect of treatments with ROS and NO scavengers on stress-induced cell death in microspore cultures. Histogram indicating the percentage of dead cells, detected by Evans Blue, in microspore cultures 4 days after the stress treatment, without scavengers (control) or with treatments with Cl2Mn (O2.− scavenger), ascorbate (Asc, H2O2 scavenger), or cPTIO (NO scavenger). Different letters indicate significant differences at P < 0.05 according to Duncan’s multiple-range test.
Scavenging of ROS and NO negatively affected microspore embryogenesis progression
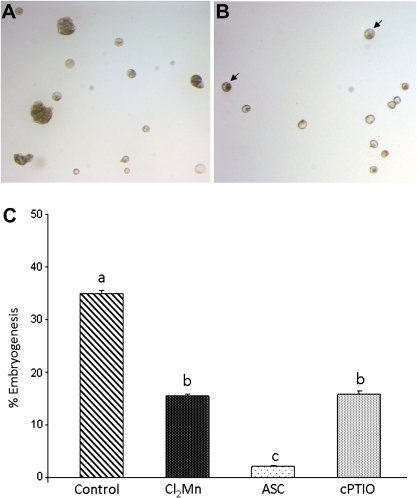
To evaluate the elimination effect of ROS and NO on microspore cultures at later stages, treatments with specific scavengers, Cl2Mn (O2.− scavenger), ascorbate (H2O2 scavenger), and cPTIO (NO scavenger) were carried out on stress-treated microspore cultures. Treated and control microspore cultures were observed after 20 days and embryogenesis progression was analysed. The percentage of embryogenesis was calculated by quantification of non-responding microspores and developing embryo structures. In control microspore cultures, multicellular microspores of different sizes and larger developing embryos were observed (Fig. 9A), as well as smaller non-embryogenic microspores. However, in microspore cultures treated with the scavengers, no large embryos were observed in the culture at the same stage, only some embryogenic and multicellular microspores characterized by their large size and density, in comparison with the small non-embryogenic microspores (Fig. 9B). This indicated that the elimination of ROS and NO produced a delay in microspore-derived embryo development. The quantification of the embryogenic and non-embryogenic structures found in control and treated cultures showed significant percentage decreases of embryogenesis in the three cultures treated with the scavengers when compared with control cultures (Fig. 9C), indicating that scavenging of ROS and NO negatively affected microspore embryogenesis progression.
Fig. 9.
Effect of treatments with ROS and NO scavengers on the percentage of microspore embryogenesis. (A) Control microspore culture at 20 days after the inductor stress treatment, micrograph showing large developing embryos (arrowheads), dense and large multicellular microspores (arrows), and small non-embryogenic microspores; bar, 50 μm. (B) Microspore culture treated with the NO scavenger, cPTIO, for 20 days after the inductor stress treatment, exhibiting some dense and large multicellular microspores (arrow) and many small non-embryogenic microspores; bar, 50 μm. (C) Histogram indicating the percentage of embryogenic structures (large embryos and multicellular microspores) in microspore cultures 20 days after the inductor stress treatment, without scavengers (control) or with treatments with Cl2Mn (O2.− scavenger), ascorbate (Asc, H2O2 scavenger), or cPTIO (NO scavenger). Different letters indicate significant differences at P < 0.05 according to Duncan’s multiple-range test. (This figure is available in colour at JXB online.)
Effect of inductive stress treatments in embryogenic suspension cultures: increases in cell death and caspase 3-like activity
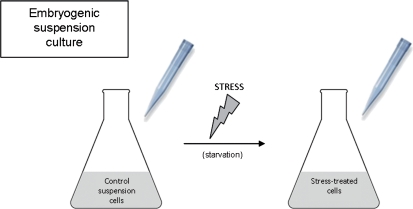
Suspension cultures are very convenient experimental systems for studying proliferating cells. In the present work, embryogenic suspension cultures of barley were prepared from embryogenic calli derived from immature zygotic embryos (Lührs and Lörz, 1988; Jähne et al., 1991). The first step in the preparation of the suspension culture involved the selection of 4-week-old friable calli which were transferred to a liquid medium and rotary shaken, where they dispersed easily. After 7 days, the original crude suspension culture contained a range of micro calli, isolated cells, and cell aggregates. The isolated cells and aggregates were subcultured in fresh media which was replaced every week. The points of collection of samples in the embryogenic suspension culture system are illustrated in Fig. 10.
Fig. 10.
Scheme of embryogenic suspension culture and collection of samples for analysis. Micropipette tips point to the two stages of sample collection: control suspension cells and stress-treated cells. (This figure is available in colour at JXB online.)
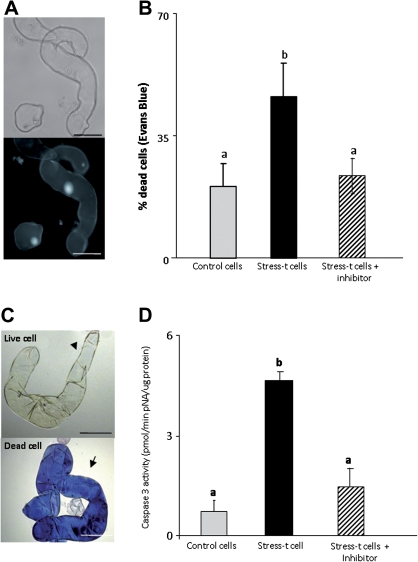
The embryogenic suspension cultures consisted of elongated cells exhibiting a small nucleus and large cytoplasm with big vacuoles (Fig. 11A). The study analysed the effects of the stress treatments used for embryogenesis induction on barley microspore cultures, such as cold stress or starvation, focusing specifically on cell death occurrence and oxidative and nitrosative damage. Application of cold stress (4 °C) to embryogenic suspension cultures resulted in the complete cell death of the culture (data not shown); for this reason, the other stress condition that also induces embryogenesis in barley microspore cultures, namely pre-culture in a starvation medium, was used (Joähne-Gärtner and Lörz, 1999; Coronado et al., 2005). The quantification of the results and the microscopic images of Evans Blue staining (Fig. 11B,C) showed low cell death levels in control cells, whereas the proportion of dead cells increased approximately 2-fold after stress treatment (stress-treated cells) (Fig. 11B). In addition, caspase 3 activity increased 4-fold in the embryogenic suspension cultures after stress treatment (Fig. 11D). The increase in cell death was accompanied by an increase in caspase 3-like activity in both culture systems, while treatments with specific caspase 3 inhibitors diminished cell death proportions. The effects of stress on increases in cell death levels and caspase 3 activity in suspension cultures were similar to those obtained in microspore cultures and suggested that PCD played an important role in the stress response of both systems.
Fig. 11.
Cell death and caspase 3-like activity in barley embryogenic suspension cultures. (A) Cells of suspension culture visualized by differential interference contrast microscopy (upper) and 4′,6-diamidino-2-phenylindole staining for DNA revealing the nuclei (lower); bar, 45 μm. (B) Histogram showing the percentage of dead cells identified by Evans Blue staining in control and stress-treated cells. (C) Evans Blue staining revealing dead cells in blue (arrow) and living cells unstained (arrowhead); bar, 45 μm. (D) Caspase 3-like activity in control and stress-treated cells, as well as in stress-treated cells with the caspase 3 inhibitor as control. Letters indicate significant differences at P < 0.05 according to Duncan’s multiple-range test (This figure is available in colour at JXB online.)
Increased NO and ROS production was detected after stress in embryogenic suspension cultures
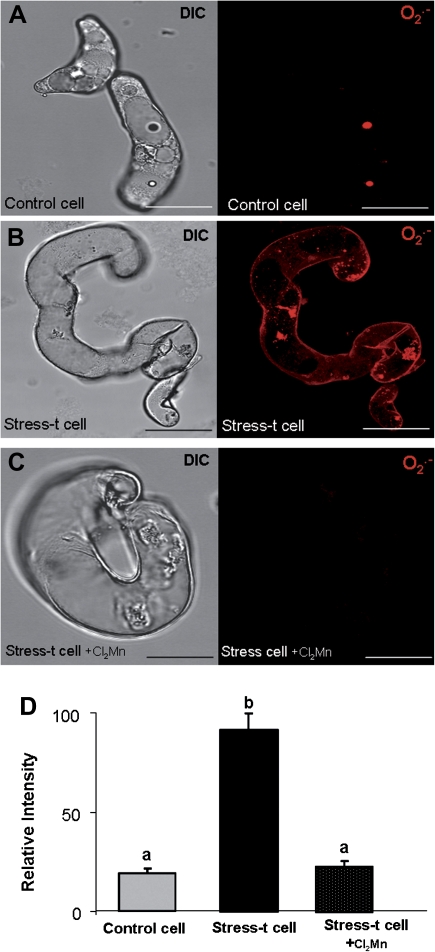
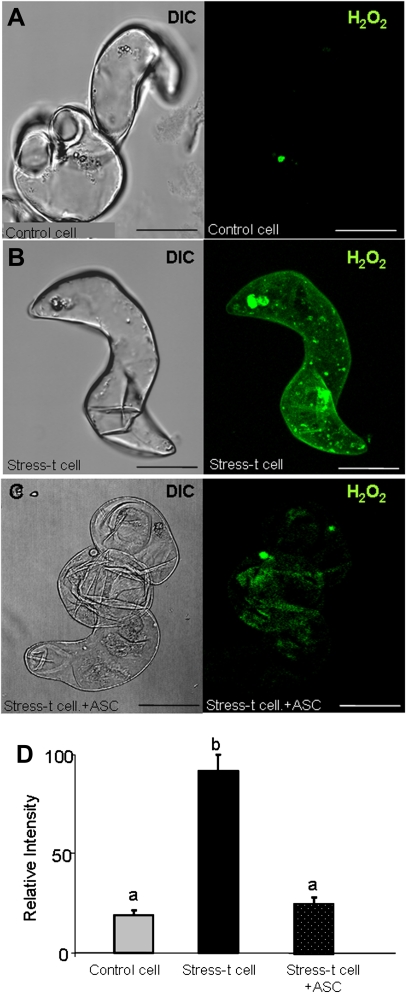
The analysis of ROS in the suspension cultures was carried out by using specific fluorescent probes for the superoxide anion (DHE) and hydrogen peroxide (DCF-DA). The red O2.− -dependent fluorescence was not observed in control cells (Fig. 12A,D), but it was observed only in the cytoplasm of stress-treated cells (Fig. 12B,D). As a negative control, when the stress-treated cells were incubated with Cl2Mn, an O2.− scavenger, the fluorescence signal disappeared completely (Fig. 12C,D). A similar labelling pattern was obtained for H2O2. The green H2O2-dependent fluorescence was not detected in control cells (Fig. 13A,D), but the signal did increase in the culture in the same stage as O2.−, in the stress-treated cells (Fig. 13B,D). When the stress-treated cells were incubated with the H2O2 scavenger (ascorbic acid) as a negative control, the fluorescence signal completely vanished (Fig. 13C,D).
Fig. 12.
Imaging of O2.− production in barley suspension cell cultures with a dihydroethidium (DHE)-specific probe and confocal analysis. (A–D) Micrographs showing the differential interference contrast microscopy (DIC) image and the O2.− -dependent DHE fluorescence in red (maximum projection of several optical sections): (A) control cells; (B) O2.− production in stress-treated cells; (C) negative control: stress-treated cells incubated with Cl2Mn, O2.− scavenger; bars, 45 μm. (D) Histogram showing relative fluorescence intensities reflecting differences between treatments. Stress-t cell, stress-treated cells. Letters indicate significant difference at P < 0.001 according to Duncan’s multiple-range test. (This figure is available in colour at JXB online.)
Fig. 13.
Imaging of H2O2 production in barley embryogenic suspension cultures with a 2′,7′-dichlorofluorescein diacetate (DCF-DA)-specific probe and confocal analysis. (A–C) Micrographs showing the differential interference contrast microscopy (DIC) image and the H2O2-dependent DCF-DA fluorescence in red (maximum projection of several optical sections): (A) control cells; (B) H2O2 production in stress-treated cells. (C) negative control: stress-treated cells incubated with ascorbate (ASC, H2O2 scavenger); bars, 45 μm. (D) Histogram showing relative fluorescence intensities reflecting differences between treatments. Stress-t cell, stress-treated cells. Letters indicate significant difference at P < 0.001 according to Duncan’s multiple-range test. (This figure is available in colour at JXB online.)
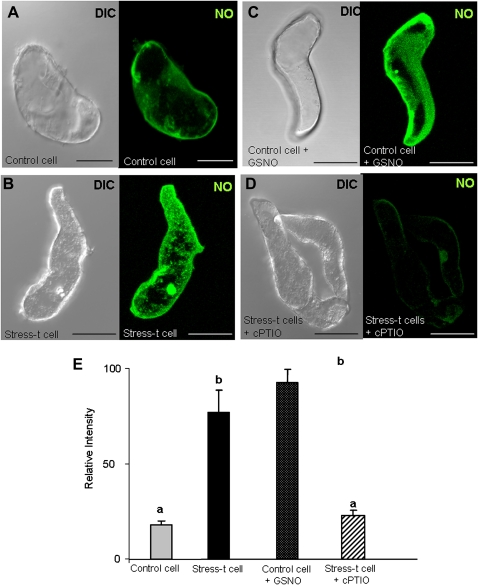
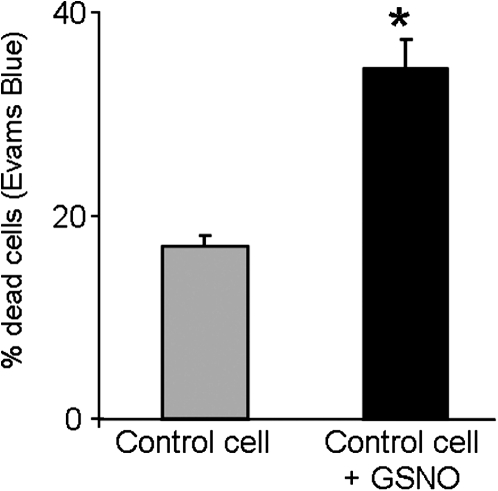
NO production, detected by a DAF-2DA-specific fluorescence probe, was not observed in control cells (Fig. 14A,E), which contrasted with the high fluorescence signal detected in the stress-treated cells (Fig. 14B,E). As a positive control for the NO staining, the control cells were incubated with an exogenous NO donor (200 μM GSNO) and an increase in green fluorescence was detected, similar to that observed in the stress-treated cells (Fig. 14C,E). However, when cPTIO, a NO scavenger, was used as a negative control, the fluorescence signal completely disappeared (Fig. 14D,E). To analyse the effect of NO on cell death, control cells were incubated for 48 h with the NO donor GSNO (200 μM in the dark) and afterwards stained with Evans Blue so as to label dead cells. An increase in the number of dead cells was observed compared with control cells (Fig. 15). These results, indicating that cell deaths increase as cellular NO increases, suggest that NO could be related to/involved in the cell death increase occurring after stress treatment (embryogenesis inductor) in the suspension cultures.
Fig. 14.
Imaging of NO production in barley embryogenic suspension cultures with 4,5-diaminoflorescein diacetate (DAF-2DA)-specific probe and confocal analysis. (A–D) Micrographs showing the differential interference contrast microscopy (DIC) image and the NO-dependent DAF-2DA fluorescence in green (maximum projection of several optical sections); (A) control cell showing a faint NO signal; (B) high NO production in stress-treated cells; (C) control cell treated with the NO donor GSNO, exhibiting a high NO signal; (D) negative control: stress-treated cells incubated with cPTIO, NO scavenger; bars, 45 μm. (E) Histogram showing relative fluorescence intensities reflecting differences between treatments. Stress-t cell, stress-treated cells. Letters indicate significant difference at P < 0.001 according to Duncan’s multiple-range test. (This figure is available in colour at JXB online.)
Fig. 15.
Quantification of cell death induced by exogenous NO in barley embryogenic suspension cultures. Histogram showing the percentage of dead cells detected by Evans Blue staining in control suspension cell cultures (control cell) and suspension cultures treated with the NO donor GSNO for 2 days. Asterisk indicates significant difference at P < 0.05 according to Duncan’s multiple-range test.
Discussion
Stress treatments that efficiently induce embryogenesis promote cell death and caspase 3-like activity
The results reported in this study illustrate the primary cell response after embryogenesis inductive stress in microspore and embryogenic barley suspension cultures.. The results, focusing on cell death occurrence, caspase 3 activity, and NO and ROS production, are summarized in Table 1. Many studies have shown that stress treatments are necessary to induce an embryogenic response of the microspore (Touraev et al., 1996; Maraschin et al., 2005). But not every cell/microspore can be reprogrammed towards embryogenesis. Other developmental pathways, including cell death and gametophytic-like pathways, have been reported to occur after stress treatments were applied to induce embryogenesis in Brassica napus microspore cultures (Satpute et al., 2005).
Table 1.
Summary of results
| Microspore cultures |
Suspension cell cultures |
||||||
| Control | Stress treated |
4-day culture |
Control | Stress treated | |||
| Non-embryogenic cell | Embryogenic cell | Non-embryogenic cell | Embryogenic cell | ||||
| Evans Blue (death) | +/– | ++ | − | +++ | − | +/– | ++ |
| Caspase 3 activity | − | + | +++ | − | ++ | ||
| Reactive oxygen species | |||||||
| O2.− | − | ++ | − | − | − | − | ++ |
| H2O2 | − | ++ | |||||
| NO | − | − | + | − | ++ | − | ++ |
PCD related to the physiological maturation of embryos has been reported during the progression of several in vitro developmental processes, such as somatic embryogenesis (Petrussa et al., 2009) and pollen embryogenesis (Maraschin et al., 2005). Nevertheless, no studies on the occurrence of early PCD events in stress-treated isolated microspore cultures and embryogenic suspension cultures have been performed.
Increasing evidence has been reported concerning apoptotic-like PCD induced by moderate biotic or abiotic stresses such as pathogen infection or heat stress, specifically in in vitro suspension cell cultures (Reape and McCabe, 2010). Apoptotic features and caspase-like activities were found in plant in vitro systems subjected to moderate stresses (Reape and McCabe, 2008, 2010). The present results have also shown an increase in dead cells immediately after stress treatment in isolated microspores and in suspension cultures. The increase in cell death was accompanied by an increase in caspase 3-like activity in both culture systems, while treatments with specific caspase 3 inhibitors diminished cell death proportions. Caspases are the key executioners of apoptosis in animal cells and belong to an evolutionarily conserved family of cysteine proteases (Green and Kroemer, 1998). Plant genomes do not contain structural homologues of caspases, but encode several related proteins with caspase-like activity, called meta-caspases, that are also present in protozoa and fungi (Uren et al., 2000). Recombinant meta-caspases from Arabidopsis are not affected by caspase inhibitors (Bonneau et al., 2008), suggesting that they are not the only enzymes responsible for the caspase-like activities observed in plants. It has been reported that meta-caspases have been developmentally regulated during embryogenesis of Norwegian spruce and in stress-induced PCD by UV or H2O2 in Arabidopsis (Reape and McCabe, 2010). Caspase-like activities in plants are required for PCD in many systems (Raff et al., 1998). Recent efforts to purify and characterize the proteases responsible for the caspase-like activities in plant cells have indicated that serine proteases and a vacuolar processing enzyme, which is a cysteine protease, might potentially account for the caspase-like activities in plant PCD (Coffeen and Wolpert, 2004; Hatsugai et al., 2004). The present results suggest that different plant proteases might be active during PCD in barley, proteases that have similar substrate and inhibitor properties as the mammalian caspase 3. Additionally, in the Arabidopsis genome there are nine meta-cascapases (AtMC), and recently it has been shown that AtMC1 requires conserved caspase-like catalytic residues for its function and is a positive regulator of cell death during hypersensitive responses, whereas AtMC2 negatively regulates cell death (Coll et al., 2010).
Microspore embryogenesis can also be induced in barley anther cultures, by starvation and osmotic stress treatments, specifically in the case of 4-day treatment with mannitol. Differential transcriptomic analysis between microspores before and after stress by mannitol revealed the differential expression of several genes, using different array platforms (Maraschin et al., 2006; Muñoz-Amatriain et al., 2009). Both of these papers reported up-regulation of genes involved in stress response (pathogenesis-related, heat-shock, and oxidative stress-related proteins) and in the inhibition of PCD (Bax inhibitor BI-1) among others, as being involved in microspore reprogramming to embryogenesis by stress (Maraschin et al., 2006; Muñoz-Amatriain et al., 2009). The present results, showing an increase in cell death associated with caspase 3-like activity, suggest that a PCD response occurs after the stress treatment triggering embryogenesis in microspore cultures. This fact opens up the possibility of interfering with this PCD programme and caspase 3-like activity by using specific inhibitors to increase cell viability, and, therefore, the embryogenic response in these in vitro systems. This strategy could be an important goal in the design of protocols for improving the embryogenesis yield.
Endogenous ROS increase after stress treatment in non-induced microspores and embryogenic suspension cultures
ROS play numerous signalling roles in all organisms and are now considered central players in the cell signalling network (Mittler et al., 2011). The endogenous production of ROS is a common feature of plant cell death in response to exogenous stimuli such as environmental biotic and abiotic stresses (Mittler, 2002; Apel and Hirt, 2004; Gao et al., 2008; Fortes et al., 2011). ROS have also been reported as key factors mediating PCD during hypersensitive reactions and heavy metal stress in plants and suspension cultures (Vranova et al., 2002). However, though there are different studies of ROS production in somatic embryogenesis (Doyle et al.,2010; Zhang et al., 2010), as far as is known there is no available data about ROS production and their involvement in PCD in isolated microspore cultures. The present work analysed ROS production in isolated barley microspore cultures and suspension cultures after stress treatments.
Among ROS, H2O2 has been established as a key player in stress and PCD responses, but little is known about the signalling pathways leading from H2O2 to PCD in plants (Gechev and Hille, 2005), though it has been shown that H2O2 could induce PCD in soybean cultures (Bhattacharjee, 2005). Exogenous treatments with ROS or antioxidants, and mutant plants with disturbed levels of ROS, support the involvement of ROS in PCD (Gechev and Hille, 2005; Zago et al., 2006; Gao et al., 2008). In plants, different signalling pathways have been proposed as the means by which ROS direct PCD (Gadjev et al., 2006; Gechev et al., 2006; Van Breusegem and Dat, 2006). One of the proposed pathways involves the mitochondria, as it has been shown that cytochrome C (CytC) and the caspase-like proteases play an important role in plant PCD, as in other biological systems (Diamond and McCabe, 2007; Bonneau et al., 2008; Reape and McCabe, 2008). The CytC release from the mitochondria disrupts the electron transport chain resulting in the generation of ROS and, presumably, activation of the caspase-like proteins (Reape and McCabe, 2010). It has been proposed that ROS production induced by stress produces signalling molecules that trigger PCD, leading to CytC release which would, in turn, generate more ROS, causing a feedback loop which would amplify the original PCD-inducing stress signal (Reape and McCabe, 2010).
ROS have been reported to be involved in PCD occurring in suspension cultures of Arabidopsis (Doyle et al., 2010), white poplar (Balestrazzi et al., 2011). and tobacco (Vacca et al., 2004; Cheng et al., 2011). The present results showed that in both embryogenic culture systems, microspores and suspension cultures, the increase in ROS production after stress treatment was accompanied by an increase in caspase 3-like activity and the proportion of cell deaths. Moreover, the scavenging of ROS after the inductive stress significantly reduced cell death proportion at early stages in microspore cultures, suggesting that the increase in ROS produced after the stress would be involved in leading to cell death. These findings demonstrate that stress treatments to induce embryogenesis also induce a rapid ROS outburst and indicate, as far as is known for the first time, that ROS play a role in the stress-triggered PCD occurring in embryogenic microspore cultures and embryogenic suspension cultures of barley. The pathway regulating this ROS-induced PCD in these plant systems remains unknown.
NO production is associated with both stress-induced PCD and embryogenesis initiation
NO is known as a signalling molecule involved in a broad spectrum of physiological processes as well as in biotic and abiotic stress responses (Delledonne, 2005; del Rio et al., 2006; Kasprowicz et al., 2009). It also acts as a developmental regulator, promoting germination, leaf extension, and root growth, but delaying leaf senescence and fruit ripening (Neill et al., 2003). NO has also been involved in promoting cell division and embryogenic cell formation (Otvos et al., 2005). The present findings showed an increase in endogenous NO production after subjecting both isolated microspore and embryogenic suspension culture systems of barley to stress treatment. In both systems, it was observed that NO production was associated with an increase in cell death and caspase 3 activity after the stress treatment. Additionally, the scavenging of NO by cPTIO in microspore cultures after the stress significantly reduced cell death proportion, suggesting that the overproduction of NO by stress would be involved in leading cell death. On the other hand, when GSNO (NO donor) was added to the control suspension cultures, the proportion of cell deaths increased, supporting the idea that NO is involved in PCD in these systems. It was found that cells of Arabidopsis suspension cultures generated high levels of NO in response to abiotic (Arnaud et al., 2006) and biotic (Clarke et al., 2000) stress and that these elevated NO levels were sufficient to induce cell death, which was characterized as a form of PCD (Clarke et al., 2000).
The parallel increases in ROS and NO production after subjecting embryogenic suspension cultures to stress suggested a possible interplay among these reactive radicals. ROS–NO cross-talk has been observed in several plant systems, in particular in relation to signalling to initiate PCD (de Pinto et al., 2002; Neill et al., 2002; Zaninotto et al., 2006). The role of ROS in PCD was described in cultured soybean cells (Levine et al., 1994) and recently in Arabidopsis (Mittler and Rizhsky, 2000; Lorrain et al., 2003), as well as in animals where H2O2 and O2.− cooperate with NO to induce PCD (Jabs, 1999; Van Breusegem and Dat, 2006). In microspore cultures, NO production also increased after stress treatments, but the microspores that exhibited a positive NO signal had a rounded morphology and bigger size, in contrast with the smaller and contracted cells which exhibited PCD features. On the other hand, later in 4-day microspore cultures, only the embryogenic cells characterized by larger sizes had high NO content. NO has been reported to stimulate the activation of cell division and embryogenic cell formation in leaf protoplast-derived cells of alfalfa in the presence of auxin (Otvos et al., 2005). The present results also suggest a NO contribution in the initiation of cell division during early embryogenesis in microspore cultures.
These results also showed that the elimination of ROS and NO by specific scavengers during later stages in microspore cultures produced significant decreases in the embryogenesis percentage, as well as a delay in microspore-derived embryo development. This fact suggests that whereas the scavenging of ROS/NO overproduction due to stress would favour cell viability and decrease cell death in the early stages following stress, the elimination of these radicals for longer periods in microspore cultures would negatively affect embryogenesis progression. This is probably because ROS/NO play important physiological roles in various signalling pathways during embryo development.
In recent years, a dual role for ROS and reactive nitrogen species has been recognized in plants (Mittler, 2002, 2004; Neill, 2005; Río and Puppo, 2009). The function of ROS is finely regulated by a balance between ROS producing and detoxifying that regulates their levels under different environmental or developmental conditions. This ROS/NO balance may be cell specific and even intracell specific (Mittler et al., 2004). The results of the present work suggest a dual function for NO after stress treatment. In a cell population in a suspension cell culture, a NO increase produced by stress would not be detoxified by intracellular mechanisms and would lead the cell to a caspase-associated PCD. In the other in vitro culture system, microspore cells responding to embryogenesis induction could compensate for the NO imbalance by being reprogrammed to embryogenesis, where new physiological NO production occurs associated with microspore division. The final question as to why some cells are able to compensate for the NO effect and others are induced to PCD is unknown. It could be related to the physiological state of the cell and, therefore, to the acquisition of embryogenic competence, a process in which the stress-induced NO have to play an essential role.
Acknowledgments
This work was supported by the Spanish Ministry of Science and Innovation (MICINN) (grant numbers BFU2008-00203, AGL2008–04255, and BFU2011-23752). MRS was the recipient of a grant from the Juan de la Cierva Programme of the Spanish MICINN for postdoctoral researchers (grant number JCI-2007-123-1177). DP was the recipient of a grant from the Spanish MICINN for foreign postdoctoral researchers to work in Spanish Research Centres (grant number SB2006-0074).
References
- Apel K, Hirt H. Reactive oxygen species: metabolism, oxidative stress, and signal transduction. Annual Review of Plant Biology. 2004;55:373–399. doi: 10.1146/annurev.arplant.55.031903.141701. [DOI] [PubMed] [Google Scholar]
- Arnaud N, Murgia I, Boucherez J, Briat JF, Cellier F, Gaymard F. An iron-induced nitric oxide burst precedes ubiquitin-dependent protein degradation for Arabidopsis AtFer1 ferritin gene expression. Journal of Biological Chemistry. 2006;281:23579–23588. doi: 10.1074/jbc.M602135200. [DOI] [PubMed] [Google Scholar]
- Balestrazzi A, Agoni V, Tava A, Avato P, Biazzi E, Raimondi E, Macovei A, Carbonera D. Cell death induction and nitric oxide biosynthesis in white poplar (Populus alba) suspension cultures exposed to alfalfa saponins. Physiologia Plantarum. 2011;141:227–238. doi: 10.1111/j.1399-3054.2010.01436.x. [DOI] [PubMed] [Google Scholar]
- Bárány I, Fadón B, Risueño MC, Testillano PS. Cell wall components and pectin esterification levels as markers of proliferation and differentiation events during pollen development and embryogenesis. Journal of Experimental Botany. 2010;61:1159–1175. doi: 10.1093/jxb/erp392. [DOI] [PMC free article] [PubMed] [Google Scholar]
- Beligni MV, Lamattina L. Nitric oxide in plants: the history is just beginning. Plant, Cell and Environment. 2001;24:267–278. [Google Scholar]
- Bhattacharjee S. Reactive oxygen species and oxidative burst: roles in stress, senescence and signal transduction in plants. Current Science. 2005;89:1113–1321. [Google Scholar]
- Bonneau L, Ge Y, Drury GE, Gallois P. What happened to plant caspases? Journal of Experimental Botany. 2008;59:491–499. doi: 10.1093/jxb/erm352. [DOI] [PubMed] [Google Scholar]
- Clarke A, Desikan R, Hurst RD, Hancock JT, Neill SJ. NO way back: nitric oxide and programmed cell death in Arabidopsis thaliana suspension cultures. The Plant Journal. 2000;24:667–677. doi: 10.1046/j.1365-313x.2000.00911.x. [DOI] [PubMed] [Google Scholar]
- Coffeen WC, Wolpert TJ. Purification and characterization of serine proteases that exhibit caspase-like activity and are associated with programmed cell death in Avena sativa. The Plant Cell. 2004;16:857–873. doi: 10.1105/tpc.017947. [DOI] [PMC free article] [PubMed] [Google Scholar]
- Coll NS, Vercammen D, Smidler A, Clover C, Van Breusegem F, Dangl JL, Epple P. Arabidopsis type i metacaspases control cell death. Science. 2010;330:1393–1397. doi: 10.1126/science.1194980. [DOI] [PubMed] [Google Scholar]
- Coronado MJ, Hensel G, Broeders S, Otto I, Kumlehn J. Immature pollen-derived doubled haploid formation in barley cv. Golden Promise as a tool for transgene recombination. Acta Physiologiae Plantarum. 2005;27:591–599. [Google Scholar]
- Cheng DD, Jia YJ, Gao HY, Zhang LT, Zhang ZS, Xue ZC, Meng QW. Characterization of the programmed cell death induced by metabolic products of Alternaria alternata in tobacco BY-2 cells. Physiologia Plantarum. 2011;141:117–129. doi: 10.1111/j.1399-3054.2010.01422.x. [DOI] [PubMed] [Google Scholar]
- Chichkova NV, Kim SH, Titova ES, Kalkum M, Morozov VS, Rubtsov YP, Kalinina NO, Taliansky ME, Vartapetian AB. A plant caspase-like protease activated during the hypersensitive response. The Plant Cell. 2004;16:157–171. doi: 10.1105/tpc.017889. [DOI] [PMC free article] [PubMed] [Google Scholar]
- Chung HT, Pae HO, Choi BM, Billiar TR, Kim YM. Nitric oxide as a bioregulator of apoptosis. Biochemical and Biophysical Research Communications. 2001;282:1075–1079. doi: 10.1006/bbrc.2001.4670. [DOI] [PubMed] [Google Scholar]
- Danon A, Rotari VI, Gordon A, Mailhac N, Gallois P. Ultraviolet-C overexposure induces programmed cell death in Arabidopsis, which is mediated by caspase-like activities and which can be suppressed by caspase inhibitors, p35 and Defender against Apoptotic Death. Journal of Biological Chemistry. 2004;279:779–787. doi: 10.1074/jbc.M304468200. [DOI] [PubMed] [Google Scholar]
- de Pinto MC, Tommasi F, De Gara L. Changes in the antioxidant systems as part of the signaling pathway responsible for the programmed cell death activated by nitric oxide and reactive oxygen species in tobacco Bright-Yellow 2 cells. Plant Physiology. 2002;130:698–708. doi: 10.1104/pp.005629. [DOI] [PMC free article] [PubMed] [Google Scholar]
- del Rio LA, Sandalio LM, Corpas FJ, Palma JM, Barroso JB. Reactive oxygen species and reactive nitrogen species in peroxisomes. Production, scavenging, and role in cell signaling. Plant Physiology. 2006;141:330–335. doi: 10.1104/pp.106.078204. [DOI] [PMC free article] [PubMed] [Google Scholar]
- Delledonne M. NO news is good news for plants. Current Opinion in Plant Biology. 2005;8:390–396. doi: 10.1016/j.pbi.2005.05.002. [DOI] [PubMed] [Google Scholar]
- Diamond M, McCabe PF. The mitochondrion and plant programmed cell death. In: DC Logan, editor. Annual Plant Reviews; Plant Mitochondria. Bognor Regis, UK: John Wiley & Sons; 2007. pp. 308–334. [Google Scholar]
- Doyle SM, Diamond M, McCabe PF. Chloroplast and reactive oxygen species involvement in apoptotic-like programmed cell death in Arabidopsis suspension cultures. Journal of Experimental Botany. 2010;61:473–482. doi: 10.1093/jxb/erp320. [DOI] [PMC free article] [PubMed] [Google Scholar]
- Fortes AM, Costa J, Santos F, Seguí-simarro JM, Palme K, Altabell T, Tiburcio AF, Pais S. Arginine decarboxylase expression, polyamines biosynthesis and reactive oxigen species during organogenic nodule formation in hop. Plant Signalling and Behavior. 2011;6:258–269. doi: 10.4161/psb.6.2.14503. [DOI] [PMC free article] [PubMed] [Google Scholar]
- Gadjev I, Vanderauwera S, Gechev TS, Laloi C, Minkov IN, Shulaev V, Apel K, Inze D, Mittler R, Van Breusegem F. Transcriptomic footprints disclose specificity of reactive oxygen species signaling in Arabidopsis. Plant Physiology. 2006;141:436–445. doi: 10.1104/pp.106.078717. [DOI] [PMC free article] [PubMed] [Google Scholar]
- Gao CJ, Xing D, Li LL, Zhang LR. Implication of reactive oxygen species and mitochondrial dysfunction in the early stages of plant programmed cell death induced by ultraviolet-C overexposure. Planta. 2008;227:755–767. doi: 10.1007/s00425-007-0654-4. [DOI] [PubMed] [Google Scholar]
- Gechev TS, Hille J. Hydrogen peroxide as a signal controlling plant programmed cell death. Journal of Cell Biology. 2005;168:17–20. doi: 10.1083/jcb.200409170. [DOI] [PMC free article] [PubMed] [Google Scholar]
- Gechev TS, Van Breusegem F, Stone JM, Denev I, Laloi C. Reactive oxygen species as signals that modulate plant stress responses and programmed cell death. Bioessays. 2006;28:1091–1101. doi: 10.1002/bies.20493. [DOI] [PubMed] [Google Scholar]
- González-Melendi P, Ramírez C, Testillano P, Kumlehn J, Risueño M. Three dimensional confocal and electron microscopy imaging define the dynamics and mechanisms of diploidisation at early stages of barley microspore-derived embryogenesis. Planta. 2005;222:47–57. doi: 10.1007/s00425-005-1515-7. [DOI] [PubMed] [Google Scholar]
- González-Melendi P, Testillano PS, Ahmadian P, Reyes J, Risueno MC. Immunoelectron microscopy of PCNA as an efficient marker for studying replication times and sites during pollen development. Chromosoma. 2000;109:397–409. doi: 10.1007/s004120000091. [DOI] [PubMed] [Google Scholar]
- Green D, Kroemer G. The central executioners of apoptosis: caspases or mitochondria? Trends in Cell Biology. 1998;8:267–271. doi: 10.1016/s0962-8924(98)01273-2. [DOI] [PubMed] [Google Scholar]
- Hatsugai N, Kuroyanagi M, Yamada K, Meshi T, Tsuda S, Kondo M, Nishimura M, Hara-Nishimura I. A plant vacuolar protease, VPE, mediates virus-induced hypersensitive cell death. Science. 2004;305:855–858. doi: 10.1126/science.1099859. [DOI] [PubMed] [Google Scholar]
- Jabs T. Reactive oxygen intermediates as mediators of programmed cell death in plants and animals. Biochemical Pharmacology. 1999;57:231–245. doi: 10.1016/s0006-2952(98)00227-5. [DOI] [PubMed] [Google Scholar]
- Jähne A, Lazzeri PA, Jagergussen M, Lörz H. Plant-regeneration from embryogenic cell-suspensions derived from anther cultures of barley (Hordeum vulgare) Theoretical and Applied Genetics. 1991;82:74–80. doi: 10.1007/BF00231280. [DOI] [PubMed] [Google Scholar]
- Jähne A, Lörz H. Cereal microspore culture. Plant Science. 1995;109:1–12. [Google Scholar]
- Joähne-Gärtner A, Lörz H. Protocols for anther and microspore culture of barley. Methods in Molecular Biology. 1999;111:269–279. doi: 10.1385/1-59259-583-9:269. [DOI] [PubMed] [Google Scholar]
- Kasha KJ, Simion E, Oro R, Yao QA, Hu TC, Carlson AR. An improved in vitro technique for isolated microspore culture of barley. Euphytica. 2001;120:379–385. [Google Scholar]
- Kasprowicz A, Szuba A, Volkmann D, Baluska F, Wojtaszek P. Nitric oxide modulates dynamic actin cytoskeleton and vesicle trafficking in a cell type-specific manner in root apices. Journal of Experimental Botany. 2009;60:1605–1617. doi: 10.1093/jxb/erp033. [DOI] [PMC free article] [PubMed] [Google Scholar]
- Korthout H, Berecki G, Bruin W, van Duijn B, Wang M. The presence and subcellular localization of caspase 3-like proteinases in plant cells. FEBS Letters. 2000;475:139–144. doi: 10.1016/s0014-5793(00)01643-4. [DOI] [PubMed] [Google Scholar]
- Kumlehn J, Serazetdinova L, Hensel G, Becker D, Loerz H. Genetic transformation of barley (Hordeum vulgare L.) via infection of androgenetic pollen cultures with Agrobacterium tumefaciens. Plant Biotechnology Journal. 2006;4:251–261. doi: 10.1111/j.1467-7652.2005.00178.x. [DOI] [PubMed] [Google Scholar]
- Kwak JM, Nguyen V, Schroeder JI. The role of reactive oxygen species in hormonal responses. Plant Physiology. 2006;141:323–329. doi: 10.1104/pp.106.079004. [DOI] [PMC free article] [PubMed] [Google Scholar]
- Laloi C, Apel K, Danon A. Reactive oxygen signalling: the latest news. Current Opinion in Plant Biology. 2004;7:323–328. doi: 10.1016/j.pbi.2004.03.005. [DOI] [PubMed] [Google Scholar]
- Lam E, del Pozo O. Caspase-like protease involvement in the control of plant cell death. Plant Molecular Biology. 2000;44:417–428. doi: 10.1023/a:1026509012695. [DOI] [PubMed] [Google Scholar]
- Leist M. The shape of cell death. Biochemical and Biophysical Research Communications. 1997;236:1–9. doi: 10.1006/bbrc.1997.6890. [DOI] [PubMed] [Google Scholar]
- Lemonnier-Le Penhuizic C, Chatelet C, Kloareg B, Potin P. Carrageenan oligosaccharides enhance stress-induced microspore embryogenesis in Brassica oleracea var. italica. Plant Science. 2001;160:1211–1220. doi: 10.1016/s0168-9452(01)00372-7. [DOI] [PubMed] [Google Scholar]
- Levine A, Tenhaken R, Dixon R, Lamb C. H2O2 from the oxidative burst orchestrates the plant hypersensitive disease resistance response. Cell. 1994;79:583–593. doi: 10.1016/0092-8674(94)90544-4. [DOI] [PubMed] [Google Scholar]
- Liu WG, Zheng MY, Polle EA, Konzak CF. Highly efficient doubled-haploid production in wheat (Triticum aestivum L.) via induced microspore embryogenesis. Crop Science. 2002;42:686–692. [Google Scholar]
- Lorrain S, Vailleau F, Balague C, Roby D. Lesion mimic mutants: keys for deciphering cell death and defense pathways in plants? Trends in Plant Science. 2003;8:263–271. doi: 10.1016/S1360-1385(03)00108-0. [DOI] [PubMed] [Google Scholar]
- Lührs R, Lörz H. Initiation of morphogenic cell-suspension and protoplast cultures of barley (Hordeum vulgare L.) Planta. 1988;175:71–81. doi: 10.1007/BF00402883. [DOI] [PubMed] [Google Scholar]
- Maraschin SDF, Caspers M, Potokina E, Wülfert F, Graner A, Spaink HP, Wang M. cDNA array analysis of stress-induced gene expression in barley androgenesis. Physiologia Plantarum. 2006;127:535–550. [Google Scholar]
- Maraschin SDF, Gaussand G, Pulido A, Olmedilla A, Lamers GEM, Korthout H, Spaink HP, Wang M. Programmed cell death during the transition from multicellular structures to globular embryos in barley androgenesis. Planta. 2005;221:459–470. doi: 10.1007/s00425-004-1460-x. [DOI] [PubMed] [Google Scholar]
- Mittler R. Oxidative stress, antioxidants and stress tolerance. Trends in Plant Science. 2002;7:405–410. doi: 10.1016/s1360-1385(02)02312-9. [DOI] [PubMed] [Google Scholar]
- Mittler R, Rizhsky L. Transgene-induced lesion mimic. Plant Molecular Biology. 2000;44:335–344. doi: 10.1023/a:1026544625898. [DOI] [PubMed] [Google Scholar]
- Mittler R, Vanderauwera S, Gollery M, Van Breusegem F. Reactive oxygen gene network of plants. Trends in Plant Science. 2004;9:490–498. doi: 10.1016/j.tplants.2004.08.009. [DOI] [PubMed] [Google Scholar]
- Mittler R, Vanderauwera S, Suzuki N, Miller G, Tognetti VB, Vandepoele K, Gollery M, Shulaev V, Breusegem FV. ROS signalling: the new wave? Trends in Plant Science. 2011;16:300–309. doi: 10.1016/j.tplants.2011.03.007. [DOI] [PubMed] [Google Scholar]
- Muñoz-Amatriain M, Svensson JT, Castillo AM, Close TJ, Vallés MP. Microspore embryogenesis: assignement of genes to embryo formation and green vs. albino plant production. Functional and Integrative Genomics. 2009;9:311–323. doi: 10.1007/s10142-009-0113-3. [DOI] [PMC free article] [PubMed] [Google Scholar]
- Murashige T, Skoog F. A revised medium for rapid growth and bio assays with tobacco tissue cultures. Physiologia Plantarum. 1962;15:473–497. [Google Scholar]
- Neill S. NO way to die – nitric oxide, programmed cell death and xylogenesis. New Phytologist. 2005;165:5–8. doi: 10.1111/j.1469-8137.2004.01267.x. [DOI] [PubMed] [Google Scholar]
- Neill S, Barros R, Bright J, Desikan R, Hancock J, Harrison J, Morris P, Ribeiro D, Wilson I. Nitric oxide, stomatal closure, and abiotic stress. Journal of Experimental Botany. 2008;59:165–176. doi: 10.1093/jxb/erm293. [DOI] [PubMed] [Google Scholar]
- Neill S, Desikan R, Hancock J. Hydrogen peroxide signalling. Current Opinion in Plant Biology. 2002;5:388–395. doi: 10.1016/s1369-5266(02)00282-0. [DOI] [PubMed] [Google Scholar]
- Neill SJ, Desikan R, Hancock JT. Nitric oxide signaling in plant. New Phytologist. 2003;159:11–35. doi: 10.1046/j.1469-8137.2003.00804.x. [DOI] [PubMed] [Google Scholar]
- Oleszczuk S, Sowa S, Zimny J. Androgenic response to preculture stress in microspore cultures of barley. Protoplasma. 2006;228:95–100. doi: 10.1007/s00709-006-0179-x. [DOI] [PubMed] [Google Scholar]
- Otvos K, Pasternak TP, Miskolczi P, Domoki M, Dorjgotov D, Szucs A, Bottka S, Dudits D, Feher A. Nitric oxide is required for, and promotes auxin-mediated activation of, cell division and embryogenic cell formation but does not influence cell cycle progression in alfalfa cell cultures. Plant Journal. 2005;43:849–860. doi: 10.1111/j.1365-313X.2005.02494.x. [DOI] [PubMed] [Google Scholar]
- Pechan PM, Keller WA. Induction of microspore embryogenesis in Brassica napus L by gamma-irradiation and ethanol stress. in vitro Cellular and Developmental Biology. 1989;25:1073–1074. [Google Scholar]
- Petricka JJ, Van-Norman JM, Benfey PN. Symmetry breaking in plants: molecular mechanisms regulating asymmetric cell divisions in Arabidopsis. Cold Spring Harbor Perspectives in Biology. 2009;1:a000497. doi: 10.1101/cshperspect.a000497. [DOI] [PMC free article] [PubMed] [Google Scholar]
- Petrussa E, Bertolini A, Casolo V, Krajnakova J, Macri F, Vianello A. Mitochondrial bioenergetics linked to the manifestation of programmed cell death during somatic embryogenesis of Abies alba. Planta. 2009;231:93–107. doi: 10.1007/s00425-009-1028-x. [DOI] [PubMed] [Google Scholar]
- Raff MC, Durand B, Gao FB. Cell number control and timing in animal development: the oligodendrocyte cell lineage. International Journal of Developmental Biology. 1998;42:263–267. [PubMed] [Google Scholar]
- Reape TJ, McCabe PF. Apoptotic-like programmed cell death in plants. New Phytologist. 2008;180:13–26. doi: 10.1111/j.1469-8137.2008.02549.x. [DOI] [PubMed] [Google Scholar]
- Reape TJ, McCabe PF. Apoptotic-like regulation of programmed cell death in plants. Apoptosis. 2010;15:249–256. doi: 10.1007/s10495-009-0447-2. [DOI] [PubMed] [Google Scholar]
- Río LAd Puppo A. Reactive Oxygen Species in Plant Signaling. Dordrecht, New York: Springer Verlag; 2009. [Google Scholar]
- Ritala A, Mannonen L, Oksman-Caldentey KM. Factors affecting the regeneration capacity of isolated barley microspores (Hordeum vulgare L.) Plant Cell Reports. 2001;20:403–407. doi: 10.1007/s002990100345. [DOI] [PubMed] [Google Scholar]
- Rodriguez-Serrano M, Romero-Puertas MC, Pazmino DM, Testillano PS, Risueno MC, del Rio LA, Sandalio LM. Cellular response of pea plants to cadmium toxicity: cross talk between reactive oxygen species, nitric oxide, and calcium. Plant Physiology. 2009;150:229–243. doi: 10.1104/pp.108.131524. [DOI] [PMC free article] [PubMed] [Google Scholar]
- RomeroPuertas MC. Cadmium-induced subcellular accumulation of O2 and H2O2 in pea leaves. Plant, Cell and Environment. 2004;27:1122–1134. [Google Scholar]
- Satpute GK, Long H, Segui-Simarro JM, Risueno MC, Testillano PS. Cell architecture during gametophytic and embryogenic microspore development in Brassica napus L. Acta Physiologiae Plantarum. 2005;27:665–674. [Google Scholar]
- Segui-Simarro JM, Testillano PS, Risueno MC. Hsp70 and Hsp90 change their expression and subcellular localization after microspore embryogenesis induction in Brassica napus L. Journal of Structural Biology. 2003;142:379–391. doi: 10.1016/s1047-8477(03)00067-4. [DOI] [PubMed] [Google Scholar]
- Smykal P, Pechan PM. Stress, as assessed by the appearance of sHsp transcripts, is required but not sufficient to initiate androgenesis. Physiologia Plantarum. 2000;110:135–143. [Google Scholar]
- Sunderland N, Roberts M, Evans LJ, Wildon DC. Multicellular pollen formation in cultured barley anthers.1. Independent division of the generative and vegetative cells Journal of Experimental Botany. 1979;30:1133–1144. [Google Scholar]
- Testillano P, Georgiev S, Mogensen HL, Coronado MJ, Dumas C, Risueno MC, Matthys-Rochon E. Spontaneous chromosome doubling results from nuclear fusion during in vitro maize induced microspore embryogenesis. Chromosoma. 2004;112:342–349. doi: 10.1007/s00412-004-0279-3. [DOI] [PubMed] [Google Scholar]
- Touraev A, Indrianto A, Wratschko I, Vicente O, Heberle-Bors E. Efficient microspore embryogenesis in wheat (Triticum aestivum L.) induced by starvation at high temperature. Sexual Plant Reproduction. 1996;9:209–215. [Google Scholar]
- Touraev A, Vicente O, HeberleBors E. Initiation of microspore embryogenesis by stress. Trends in Plant Science. 1997;2:297–302. [Google Scholar]
- Uren AG, O’Rourke K, Aravind L, Pisabarro MT, Seshagiri S, Koonin EV, Dixit VM. Identification of paracaspases and metacaspases: two ancient families of caspase-like proteins, one of which plays a key role in MALT lymphoma. Molecular Cell. 2000;6:961–967. doi: 10.1016/s1097-2765(00)00094-0. [DOI] [PubMed] [Google Scholar]
- Vacca RA, de Pinto MC, Valenti D, Passarella S, Marra E, De Gara L. Production of reactive oxygen species, alteration of cytosolic ascorbate peroxidase, and impairment of mitochondrial metabolism are early events in heat shock-induced programmed cell death in tobacco Bright-Yellow 2 cells. Plant Physiology. 2004;134:1100–1112. doi: 10.1104/pp.103.035956. [DOI] [PMC free article] [PubMed] [Google Scholar]
- Vacca RA, Valenti D, Bobba A, Merafina RS, Passarella S, Marra E. Cytochrome c is released in a reactive oxygen species-dependent manner and is degraded via caspase-like proteases in tobacco Bright-Yellow 2 cells en route to heat shock-induced cell death. Plant Physiology. 2006;141:208–219. doi: 10.1104/pp.106.078683. [DOI] [PMC free article] [PubMed] [Google Scholar]
- Van Breusegem F, Dat JF. Reactive oxygen species in plant cell death. Plant Physiology. 2006;141:384–390. doi: 10.1104/pp.106.078295. [DOI] [PMC free article] [PubMed] [Google Scholar]
- Vranova E, Inze D, Van Breusegem F. Signal transduction during oxidative stress. Journal of Experimental Botany. 2002;53:1227–1236. [PubMed] [Google Scholar]
- Wendehenne D, Pugin A, Klessig DF, Durner J. Nitric oxide: comparative synthesis and signaling in animal and plant cells. Trends in Plant Science. 2001;6:177–183. doi: 10.1016/s1360-1385(01)01893-3. [DOI] [PubMed] [Google Scholar]
- Wilkinson MJ, Davenport IJ, Charters YM, Jones AE, Allainguillaume J, Butler HT, Mason DC, Raybould AF. A direct regional scale estimate of transgene movement from genetically modified oilseed rape to its wild progenitors. Molecular Ecology. 2000;9:983–991. doi: 10.1046/j.1365-294x.2000.00986.x. [DOI] [PubMed] [Google Scholar]
- Zago E, Morsa S, Dat JF, Alard P, Ferrarini A, Inze D, Delledonne M, Van Breusegem F. Nitric oxide- and hydrogen peroxide-responsive gene regulation during cell death induction in tobacco. Plant Physiology. 2006;141:404–411. doi: 10.1104/pp.106.078444. [DOI] [PMC free article] [PubMed] [Google Scholar]
- Zaninotto F, La Camera S, Polverari A, Delledonne M. Cross talk between reactive nitrogen and oxygen species during the hypersensitive disease resistance response. Plant Physiology. 2006;141:379–383. doi: 10.1104/pp.106.078857. [DOI] [PMC free article] [PubMed] [Google Scholar]
- Zhang SG, Han SY, Yang WH, Wei HL, Zhang M, Qi LW. Changes in H2O2 content and antioxidant enzyme gene expression during the somatic embryogenesis of Larix leptolepis. Plant Cell Tissue and Organ Culture. 2010;100:21–29. [Google Scholar]
- Zhao H, Kalivendi S, Zhang H, Joseph J, Nithipatikom K, Vasquez-Vivar J, Kalyanaraman B. Superoxide reacts with hydroethidine but forms a fluorescent product that is distinctly different from ethidium: potential implications in intracellular fluorescence detection of superoxide. Free Radicical Biology and Medicine. 2003;34:1359–1368. doi: 10.1016/s0891-5849(03)00142-4. [DOI] [PubMed] [Google Scholar]
- Żur I, Dubas E, Golemiec E, Szechyńska-Hebda M, Gołębiowska G, Wędzony M. Stress-related variation in antioxidative enzymes activity and cell metabolism efficiency associated with embryogenesis induction in isolated microspore culture of triticale (× Triticosecale Wittm.) Plant Cell Reports. 2009;28:1279–1287. doi: 10.1007/s00299-009-0730-2. [DOI] [PubMed] [Google Scholar]


